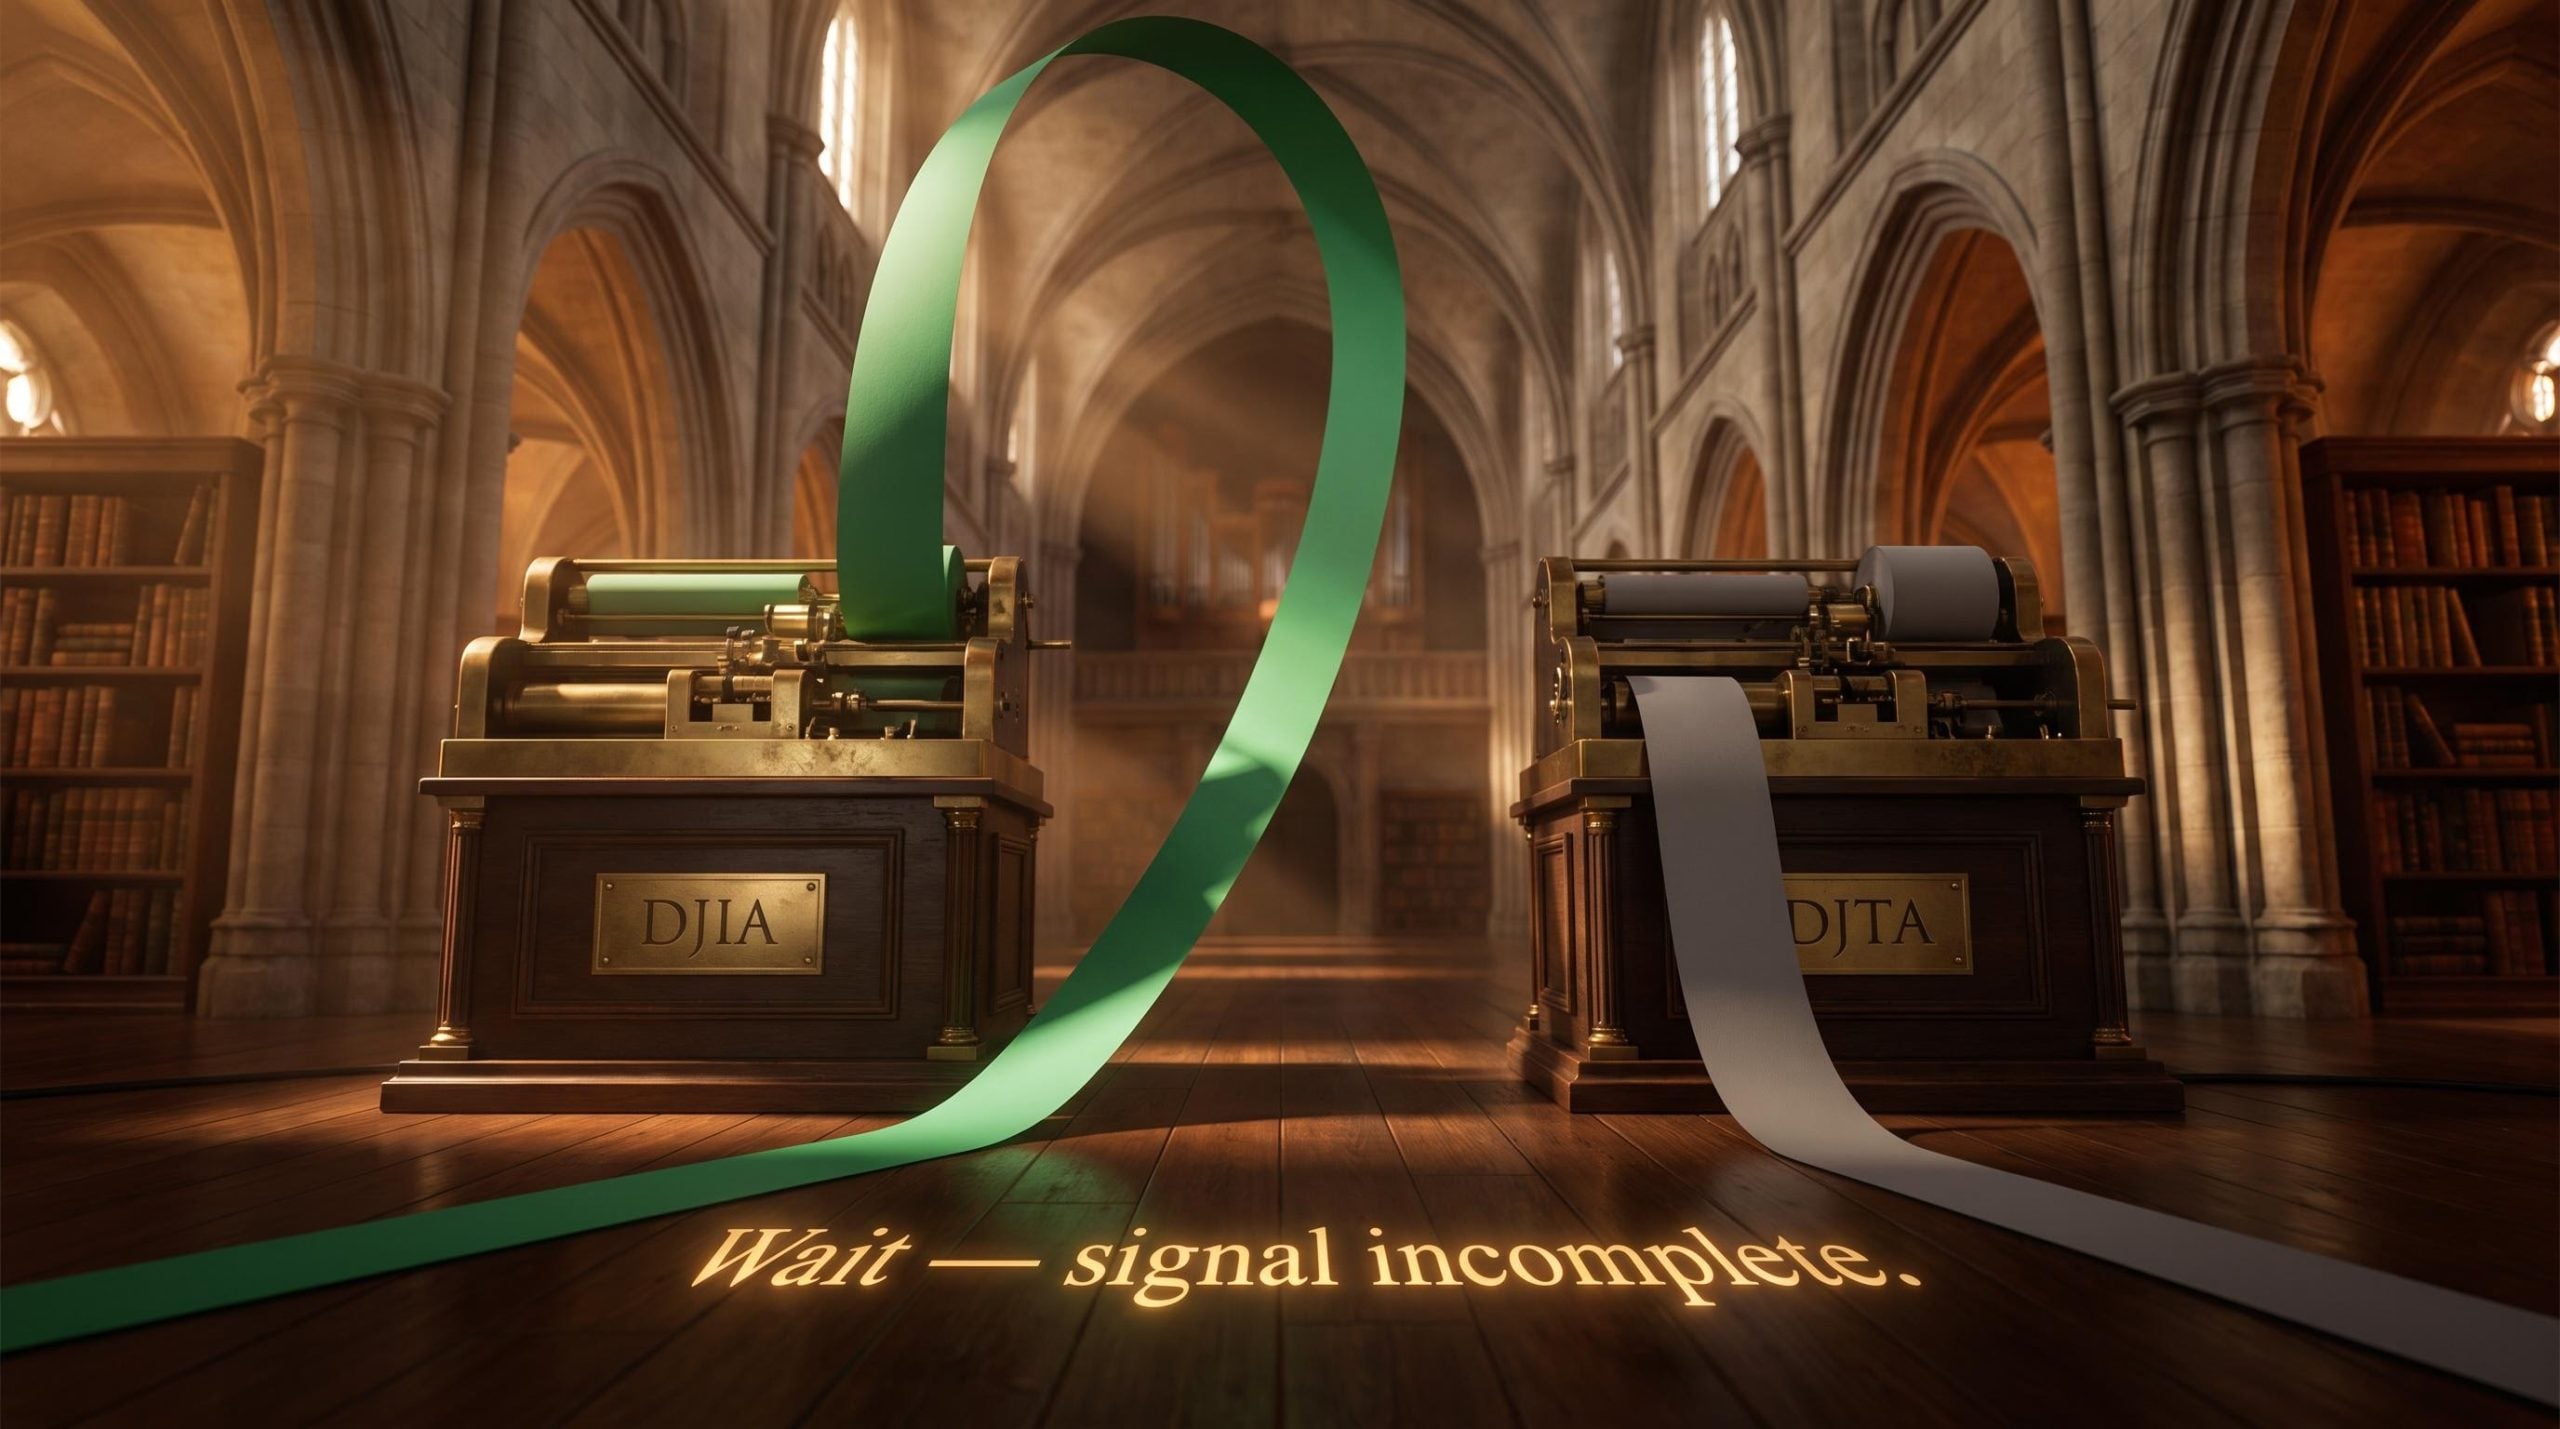
Charles Dow built his framework for reading markets before the Federal Reserve existed, before electronic trading, and before derivatives reshaped how capital moves. He published his observations in the Wall Street Journal in the late 1890s. More than a century later, professional analysts still reference his work when assessing whether a market trend is real or a false signal.
That persistence raises a fair question. Market indexes generate signals constantly, and most of them amount to noise. A single day’s move, a headline-driven spike, a sector rotation that reverses within a week: none of these tell you whether the broader market has genuinely changed direction. Dow Theory offers one of the oldest structured answers to that problem, built around a specific requirement that two indexes must agree before a trend is confirmed.
Here is what this piece gives you. After reading it, you will know exactly what Dow Theory looks for when identifying a market trend, why it demands confirmation from two separate indexes before treating any move as meaningful, and how the three-phase trend cycle helps you assess where a market may sit in its lifecycle. You will also understand the structural quirks of the Dow Jones Industrial Average itself, and why those quirks matter when you interpret signals the index produces.
Why Dow Theory requires two indexes to agree
Picture this scenario: the Dow Jones Industrial Average (DJIA) breaks to a new high. Headlines run with it. But the Dow Jones Transportation Average (DJTA) has not confirmed. It is sitting flat, or worse, it is declining.
In that moment, Dow Theory tells you something specific: do nothing. The signal is incomplete.
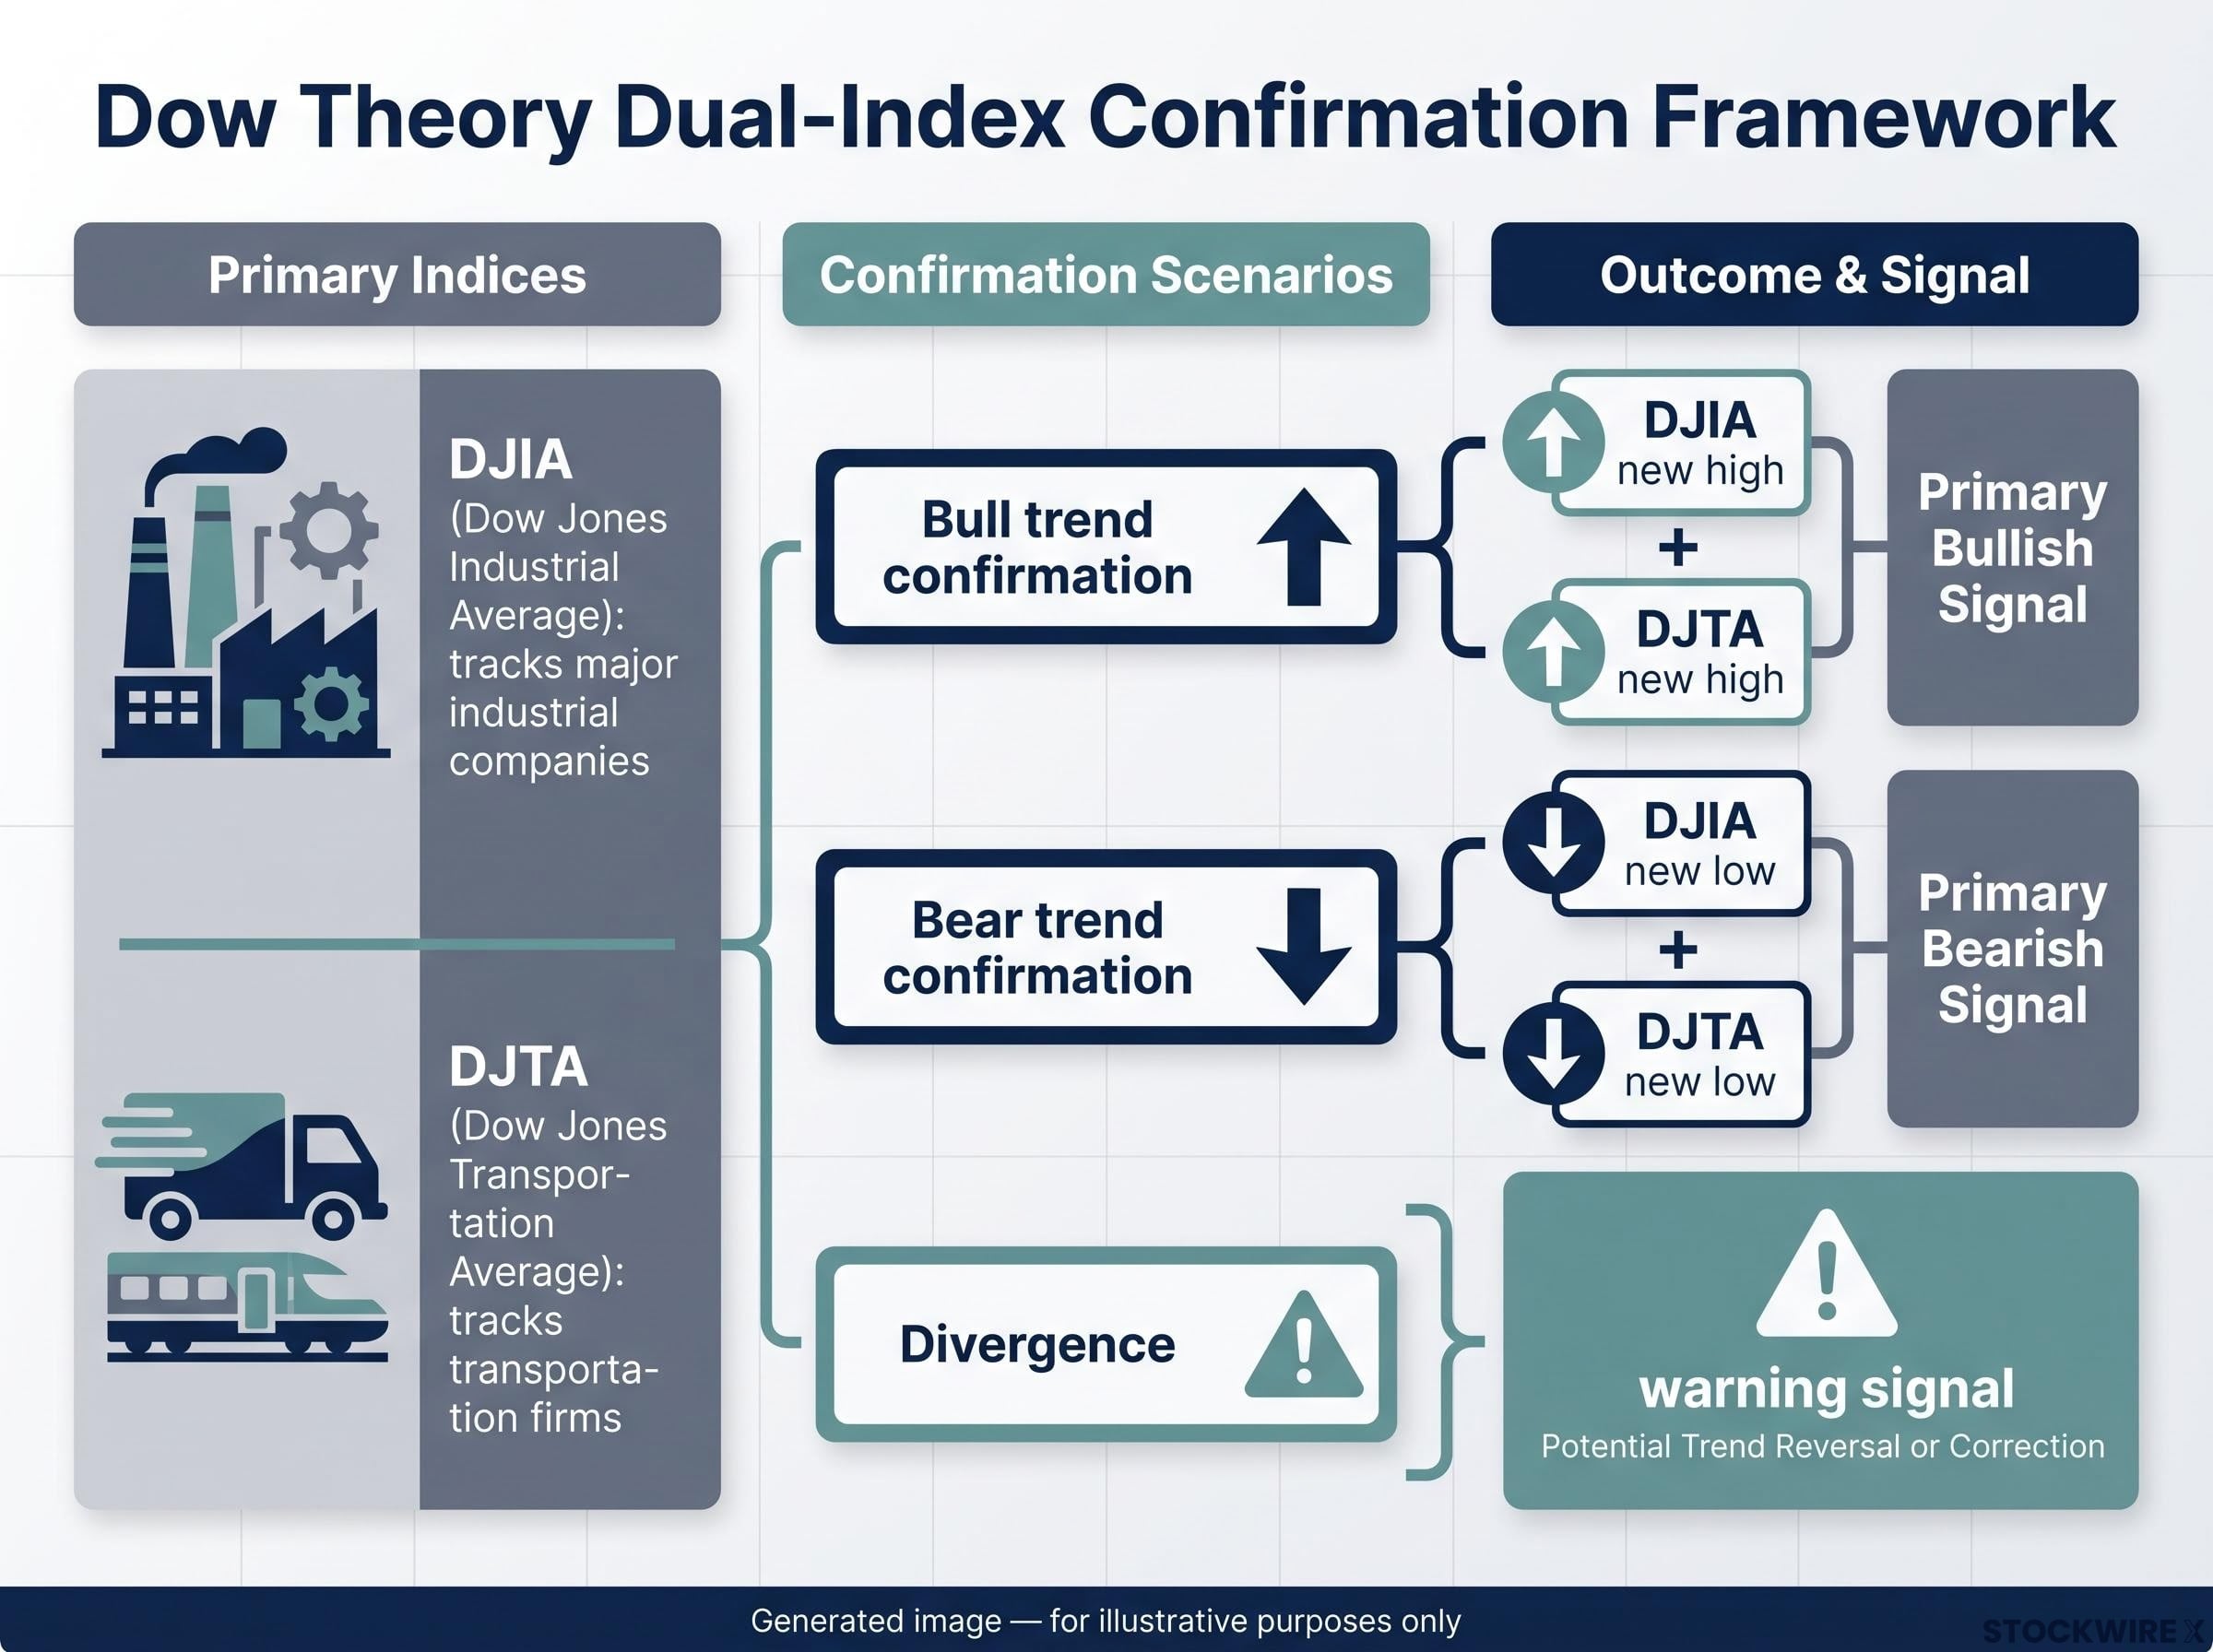
The dual-index confirmation requirement is the mechanism at the centre of the framework. A primary trend, whether bullish or bearish, is not considered valid until both the DJIA and the DJTA make corresponding moves:
- Bull trend confirmation: The DJIA makes a new high and the DJTA makes a corresponding new high.
- Bear trend confirmation: The DJIA makes a new low and the DJTA makes a corresponding new low.
The logic behind this pairing is economic, not arbitrary. The DJIA tracks major industrial companies; the DJTA tracks transportation firms. If goods are being manufactured (industrials rising) but not shipped (transports lagging), the economic momentum suggested by one index is not being validated by the other. The signal is incomplete because the underlying economic activity is incomplete.
Index-level distortions can make a Dow Theory confirmation signal look cleaner than the underlying data warrants; the April 2026 transportation average surge was partly driven by a short squeeze in a single component stock, illustrating how mechanical vulnerabilities in price-weighted indexes can produce misleading trend reads.
When one index makes new highs or new lows while the other fails to confirm, Dow Theory treats that divergence as a warning signal, not a green light. The prevailing trend may be weakening or reversing.
This is not a technical formality. It is a deliberate filter. If you see only one index moving, the framework’s instruction is clear: wait, do not act. The confirmation requirement exists specifically to reduce false signals, and understanding it is the conceptual unlock that makes every other component of Dow Theory make sense.
When big ASX news breaks, our subscribers know first
How Dow Theory classifies market movements
Not all price movement carries the same weight. Dow Theory separates market activity into three tiers, and the hierarchy matters because it tells you which movements are worth paying attention to and which you can afford to ignore.
| Trend Type | Typical Duration | Role in Dow Theory |
|---|---|---|
| Primary trend | Approximately one to several years | The major directional move; the signal Dow Theory is designed to identify and follow |
| Secondary trend | Weeks to months | Counter-movements within the primary trend; corrections, not reversals, unless dual-index confirmation says otherwise |
| Minor trend | Day-to-day fluctuations | Noise; not a target signal within the framework |
The framework is designed primarily to identify and follow primary trends. Secondary trends, the counter-movements that occur within a primary trend, can be sharp and convincing. A 10% pullback during a confirmed bull market feels significant in the moment. But Dow Theory does not treat that pullback as a reversal until the dual-index confirmation requirement is met in the opposite direction.
Minor trends, the daily fluctuations that dominate headlines and trading screens, are treated as noise within the framework. They are not the signal.
This hierarchy matters for you practically. It gives you a structured reason to avoid reacting to short-term price swings. A confirmed primary uptrend remains intact through secondary corrections until both indexes say otherwise. Knowing that distinction prevents the kind of reactive decision-making that short-term volatility tends to produce.
The three phases every primary trend moves through
Dow Theory does not just identify trends; it describes how they develop. Every primary trend, bull or bear, moves through three distinct phases. Each phase has different participants, different price behaviour, and different levels of public awareness.
- Accumulation: This is where the trend begins, quietly. Informed, forward-looking participants start positioning before the broader public recognises what is happening. Prices remain relatively contained because buying (or selling, in a bear market) is concentrated among a small group. Media coverage is minimal. Most people are not paying attention.
- Public participation: The trend becomes visible. Media coverage increases. Broader investor engagement grows, and this is where the bulk of the price move occurs. The direction that informed participants identified early is now being validated by widespread participation. Momentum builds.
- Distribution: This is the phase that catches most people off-guard. Informed participants begin exiting their positions, selling into rising prices as enthusiasm peaks. The mood is bullish. Headlines are optimistic. And the people who started the trend are quietly stepping away from it.
The period of peak public enthusiasm often coincides with informed participants exiting. Understanding this is one of the most practically useful insights in Dow Theory.
The three-phase sentiment model Dow described maps closely onto Sir John Templeton’s four-stage market cycle framework, where the distribution phase Dow identified at bull market peaks corresponds to what Templeton labelled early-stage euphoria, a period when optimism peaks and informed capital quietly exits.
The distribution phase is where your awareness of market sentiment becomes a tool, not a comfort. When everything feels most certain, the framework tells you to ask whether the informed money is still committed or already leaving.
What the bear market version looks like
The same three phases apply in reverse. Distribution comes first, as informed participants begin selling before the decline is widely recognised. Public participation follows, as selling becomes widespread and the decline accelerates. The final phase is capitulation, where the last sellers exit in panic, setting the conditions for a new accumulation phase to begin. The structure mirrors the bull market exactly; only the direction changes.
What the DJIA actually is and why its structure matters for Dow Theory
Among equity benchmarks, the DJIA has one of the longest histories in the world. Charles Dow, who co-founded the Wall Street Journal, developed it to measure how leading U.S. industrial companies were performing. Today it tracks 30 large-cap U.S. stocks selected for their prominence and trading activity.
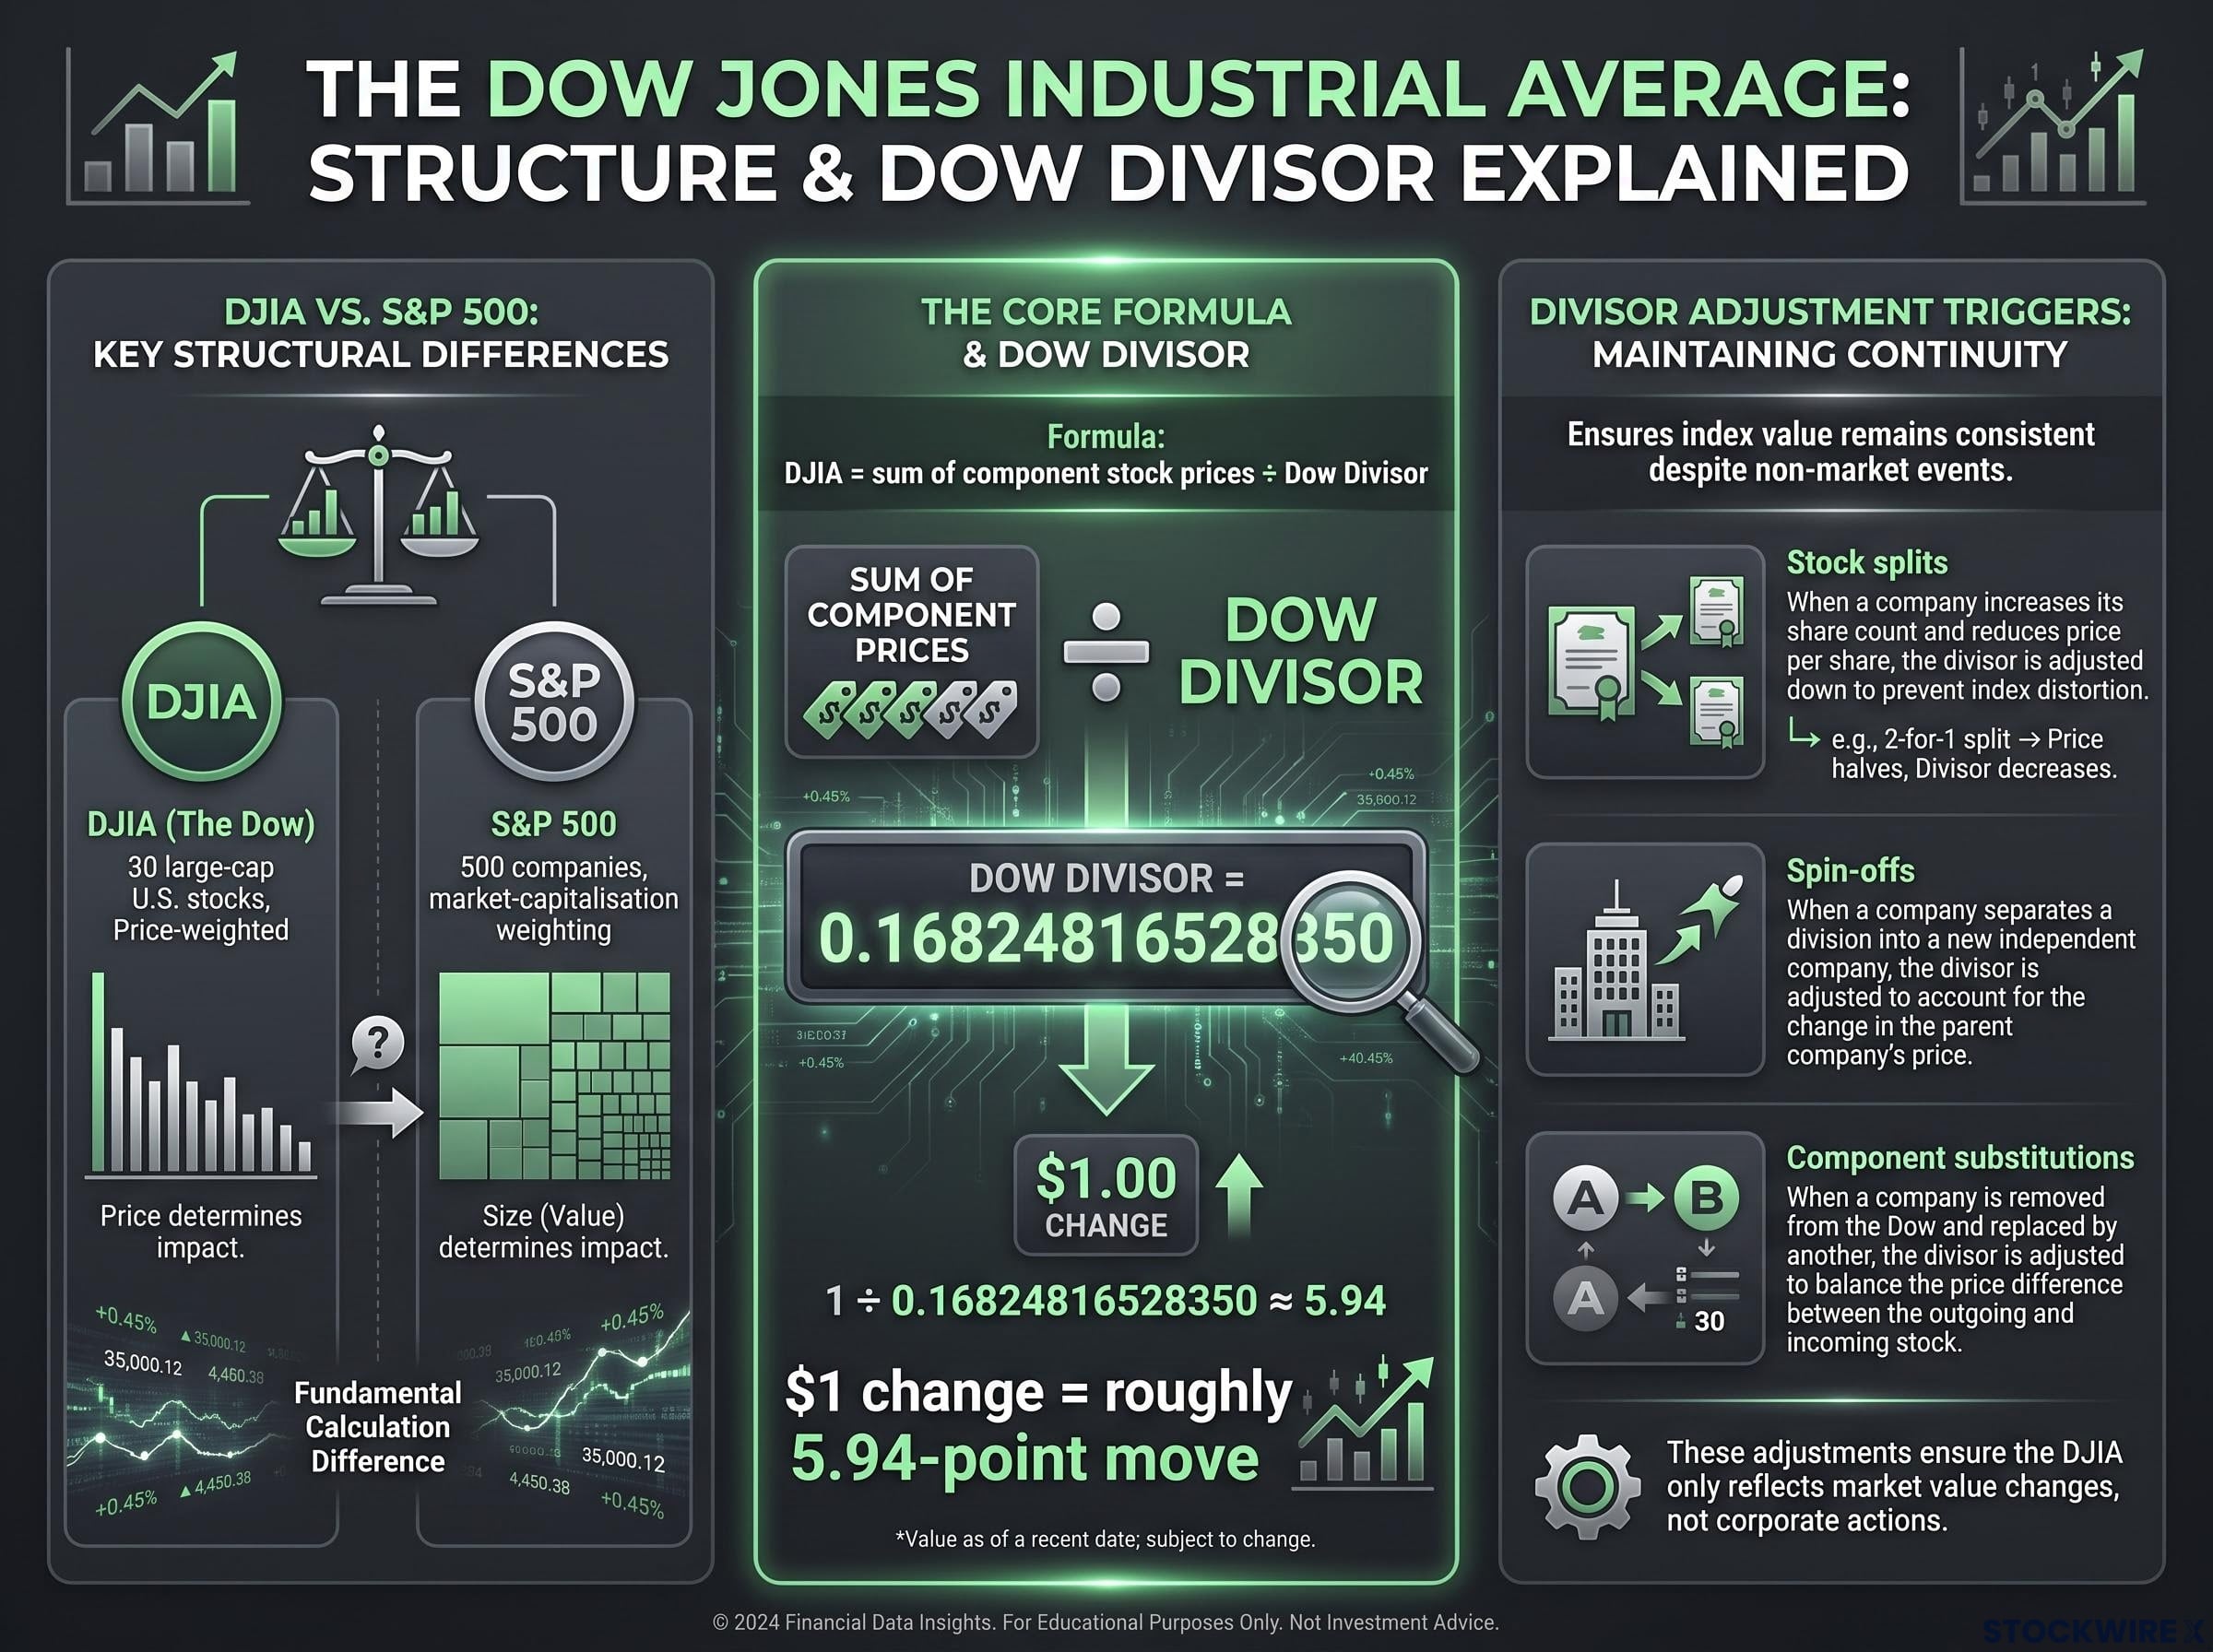
That number, 30, is worth sitting with for a moment. The S&P 500 covers 500 companies using market-capitalisation weighting, where each company’s influence on the index is proportional to its total market value. Most institutional investors regard the S&P 500 as the more representative gauge of U.S. equities. The DJIA, by contrast, uses a price-weighted methodology, meaning its value is derived by totalling the share prices of all 30 constituent stocks and dividing the result by a figure called the Dow Divisor.
The price-weighted methodology used by the DJIA dates to an era when share prices were summed by hand, and its practical consequence is that a company trading at $400 per share can move the index far more than a company worth ten times as much by total market capitalisation.
The formula is straightforward:
DJIA = sum of component stock prices ÷ Dow Divisor
The consequence of this method is significant. Higher-priced stocks exert disproportionately greater influence on the index, regardless of the company’s overall market capitalisation. A company with a $400 share price moves the DJIA far more than a company with a $50 share price, even if the lower-priced company is worth more in total market value.
The Dow Divisor currently sits at approximately 0.16824816528350, which means a $1 change in any single component stock produces roughly a 5.94-point move in the index.
That amplification effect is something you need to carry with you when interpreting DJIA-based signals. A single high-priced stock having a strong or weak day can skew the index in ways that do not reflect broader market conditions.
How the Dow Divisor keeps the index continuous
The Dow Divisor exists to prevent artificial discontinuities. Without it, certain corporate actions would cause the index to jump or drop for reasons that have nothing to do with actual market performance. Three types of corporate actions trigger a divisor adjustment:
- Stock splits: A company halving its share price through a split would otherwise cause the index to appear to drop.
- Spin-offs: Separating a business unit into an independent company alters the share price structure.
- Component substitutions: When one stock replaces another in the index, the price difference requires an adjustment.
The divisor is a maintenance tool. It keeps the index’s historical continuity intact so that comparisons over time remain meaningful. It is not an investment metric, but understanding it tells you why the DJIA’s point movements do not always mean what they appear to mean at first glance.
Volume as Dow Theory’s secondary confirmation signal
Price tells you what is happening. Volume tells you whether anyone is behind it.
In Dow Theory, volume functions as a secondary confirmation tool. The principle is straightforward: volume should expand in the direction of the primary trend and contract on counter-trend or corrective moves.
| Volume Behaviour | Signal Interpretation |
|---|---|
| Volume expands with the trend direction | Bullish or bearish confirmation; broad participation supports the move |
| Volume contracts against the trend direction | Signal weakening; the move may lack conviction and could reverse |
When a price advance is accompanied by expanding volume, it suggests that a growing number of participants are committing capital in the same direction. That is broad market conviction. When a rally occurs on declining volume, the opposite is true: fewer participants are supporting the move, and the advance may be fragile.
Volume confirmation works across multiple analytical frameworks, not just Dow Theory; the same logic of requiring broad participation before trusting a price move applies to breakout analysis, where a surge on below-average volume frequently fails to hold because too few participants are committed to the direction.
Modern complication: derivatives activity and algorithmic trading can distort straightforward volume-trend analysis, meaning volume confirmation requires more interpretive care today than in Dow’s original framework.
This is a genuine limitation. Algorithmic strategies can generate high volume without directional conviction, and derivatives markets allow participants to express views without appearing in equity volume data. Volume still matters within Dow Theory, but you should treat it as one corroborating signal among several rather than a standalone confirmation in contemporary markets.
Applying Dow Theory in modern markets: what it can and cannot tell you
Any framework is more useful when you understand its boundaries. Dow Theory does certain things well, and it has specific limitations you should be aware of before applying it.
What Dow Theory does well:
- It provides a structured, confirmation-based method for identifying major trend direction, filtering short-term noise from meaningful directional shifts.
- The dual-index confirmation requirement reduces false signals compared to single-index analysis.
- The three-phase trend cycle gives you a framework for assessing where a market may sit in its lifecycle.
What Dow Theory does not do:
- It does not time precise entry or exit points. By the time both indexes confirm a trend, some of the primary move has already occurred.
- It is inherently lagging. Confirmation is retrospective by design.
- The DJIA’s 30-stock composition means it captures a narrow slice of the U.S. equity universe, and its price-weighting introduces structural biases absent from market-cap-weighted benchmarks.
For investors who want direct exposure to the DJIA, the SPDR Dow Jones Industrial Average ETF Trust (ticker: DIA) is the primary non-leveraged, non-inverse U.S.-listed ETF tracking the index.
The key takeaway for you is calibration. Dow Theory is a signal filter, not a timing system. Its value lies in helping you avoid reacting to short-term noise rather than in identifying the exact top or bottom of any market move. Use it alongside other analytical tools, not as a standalone trading system.
This article is for informational purposes only and should not be considered financial advice. Investors should conduct their own research and consult with financial professionals before making investment decisions.
Dow Theory in 2026: a pre-digital framework with a lasting diagnostic role
The question from the opening still stands: why does a framework developed in the 1890s persist in modern market analysis?
The answer is structural, not sentimental. The dual-index confirmation logic, the three-phase trend cycle, and the volume filter were all designed to solve a specific problem: separating genuine trend shifts from short-term market noise. That problem has not changed. Markets are faster, more complex, and far more liquid than anything Charles Dow could have imagined. But the challenge of distinguishing a meaningful directional move from a temporary fluctuation is exactly the same one every investor faces today.
What you should carry forward is specific. Use Dow Theory as a trend identification lens. Apply it alongside other tools. Understand the DJIA’s price-weighted structure and its 30-stock limitation when reading index-level signals. And remember that its confirmation requirement, the demand that two indexes agree before a trend is valid, is not a relic of a simpler era. It is a filter built to protect you from acting on incomplete information, and that remains as useful in 2026 as it was when Dow first put the idea on paper.