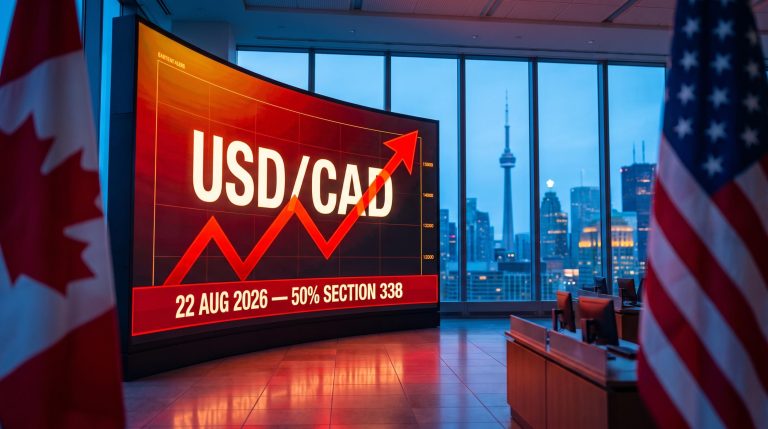
The 10-year Treasury yield hit 4.70% on Thursday, August 20. The 30-year breached 5.25%, its highest level since approximately 2007. In a single session, the bond market reminded equity investors that the rate environment powering the post-2010 growth trade no longer exists.
These yield levels have triggered repricing before, and they are doing it again, hitting the same long-duration growth and AI-infrastructure names that dominate most retail portfolios. The mid-week Treasury buyback announcement briefly looked like relief. It was not. Yields climbed straight back through by Thursday’s close.
Here is what the data tells you about three things that matter right now: why rising yields hit tech valuations harder than anything else in the current cycle, what Deutsche Bank’s assessment of the buyback expansion actually signals about policy limits, and how to distinguish a genuine recovery from a positioning bounce that fades by Monday.
Thursday’s selloff in numbers: what the bond market did to Wall Street
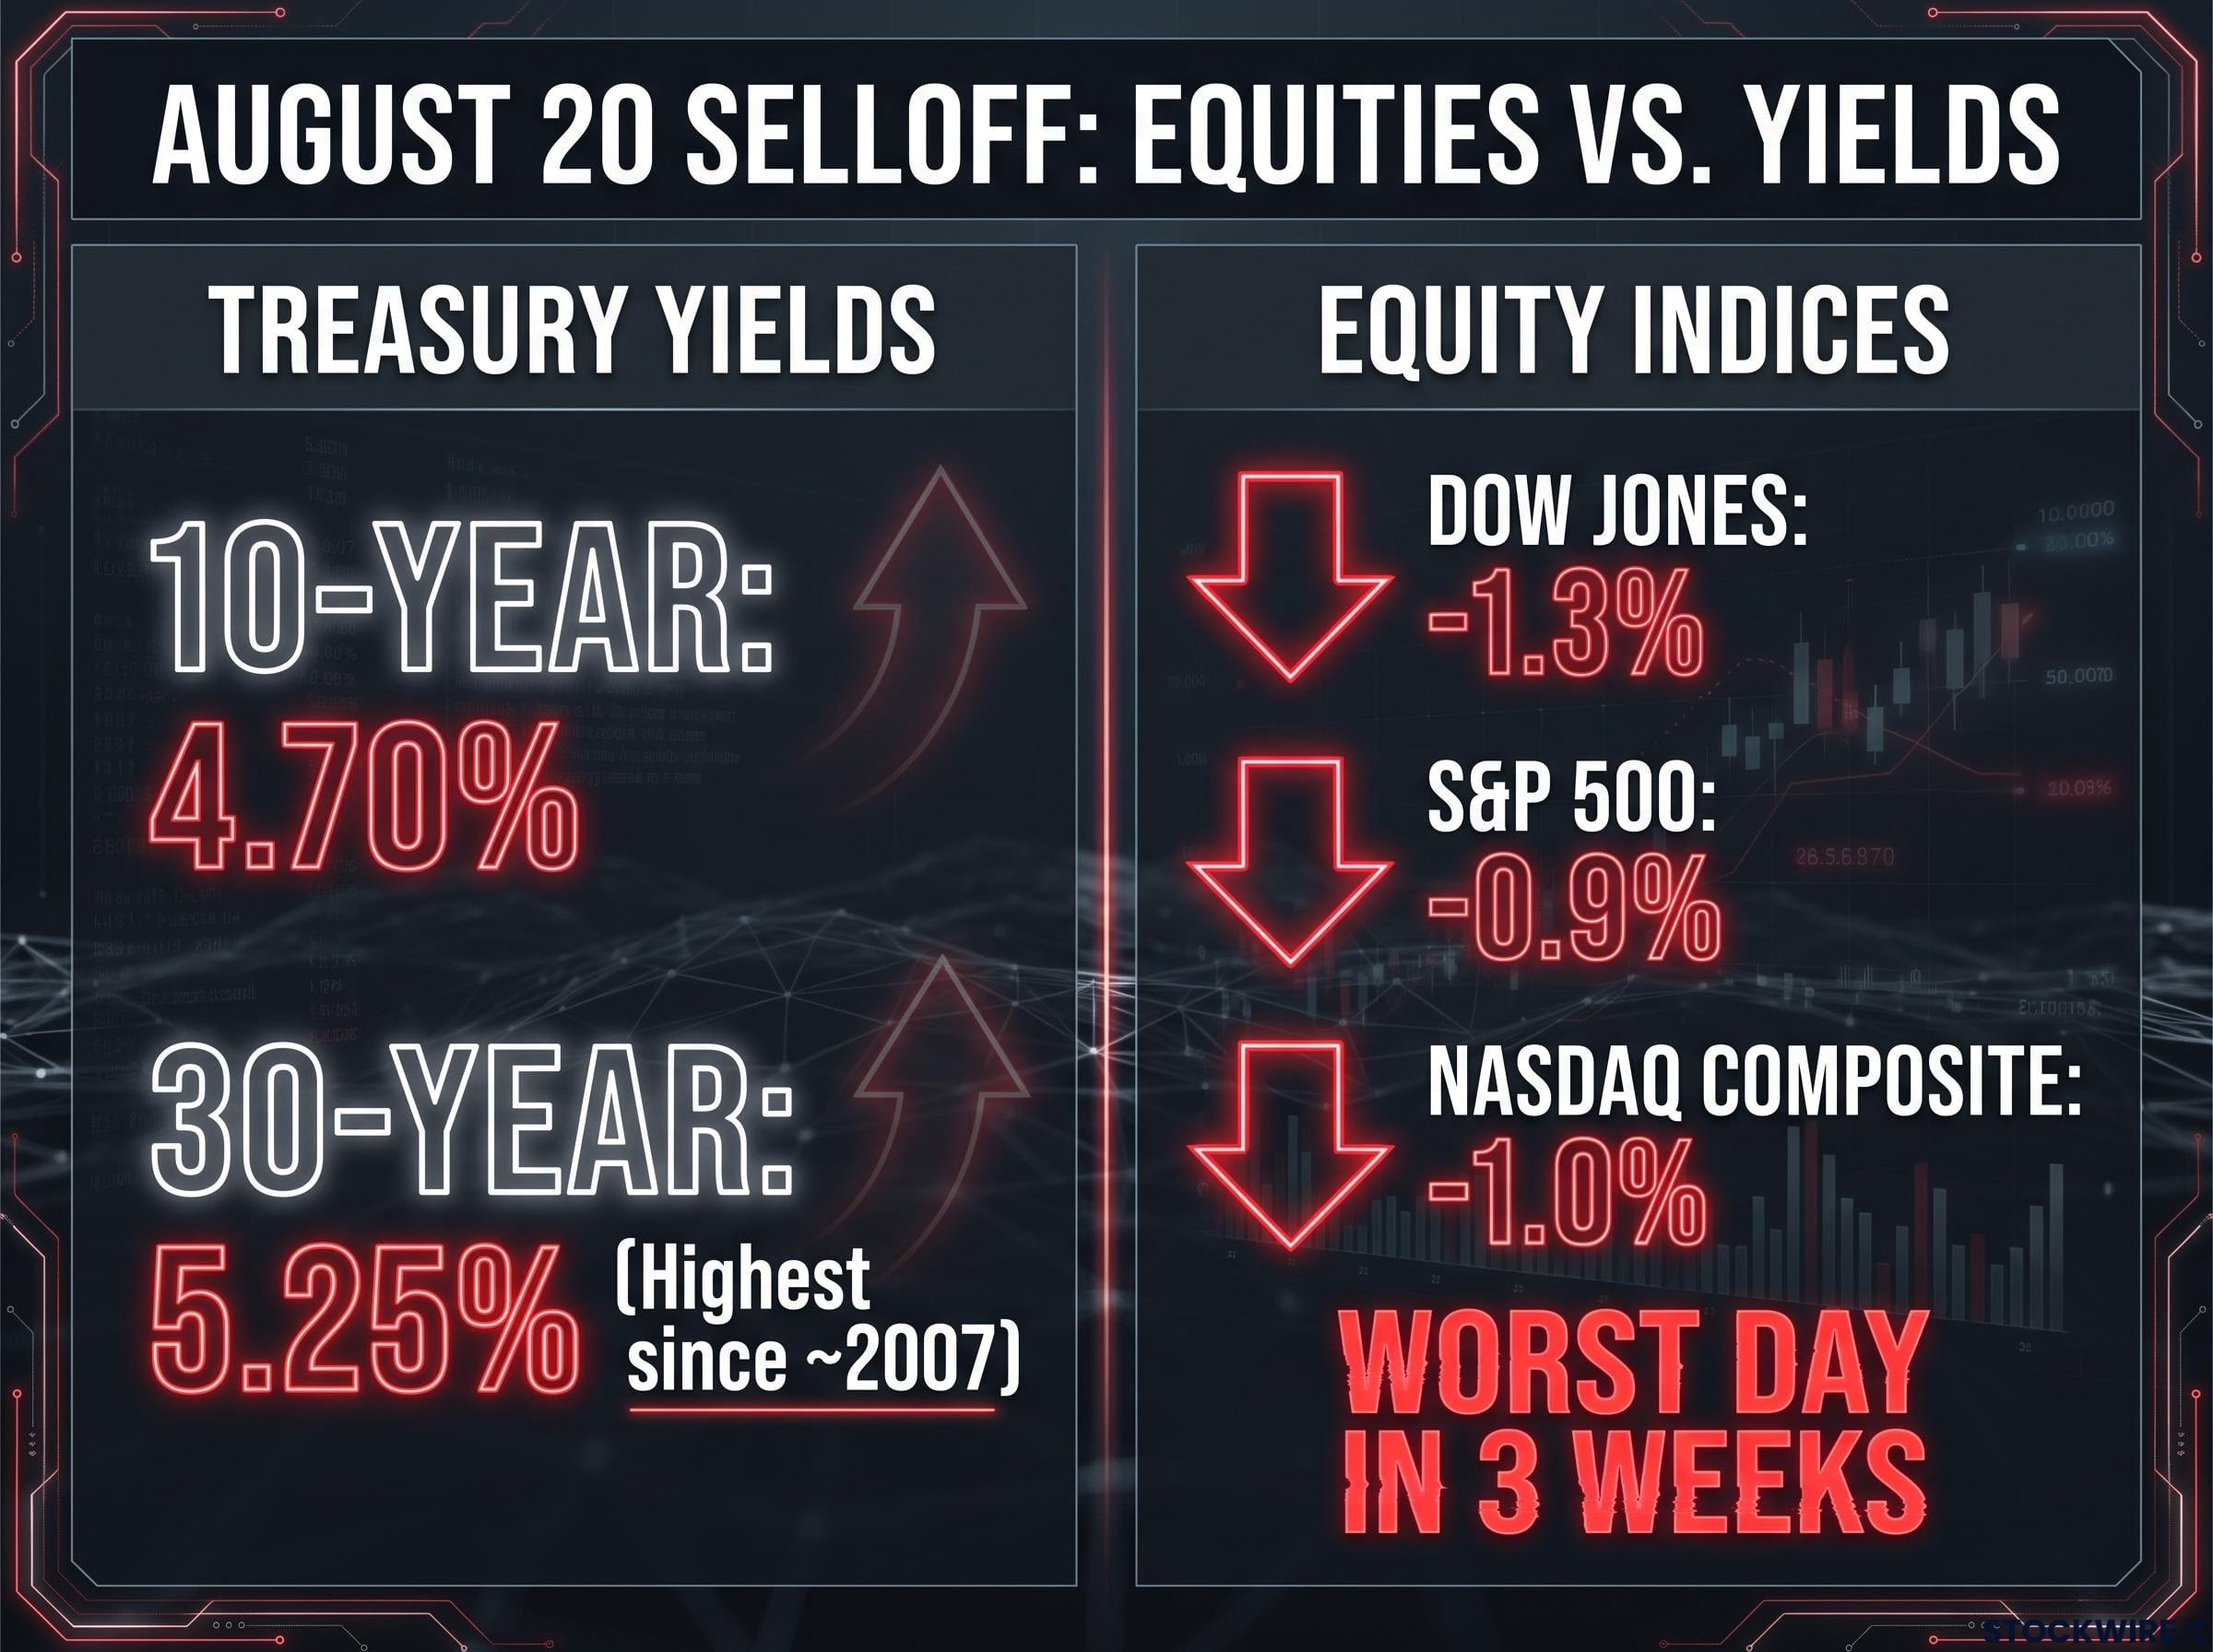
The damage was broad and precise. All three major indices recorded their steepest losses in three weeks on August 20: the Dow Jones Industrial Average dropped 1.3%, the S&P 500 declined 0.9%, and the Nasdaq Composite gave back 1.0%.
The trigger was not an earnings miss or a geopolitical headline. It was the bond market.
| Asset | Move | Level | Historical context |
|---|---|---|---|
| 10-year Treasury yield | Climbed to session high | ~4.70% | 52-week high ~4.75% |
| 30-year Treasury yield | Surged through Thursday | 5.25% | Highest since ~2007 |
| Dow Jones | -1.3% | — | Worst day in 3 weeks |
| S&P 500 | -0.9% | — | Worst day in 3 weeks |
| Nasdaq Composite | -1.0% | — | Worst day in 3 weeks |
The 30-year yield at 5.25%, with intraday peaks near 5.34% observed in mid-August, sits at levels not seen in roughly a decade. This is not a routine fluctuation. The bond market is pricing in a structurally different rate environment from the one that underwrote the post-2010 tech bull run.
The institutional selloff in long Treasuries, with PIMCO, BlackRock, and Schroders all reducing long-dated US exposure despite yields above 5%, reflects a structural reassessment of US fiscal credibility rather than a tactical trade, compounding the supply pressure that is keeping the long end elevated.
A single-day move of this scale does not always matter. This one does, because the yield levels driving it are above every threshold analysts have flagged as a headwind for equity multiples.
When big ASX news breaks, our subscribers know first
Why yields above 4.5% are a direct threat to tech valuations
The relationship between Treasury yields and tech stock prices runs through three channels, each reinforcing the others.
- Discounting distant cash flows: Tech stocks are long-duration assets, meaning most of their expected earnings sit years in the future. When the risk-free rate (the 10-year yield) rises, the discount factor applied to those distant cash flows increases, mechanically lowering their present value. Higher rates make stretched price-to-earnings multiples harder to justify.
Morgan Stanley estimates that a 100 basis point increase in real yields drives 3-4 turns of multiple compression in growth stocks with no new fundamental information required, a mechanical outcome explained by equity duration, the measure of how far into the future a stock’s cash flows sit relative to today’s price.
- Competition from bonds: Treasuries above 4.5%-5% now offer genuine income that competes with equities. Analysts at Nomura and Morgan Stanley have flagged the 4.5%-4.6% range on the 10-year as the zone where the hurdle rate for holding growth stocks rises meaningfully. The current 4.70% level sits well above that threshold.
- Rising borrowing costs for AI build-outs: This is the channel specific to this cycle, and it deserves its own examination.
The AI debt problem hiding in the rate headlines
Large-cap tech companies have been accessing corporate debt markets extensively to finance the current AI infrastructure wave: data centres, advanced chips, networking, and power capacity. As Treasury yields climb, corporate yields rise in lockstep, increasing the cost of new debt issuance and refinancing.
The result is a double hit. Equity multiples compress on the valuation side at the same time that debt service costs rise on the balance-sheet side. Earlier 2026 episodes saw pressure emerge when the 10-year reached 4.2%-4.3%. The current 4.70% level is materially above those prior thresholds. For a retail investor holding the S&P 500’s top ten names, the same AI narrative driving those positions also makes them more vulnerable to rate rises than most investors realise, because the growth story depends on cheap financing that no longer exists at the scale it once did.
The Treasury buyback play and why Deutsche Bank is not convinced
The U.S. Treasury announced an expansion of buyback operations for longer-dated government debt in mid-August, doubling the size of liquidity support operations to at least $4 billion per operation. The market’s initial read was positive: a brief mid-week rally in risk assets and a temporary pullback in yields followed the announcement.
Then Thursday arrived, and yields climbed straight back through their prior highs.
Treasury buyback limits become visible when the scale of operations is measured against a $31.5 trillion marketable debt market; the expanded $4 billion per operation programme is mechanically too small to shift the structural supply-demand balance at the long end, which is why every basis point of relief reversed within a single session.
Deutsche Bank characterised the buyback expansion as “soft-form financial repression,” a technical support measure that distorts near-term pricing, weakens the dollar, and does not address the root causes of higher yields: fiscal deficits, term premium, and inflation concerns.
That framing carries real weight for how you interpret mid-week relief rallies. If the underlying forces behind higher yields remain intact, policy interventions create temporary price distortions rather than durable turning points. The pattern in recent sessions, where yields returned to or surpassed prior highs after each bout of temporary relief, is consistent with exactly that reading. Investors who repositioned aggressively on the back of Wednesday’s rally likely gave those gains back by Thursday’s close.
What Friday’s futures bounce actually tells you
Friday morning brought the predictable recovery numbers. As of 05:53 ET on August 21, Dow futures had advanced roughly 165 points (0.3%), S&P 500 futures were higher by approximately 25 points (0.3%), and Nasdaq 100 futures had added around 186 points (0.6%).
The bounce reflects positioning mechanics, not a shift in the rate outlook. Three drivers typically power these recoveries after major down days:
- Dip-buying in benchmark tech names that institutions treat as core holdings
- Position-squaring by traders who had aggressively de-risked into the selloff
- Temporary yield stabilisation, where yields pause rather than continue surging
The distinction that matters: yields stable is not the same as yields lower. The 10-year stood near 4.694% on Friday morning, relatively unchanged from Thursday’s surge. The underlying environment had not shifted.
The Nasdaq 100 recovering 0.6% in futures while the 10-year sits at 4.694% is not a green light. Until yields drop decisively and hold lower, the valuation pressure on growth names remains structurally intact. Confusing a positioning bounce with a fundamental recovery leads to premature re-entry decisions.
Four things to watch before repositioning in tech
The analysis above converts into four specific lenses you can apply before making your next move.
- Track the 10-year yield against the headwind zone. Multiple analysts have flagged 4.5%-4.6% as the threshold where multiple pressure on growth stocks becomes meaningful. The current 4.694%-4.70% level sits materially above that line. Until the 10-year moves convincingly below it, the default assumption is continued valuation pressure.
- Map your portfolio’s rate sensitivity. Heavy exposure to high-multiple, low-current-earnings tech means high duration risk, the degree to which your holdings lose value when rates rise. If your portfolio skews heavily toward names whose valuations depend on earnings several years away, you carry more rate sensitivity than a benchmark-weighted portfolio.
- Run the AI financing diagnostic. For any large-cap tech holding with major debt-funded build-outs, the AI growth narrative is only half the picture. The balance sheet is the other half.
Reading AI balance sheets in a high-rate environment
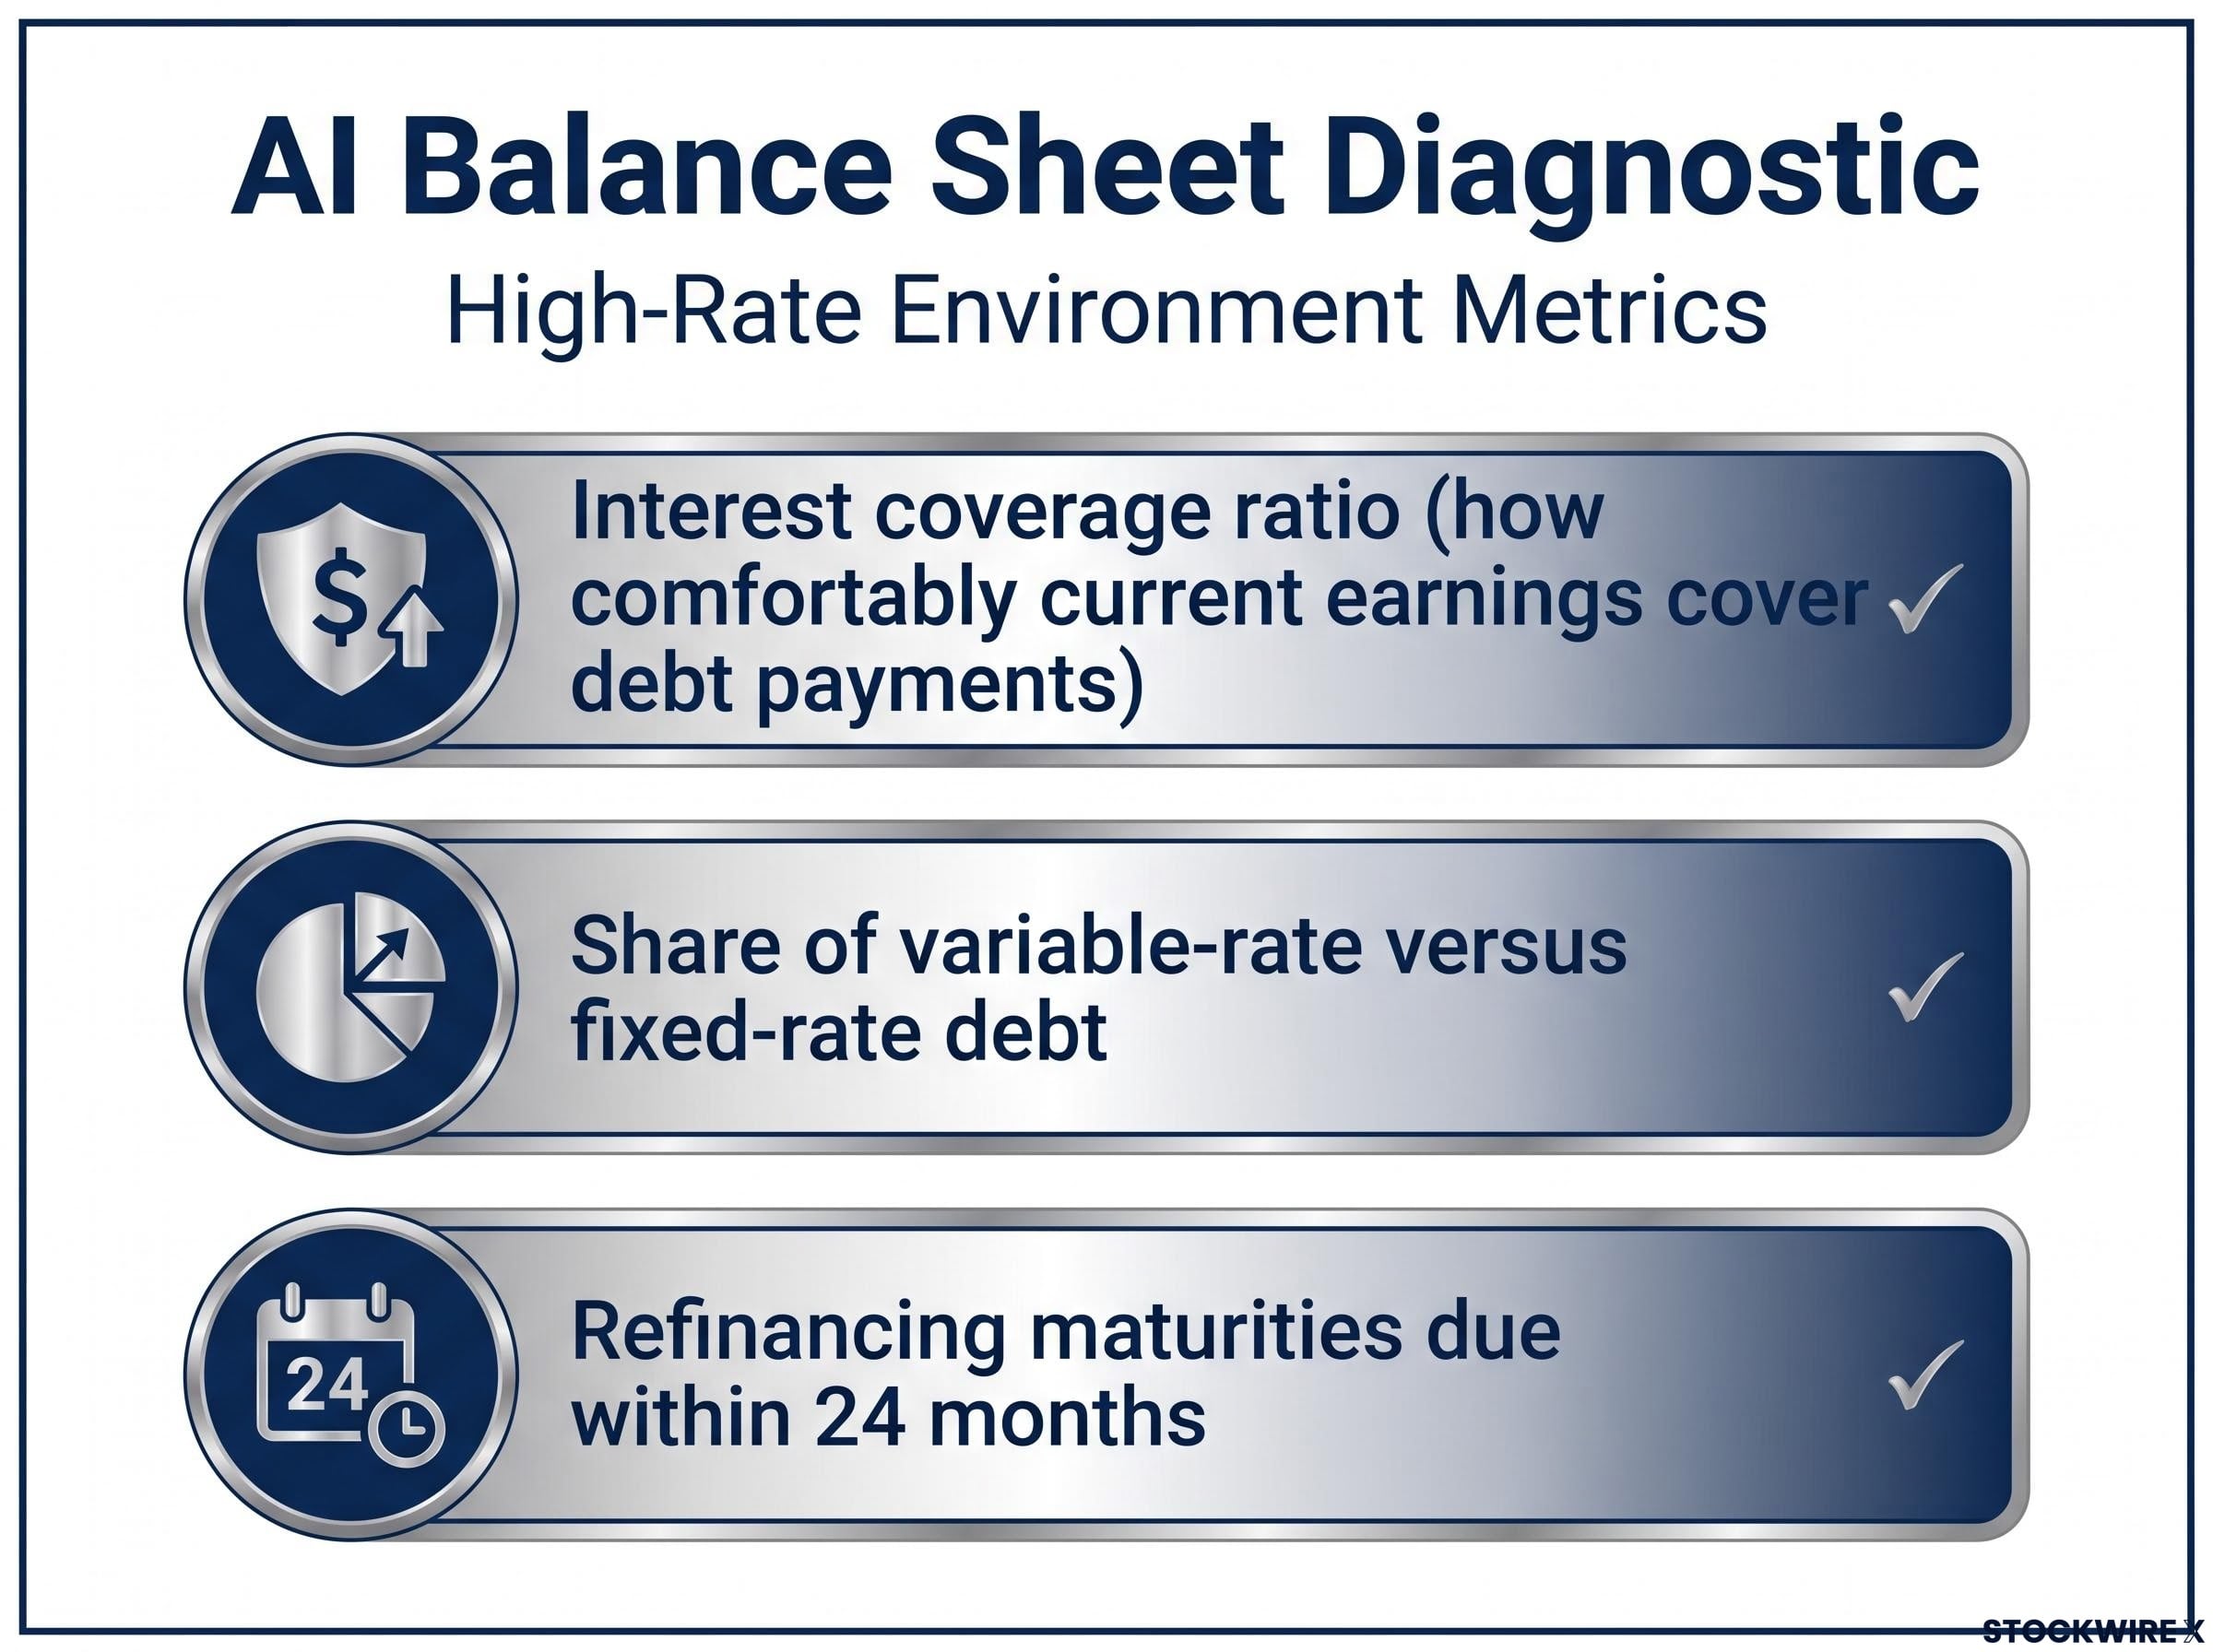
Three metrics are worth checking for any AI-heavy holding: interest coverage ratio (how comfortably current earnings cover debt payments), the share of variable-rate versus fixed-rate debt, and refinancing maturities due within 24 months. Multiple compression is visible on a stock screen. Debt stress builds more quietly over time, and it compounds when rates stay elevated.
- Apply the rally-type filter. A genuine recovery requires yields to move lower for fundamental reasons: inflation moderating, fiscal outlook improving, or Federal Reserve guidance that materially reprices the rate path. Rallies driven by Treasury intervention or positioning can reverse as soon as the next data release nudges yields higher again. Deutsche Bank’s distinction between technical support and fundamental resolution is the filter that separates signal from noise.
At current yield levels, the default assumption for investors holding high-multiple growth names should be continued valuation pressure. The burden of proof sits with the data that would justify a pivot back to rate-sensitive risk assets, not the other way around.
What changes the picture, and what does not
Not every development carries the same weight. Separating the variables that could genuinely shift the yield trajectory from the factors that create noise without resolving the underlying dynamic is how you avoid reacting to the wrong signal.
| Genuine shift signals | Noise to look through |
|---|---|
| Convincing moderation in inflation data | Treasury buyback expansions |
| Credible shift in fiscal deficit trajectory | Position-driven futures bounces |
| Fed guidance that materially reprices the rate path lower | Intraday yield stabilisations without follow-through |
The 10-year sits at 4.694%-4.70%, with its 52-week high near 4.75%. The ceiling is close and the floor has not been tested convincingly lower. As Deutsche Bank frames it, the policy response so far amounts to near-term distortion, not a durable solution.
The structural inflation regime now running above 3.8% in the US reflects 13 simultaneous reversals of the disinflationary forces that held yields low for four decades, a backdrop that makes a swift return to the rate environment that powered the post-2010 tech bull run historically unlikely across the 5-10 year horizon that matters most for current portfolio positioning.
The question is not whether Thursday’s selloff was too severe. The question is whether the conditions that caused it have changed. As of August 21, 2026, they have not. Until long-term rates convincingly move lower for one of those fundamental reasons, valuation risk in long-duration assets remains elevated, and Friday’s partial recovery does not alter that reality.
This article is for informational purposes only and should not be considered financial advice. Investors should conduct their own research and consult with financial professionals before making investment decisions. Past performance does not guarantee future results. Financial projections are subject to market conditions and various risk factors.