
On the morning of 19 August 2026, Moderna stock was trading at roughly $63. By mid-session, it had posted intraday gains of more than 120%, reaching as high as approximately 160% at the peak. That kind of move does not happen because a drug works. It happens because the market was already built in a way that made an extreme reaction structurally inevitable once the drug worked.
The confluence was almost engineered for dislocation: nearly 50 million shares sold short, a wall of bearish analyst ratings, and an outcome that virtually no institutional model had priced in. When a positive Phase 3 result landed, the forced-buying cascade that followed was layered on top of a genuine scientific breakthrough, and the two forces fed each other in real time.
This piece unpacks the mechanics behind one of the most extreme single-stock repricing events in recent biotech history. Here is a clear framework for recognising how short interest, analyst consensus, and binary catalysts interact to produce dislocations far larger than the underlying news alone could explain, and what the options market activity that followed reveals about how different participants think about these events.
What Moderna’s Phase 3 result actually announced
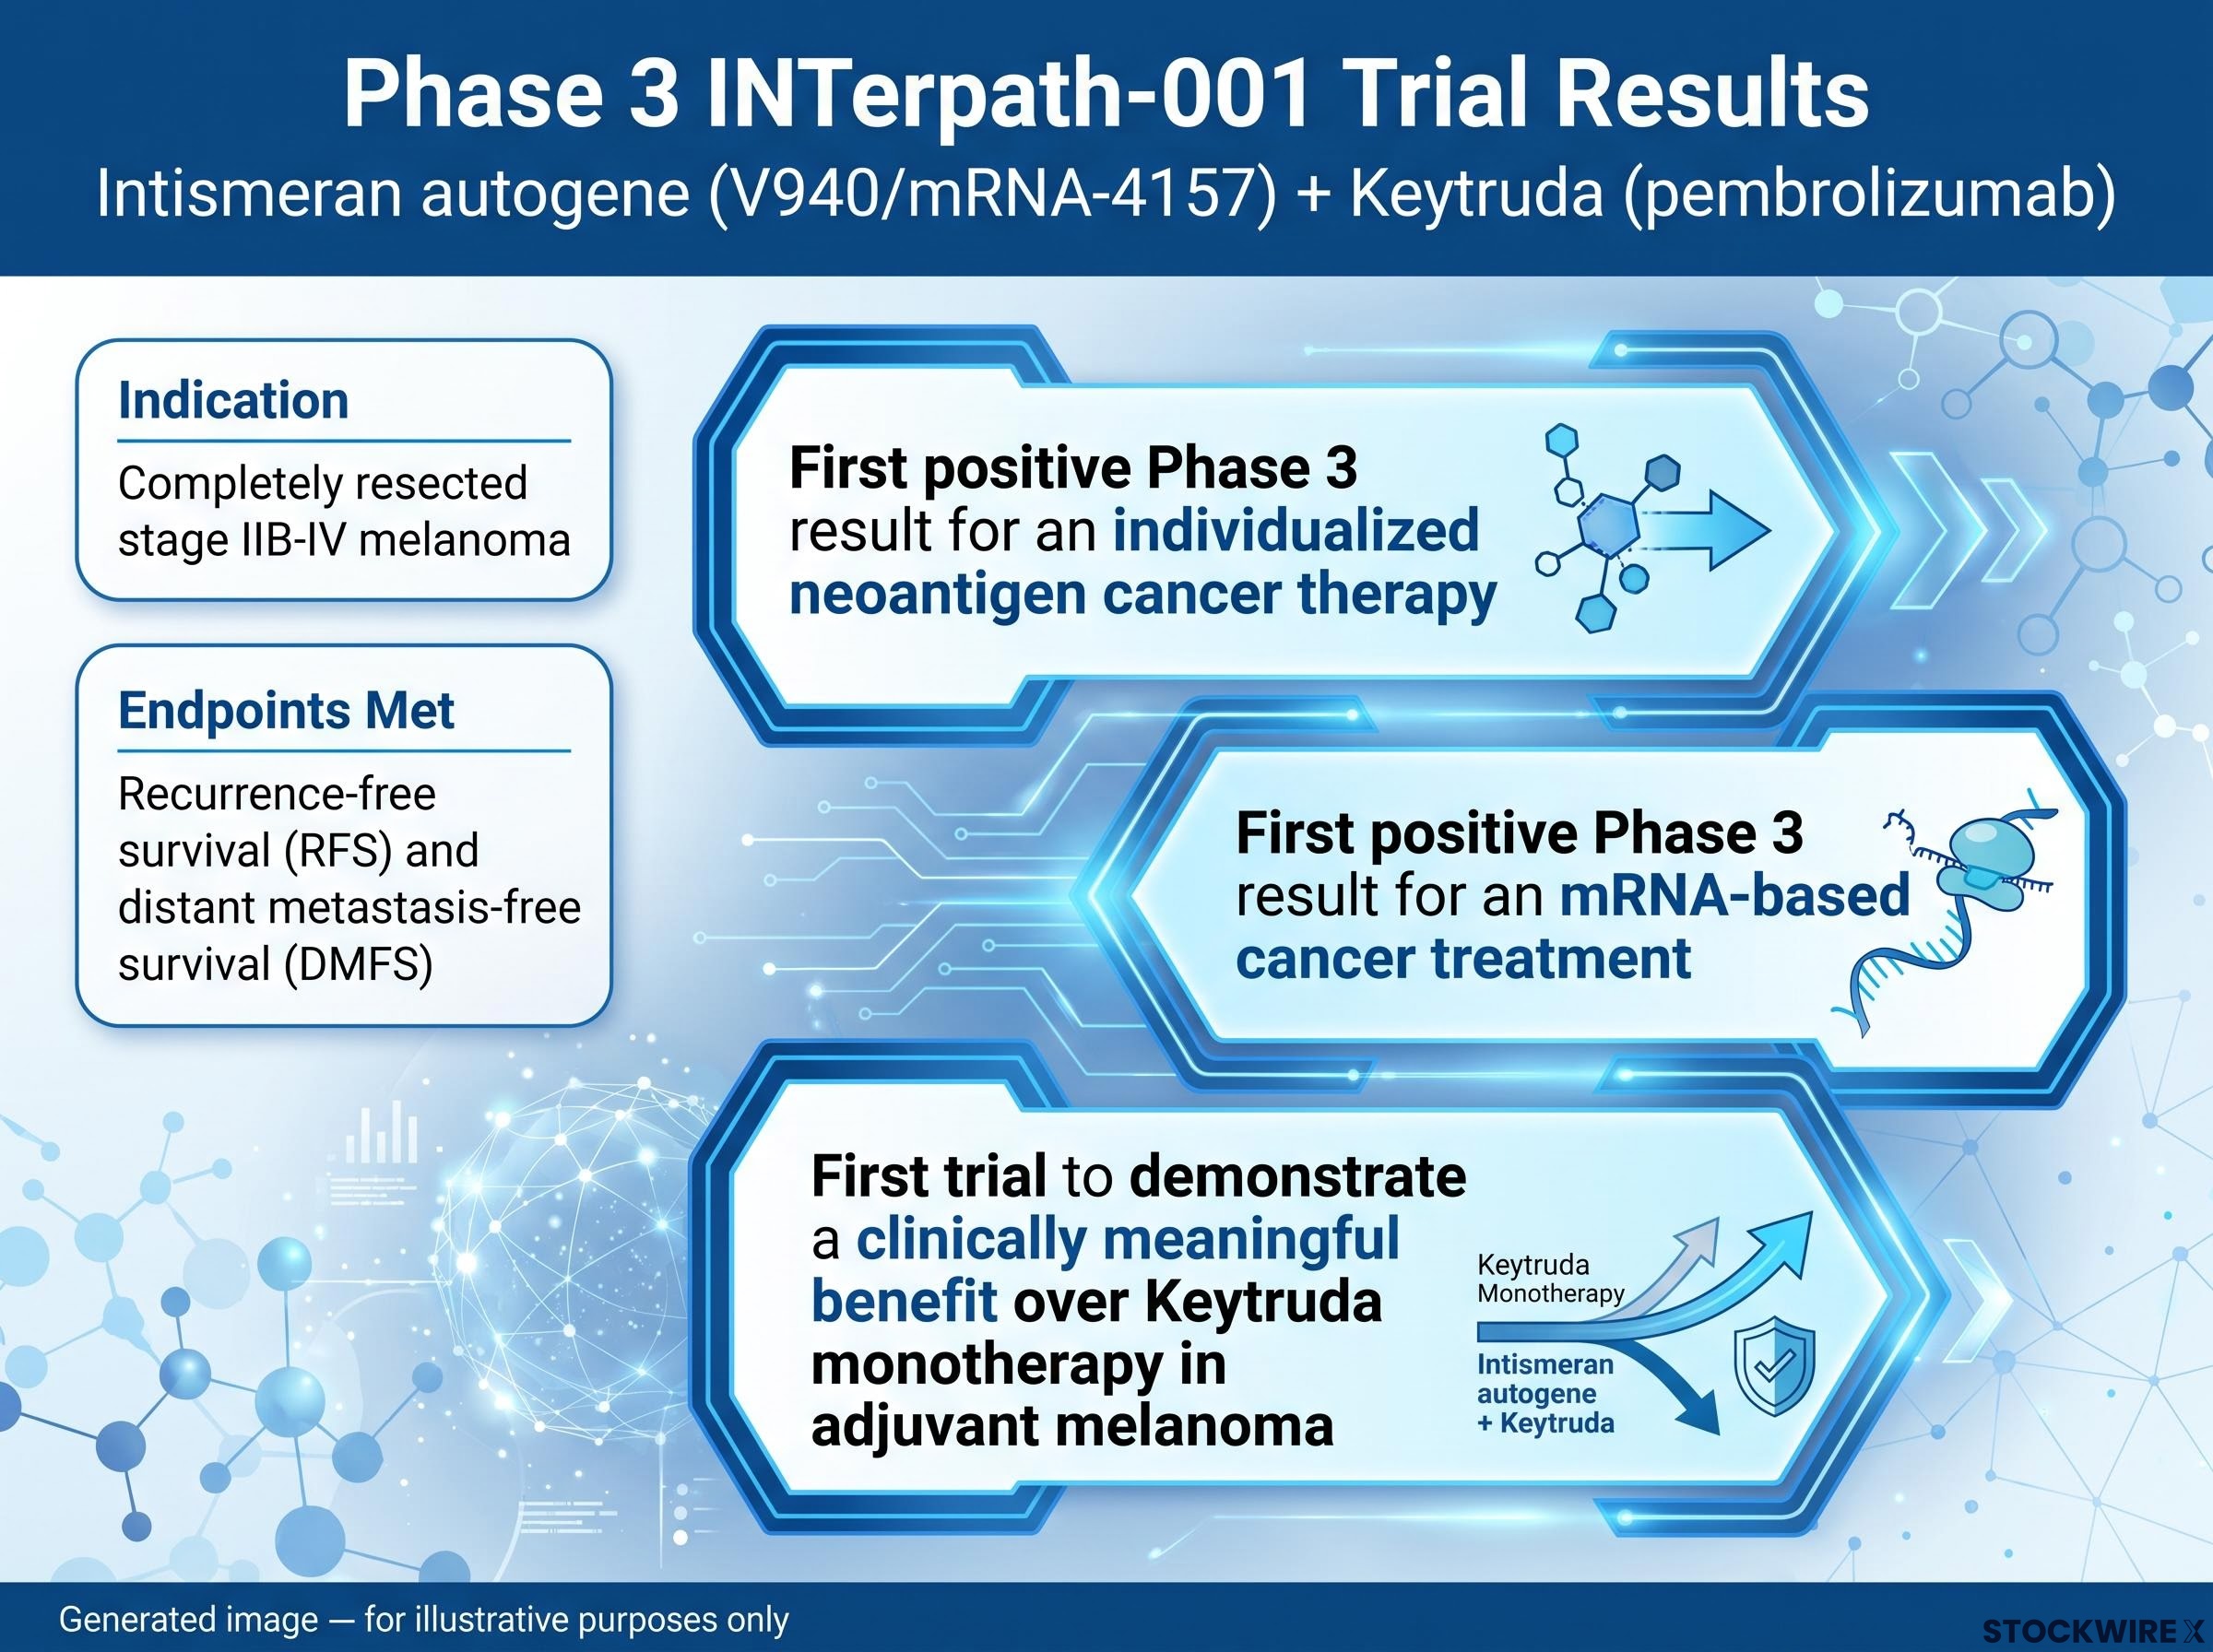
The data behind the move were real and historically significant. Moderna and Merck released positive topline results from the Phase 3 INTerpath-001 trial (NCT05933577) of intismeran autogene (V940/mRNA-4157), an individualised neoantigen mRNA therapy. The treatment was tested in combination with Keytruda (pembrolizumab), an established immunotherapy, in patients with completely resected stage IIB-IV melanoma.
The trial met its primary endpoint of recurrence-free survival (RFS), the specific health outcome measured to determine whether the treatment is effective, and a key secondary endpoint of distant metastasis-free survival (DMFS). Both showed statistically significant and clinically meaningful improvement over Keytruda alone, which is already a standard-of-care treatment in this setting.
The result carries three distinct “first-ever” designations:
- First positive Phase 3 result for an individualised neoantigen cancer therapy
- First positive Phase 3 result for an mRNA-based cancer treatment
- First trial to demonstrate a clinically meaningful benefit over Keytruda monotherapy in adjuvant melanoma
Each of those milestones would be notable on its own. Together, they represent a proof-of-concept moment for personalised mRNA oncology as an entire therapeutic category.
What the topline data left unanswered
The topline release was a prespecified interim analysis. Detailed hazard ratios (the measure of how much the treatment reduced recurrence risk compared to the control) and overall survival data were not included. Those figures are expected at future medical conferences.
Beyond the clinical data, drug pricing for an individualised neoantigen therapy, the regulatory approval pathway, payer and reimbursement decisions, and competitive responses from other oncology developers all remain open questions. Sophisticated traders buying on 19 August were not purchasing a fully known asset. They were buying the right to participate in an ongoing price-discovery process, and the absence of detailed efficacy data is precisely why the valuation range widened so dramatically rather than settling to a clear level.
When big ASX news breaks, our subscribers know first
How short squeezes work, using Moderna as the case study
Short selling is a bet that a stock’s price will fall. You borrow shares, sell them at the current price, and plan to buy them back later at a lower price to return to the lender. The structural obligation that creates is straightforward but non-negotiable: those borrowed shares must be returned, which means buying is not optional once conditions change.
Short selling costs extend well beyond the mark-to-market loss visible on a brokerage screen: daily borrow fees on heavily shorted names can exceed 15% annualised, and the combination of fee drag and forced-covering timing creates a structural disadvantage that persists even when the directional thesis is eventually correct.
Short interest as of 31 July 2026: Approximately 49.88 million Moderna shares were sold short, representing approximately 13-14% of the public float.
At that scale, covering the entire short position would have required multiple trading days of normal volume. That meant the pool of forced future buyers was large relative to available supply, and every one of them was structurally obligated to buy if the thesis broke.
Here is the cascade sequence that unfolded:
| Stage | Trigger | Market action | Effect on remaining shorts |
|---|---|---|---|
| 1. Gap higher | Phase 3 data lands positive | Stock opens sharply above prior close | Immediate mark-to-market losses across all short positions |
| 2. Initial short covering | Fastest-acting shorts buy to close | Non-discretionary buying pushes price higher | Losses deepen for every short still open |
| 3. Price acceleration | Momentum traders follow the tape | Additional buying pressure compounds | Risk management systems flag widening exposures |
| 4. Forced buying by risk limits | Margin calls and internal risk controls trigger | Involuntary purchases at any available price | Remaining shorts face the worst prices |
| 5. Liquidity vacuum | Natural sellers exhausted | Each transaction requires larger price moves to clear | Final shorts cover at or near the peak |
The key distinction for you as a reader watching a move like this: the buyers driving the early vertical move were not making a confident fundamental bet on Moderna’s oncology pipeline. They were buying because they had no choice. Recognising that distinction changes how you interpret price action in heavily-shorted names. The initial move is price-insensitive, driven by structural obligation rather than analytical conviction.
Why analyst consensus failure made the dislocation worse
A short squeeze requires forced buying on one side. It becomes extreme when there are almost no natural sellers on the other.
When nearly every analyst covering a stock is bearish, it thins the entire ownership structure. Funds with benchmark or mandate constraints often avoid the name entirely. Long-only investors who follow consensus trim their positions or exit. What remains is a concentrated set of contrarian holders and a large short base, with very little passive, relaxed ownership in between.
According to the original market segment covering this event, approximately 22 of 24 analysts were bearish on Moderna prior to 19 August, with a consensus price target of roughly $55. While that specific analyst count is not independently verifiable, the qualitative dynamic is directionally consistent across all available data: a strongly bearish consensus with targets dramatically below post-announcement trading levels.
Here is what the pre-announcement setup looked like versus the mid-session reality:
- Before the announcement: Stock trading at approximately $63, consensus target approximately $55, roughly 13-14% of float sold short, near-uniform bearish analyst coverage
- During mid-session: Stock trading above $139, tens of billions in market value added, the average short seller deeply underwater, and no analytical infrastructure ready to absorb what had happened
Consensus price target: approximately $55. Mid-session trading: above $139. The stock was trading at more than double the highest consensus target.
The analyst consensus failure here is not simply a story about analysts being wrong. It tells you that monocultures of opinion in professional markets create structural fragility. When everyone agrees on a direction and a binary catalyst breaks the other way, there is no analytical infrastructure ready to absorb the shock. Models need to be rebuilt from scratch, and that process takes weeks, not hours.
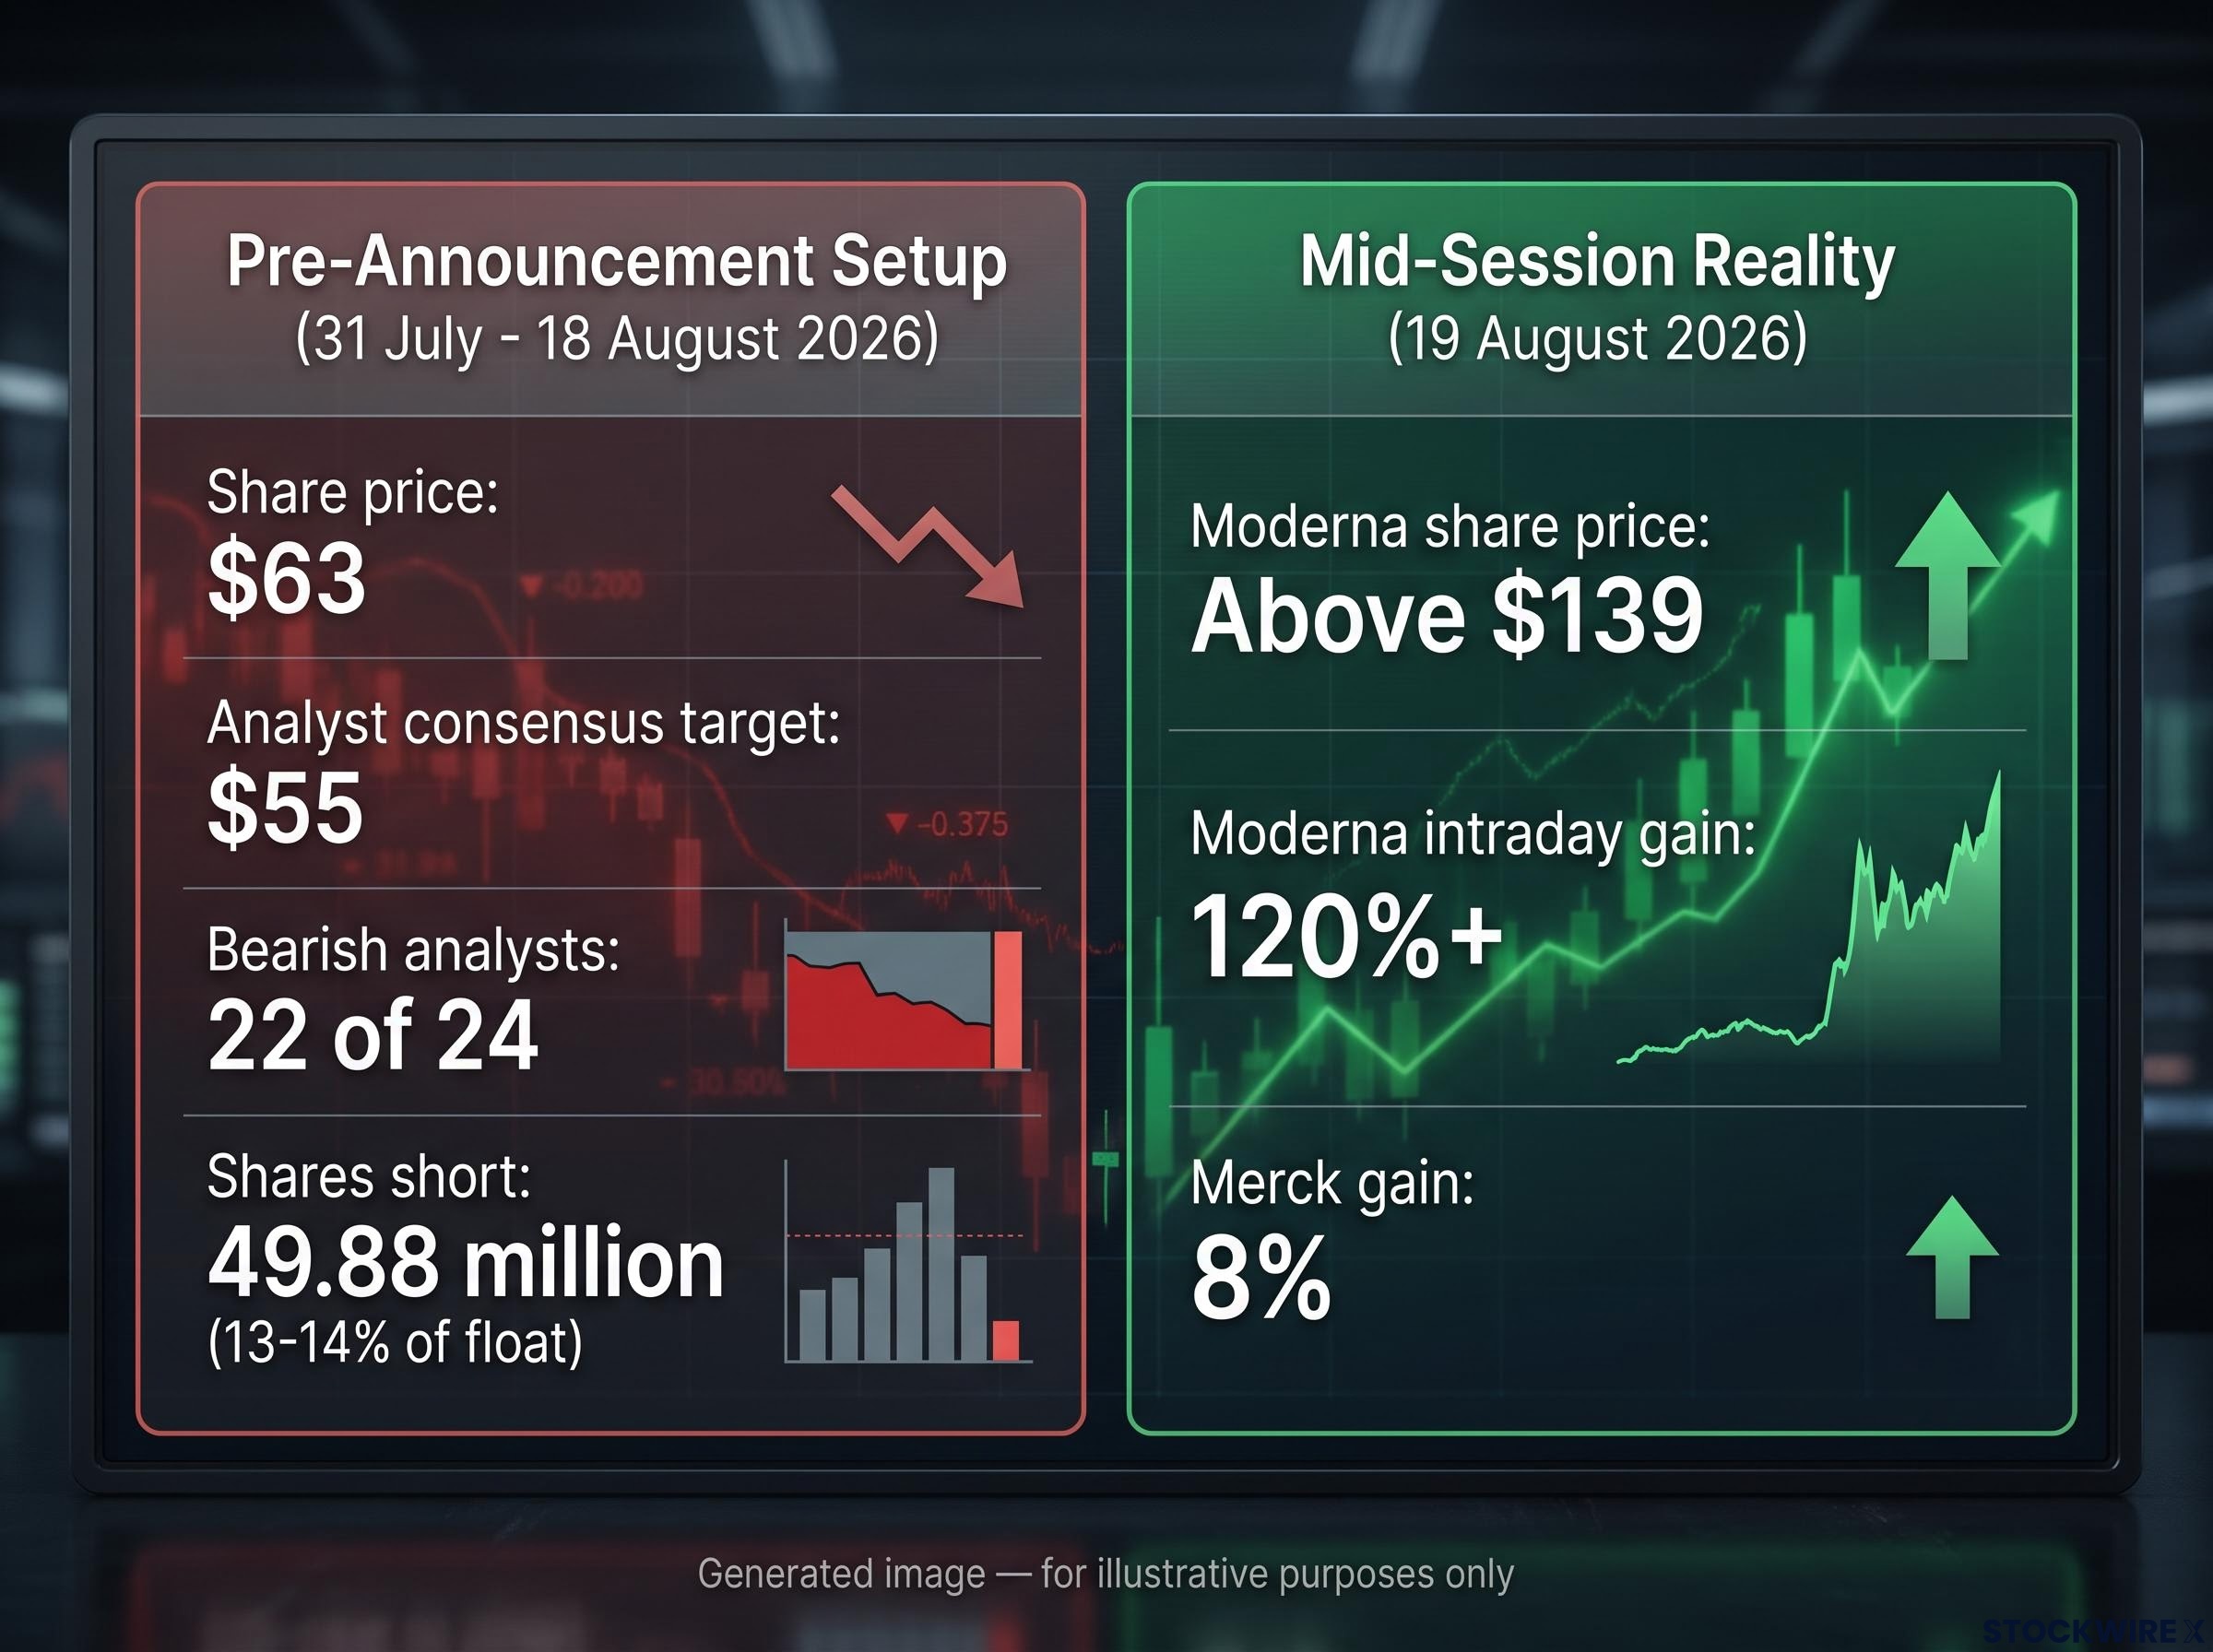
Merck’s 8% gain on the same day illustrates the contrast directly. The same fundamental news, the same trial result, produced a measured re-rating in a stock where positioning was normal. The difference between 8% and 120%+ was entirely structural.
Momentum factor reversals illustrate the same structural dynamic from the opposite direction: when positioning becomes concentrated enough that a single session’s forced selling triggers cascading exits, the resulting price move reflects structural obligation rather than any reassessment of underlying business value.
What the options trades reveal about how sophisticated traders think about binary events
Two call option trades executed on 19 August demonstrate how the same underlying event can be played at radically different time horizons and risk profiles. Both contracts had zero open interest prior to execution. Neither was even listed on the trading platform before the move, because the price levels involved were so far outside anticipated ranges that no market maker had bothered to create them.
According to options data reported via the Tasty Trade platform, the two trades were:
| Contract | Premium | Implied volatility | Moneyness | Trade thesis |
|---|---|---|---|---|
| September 18th $165 call (approx. 30 days to expiry) | $1.52 million | 125% | Approx. 8% out of the money | Thesis trade: buying time for analyst upgrades, model revisions, and institutional reassessment |
| August 21st $155 call (2 days to expiry) | $378,000 | 240% | Approx. 1% out of the money | Momentum trade: needs squeeze dynamics to sustain for a few more sessions |
The September buyer was not wagering on the squeeze persisting. The contract provided runway for the slower process of fundamental revaluation: time for analyst price targets to be revised upward, for institutional models to be rebuilt, and for the broader market to reconsider whether Moderna warrants re-rating as a credible oncology platform rather than a declining COVID-era business. At 125% implied volatility, the market was pricing extreme uncertainty, but within a structured probability range.
The August buyer needed a very different outcome. With only two days to expiry and 240% implied volatility baked in, even a brief pause in buying across a single session could leave the contract worthless. The trade required the short-covering pressure to continue pushing prices higher without interruption, a pure momentum wager against a rapidly ticking clock.
125% implied volatility (September) versus 240% implied volatility (August). The gap between those two numbers is the market’s honest pricing of two different uncertainty windows: chaotic near-term versus extreme-but-structured 30-day outlook.
The lesson for you: most retail investors treat all call options as equivalent directional bets. These two trades show that options strategy in a binary-event dislocation is really about choosing which phase of the repricing process you believe in. That choice carries very different risk profiles even when both trades are nominally bullish. The September trade, according to the same platform data, gained approximately 156% on the day. The August trade gained approximately 246%. But the risk embedded in each was fundamentally different.
For investors wanting to participate in binary-event volatility without the unlimited loss exposure that naked short positions carry, our dedicated guide to defined-risk options structures explains how credit spreads and put spreads create bounded risk profiles with three separate paths to profitability across directional and neutral market outcomes.
The two-phase repricing model every investor should understand
Every extreme move in a heavily-shorted stock facing a binary catalyst follows the same two-phase structure. Recognising where a stock sits in that sequence changes whether you are making a momentum trade or a fundamental bet.
| Phase | Primary driver | Buyer type | What determines continuation | Moderna status (19 August) |
|---|---|---|---|---|
| Phase 1: Squeeze | Price-insensitive forced buying | Short sellers covering, momentum traders | Remaining short interest and available liquidity | Largely unfolded during the session |
| Phase 2: Fundamental repricing | Analyst model revisions, institutional reassessment | Long-only funds, value investors, sector specialists | Detailed data, regulatory outcomes, competitive positioning | Just beginning; most inputs still unresolved |
Phase 1 is fast and violent. Nobody buying during this phase is doing fundamental work. The price moves vertically because the buying is involuntary and the seller base is thin. No analytical assessment is possible at the speed the tape moves.
Phase 2 is slower and driven by genuinely different questions. For Moderna specifically, those questions are substantial:
- Detailed efficacy data including hazard ratios and overall survival, expected at future medical conferences
- Regulatory approval timeline, with no application yet filed based on the topline results
- Drug pricing and reimbursement for an individualised neoantigen therapy, a category with no established pricing precedent
- Competitive pipeline responses from other oncology developers pursuing similar approaches
The September call buyer from the options section was positioning for Phase 2. They were not buying the squeeze; they were buying time for the fundamental repricing process to develop. That is a fundamentally different bet.
For you, the framework clarifies what you are actually taking on if you buy a heavily-shorted stock at elevated prices following a binary catalyst. Phase 1 is already largely priced in. Any further gains depend entirely on Phase 2 questions that may take months or years to resolve. Understanding which phase you are buying into, and whether your time horizon matches, is the most important decision.
What this event changes, and what it does not
The INTerpath-001 result is a genuine scientific milestone. The first positive Phase 3 for individualised neoantigen therapy and mRNA-based cancer treatment is not a market-structure artefact. That is real.
The short-squeeze mechanics that amplified the result into a 120%+ intraday move are equally real, and they are a repeatable market-structure phenomenon. You can now identify the preconditions:
- Short interest as a percentage of float: At 13-14%, Moderna’s short interest was large enough that covering would take multiple days of normal volume, creating a pool of structurally obligated buyers
- Analyst consensus concentration: With nearly all professional analysts bearish, the natural seller base was thin and institutional ownership was concentrated in few hands
- Binary catalyst identification: A Phase 3 trial readout is one of the clearest binary events in markets, a single data release that either confirms or breaks the prevailing thesis
- Phase distinction: Recognise whether the current price action reflects squeeze-phase buying (involuntary, price-insensitive) or fundamental-repricing-phase buying (analytical, model-driven)
What the event does not resolve is Moderna’s fair valuation. Detailed efficacy data remain unreleased. No regulatory approval has been granted. Drug pricing for personalised neoantigen therapy has no established precedent. The competitive positioning of mRNA oncology as a platform is genuinely open.
Identical underlying news. One session. Moderna advanced more than 120%. Merck moved 8%. That disparity was a product of structure, not science.
That comparison is the clearest single illustration of what market structure adds to a genuine fundamental catalyst. The science was identical for both companies. The positioning was not. Carry that distinction into every future binary event you encounter in a heavily-shorted name. The magnitude of the move tells you as much about what was in place before the catalyst as it does about the catalyst itself.
This article is for informational purposes only and should not be considered financial advice. Investors should conduct their own research and consult with financial professionals before making investment decisions. Past performance does not guarantee future results. Forward-looking statements regarding clinical outcomes, regulatory decisions, and competitive dynamics are speculative and subject to change based on developments that have not yet occurred.
—