Across three consecutive trading sessions before Nvidia’s August 26th earnings report, options traders poured roughly $11.6 million into call positions structured to profit from a sharp upside move. Throughout that buying window, the underlying shares were heading lower.
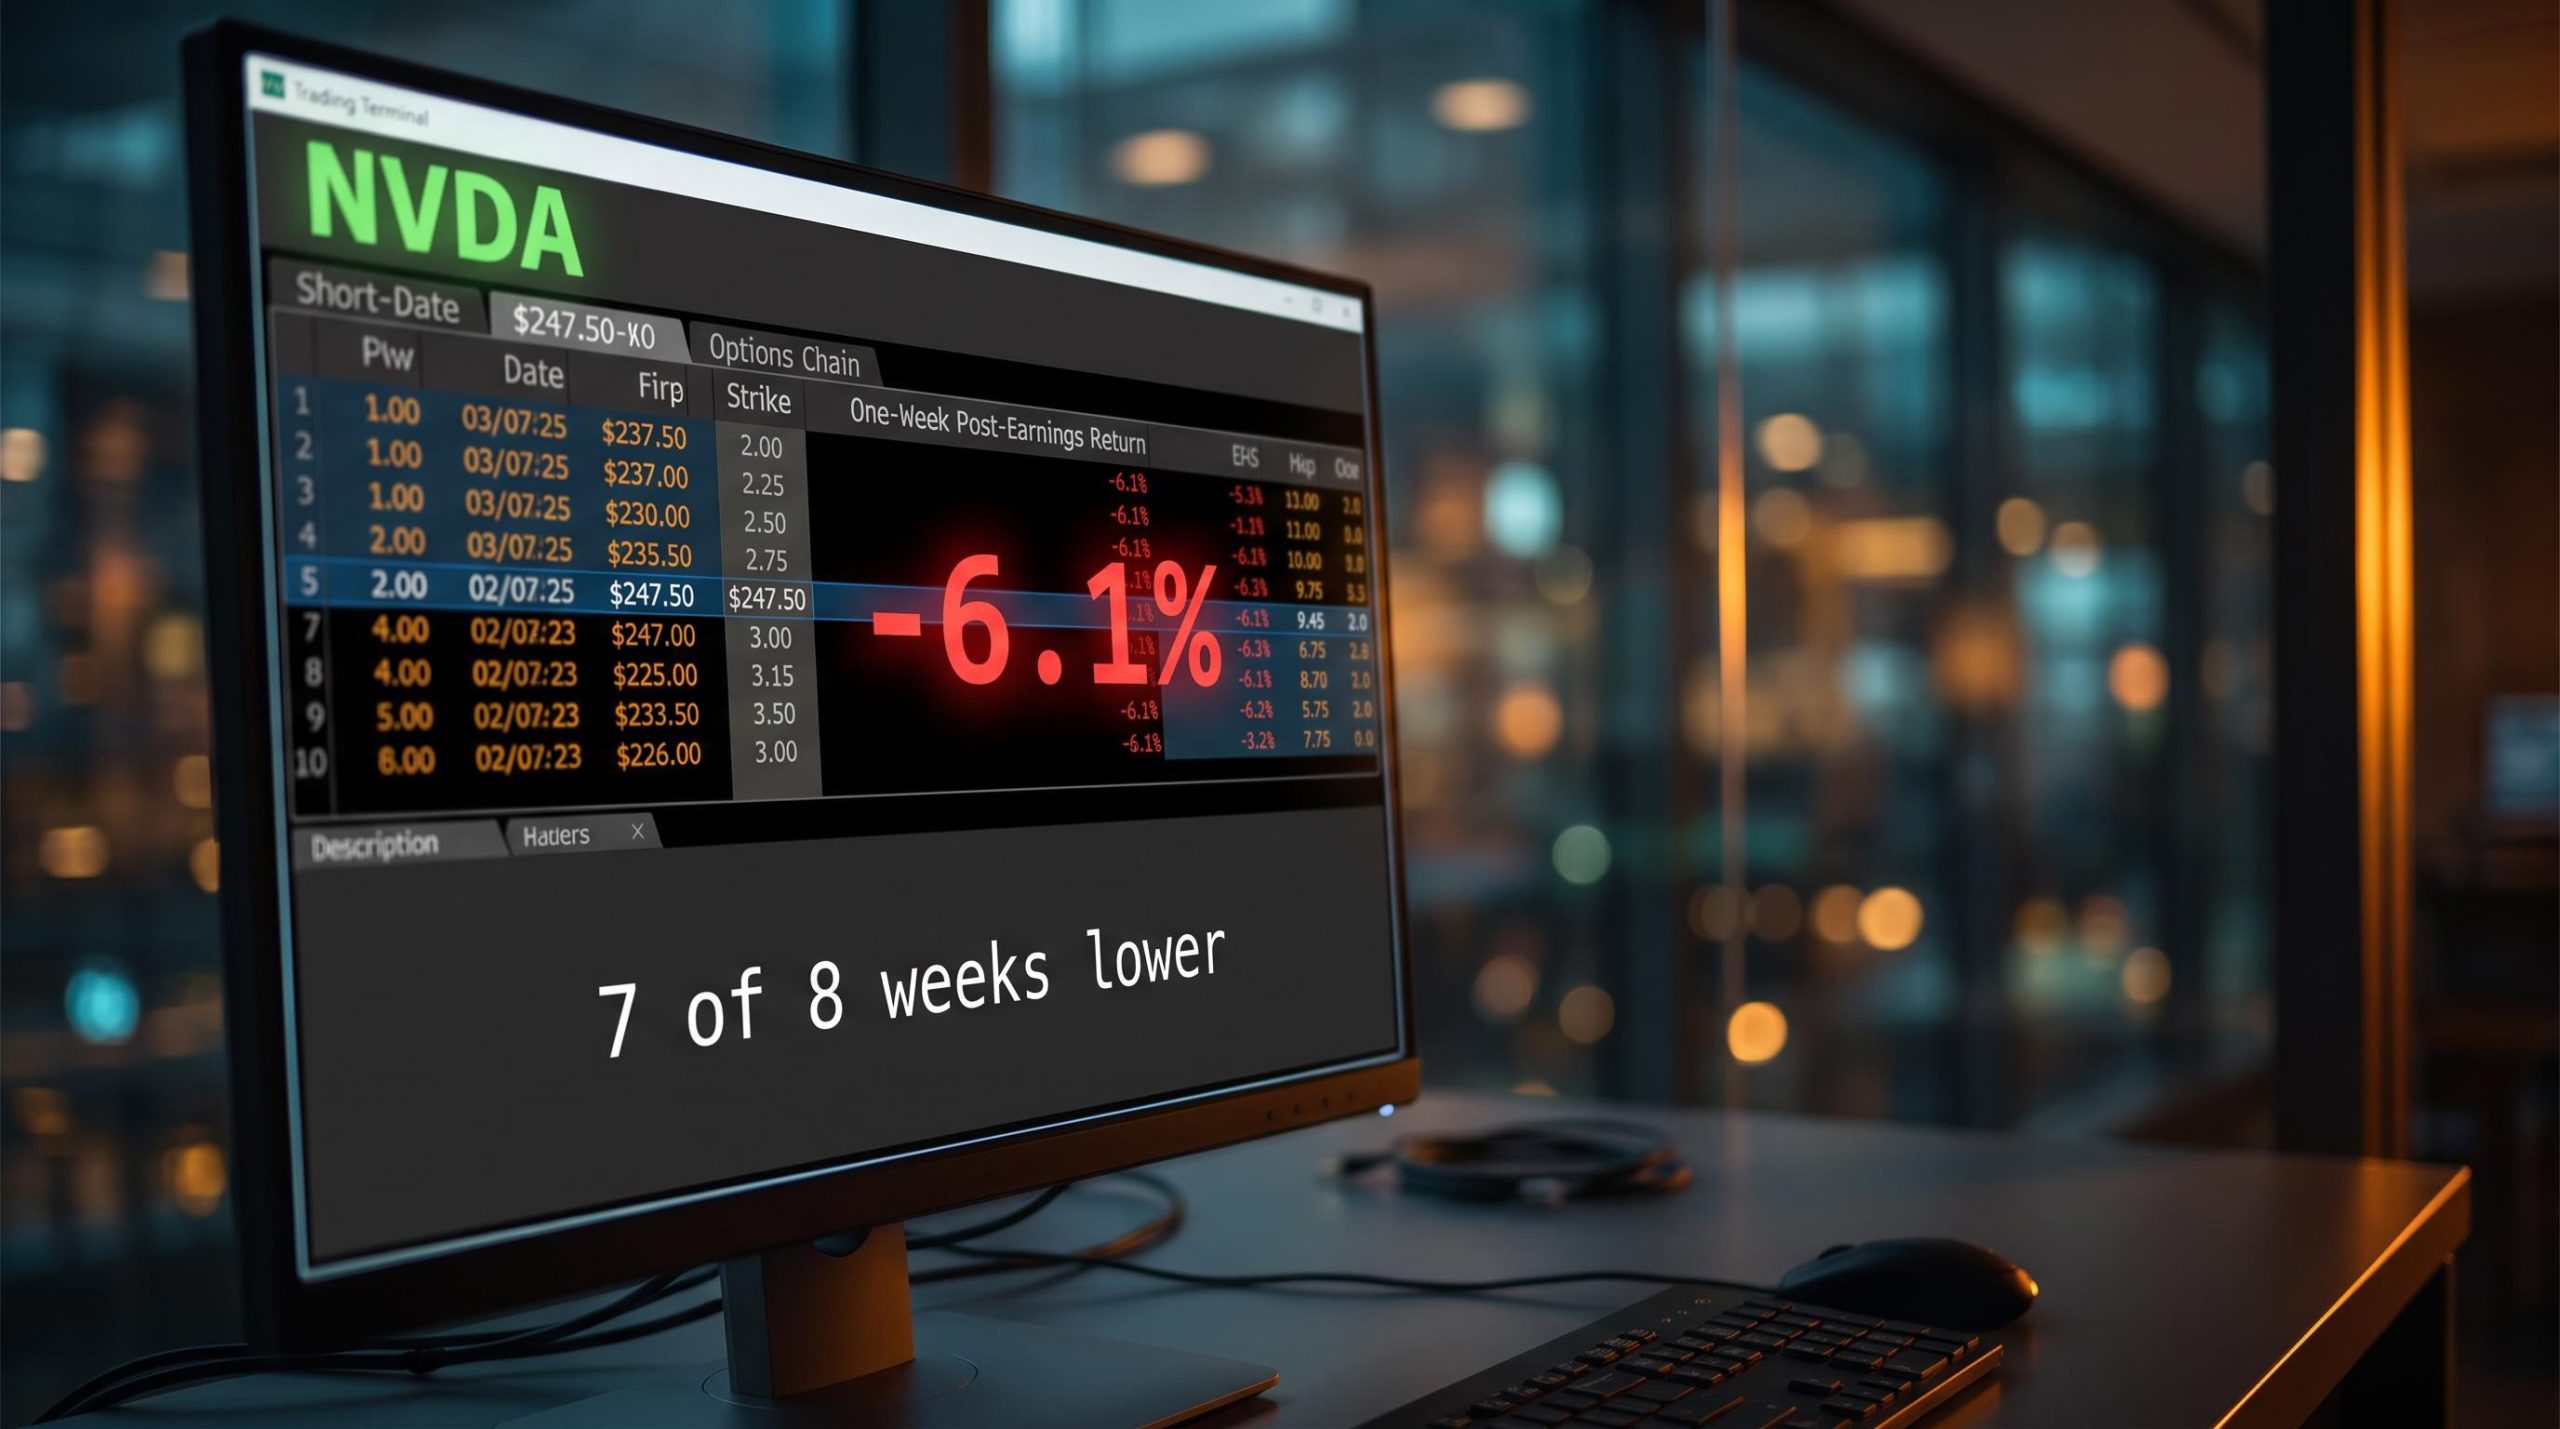
The move is bold, visible, and intuitively compelling. But the same earnings history that makes Nvidia one of the most watched catalyst events in markets contains a pattern that cuts directly against short-dated call positioning: the stock has ended the week following the report on a lower note in seven out of its last eight quarters, including periods when the company delivered a beat. That tension, between aggressive bullish positioning and an uncomfortable base rate, is what this analysis unpacks.
Here is a framework for understanding what these trades are actually betting on, how the options market prices that bet, and why the historical record around Nvidia earnings is more complicated than the headline beat-rate suggests. Whether you trade options or simply follow Nvidia closely, the mechanics here apply to every major catalyst event you encounter.
What $11.6 million in call buying actually looks like on the tape
With shares hovering near $225 on Friday, a trader entered the market and paid around $1.95 million for August 28th calls at the $247.50 strike. Reaching breakeven on that position demanded something close to a 10% rally from where the stock sat at the time of purchase.
Monday brought a larger entry: August 31st calls at the $220 strike changed hands for roughly $5.12 million, with implied volatility sitting near 45%. Of the three sessions, this contract was the nearest to at-the-money and represented the most straightforward structure in the set. Positions at August 28th strikes of $242.50 and $247.50 completed the picture.
| Session / Strike | Expiration | Premium Paid | Share Price | Required Move |
|---|---|---|---|---|
| Friday / $247.50 | 28 August | ~$1.95M | ~$225 | ~10% |
| Monday / $220 | 31 August | ~$5.12M | ~$225 | Near ATM |
| Additional / $242.50, $247.50 | 28 August | Part of $11.6M total | ~$225 | ~8-10% |
A few confirmatory observations sharpen the picture:
- All of these contracts settle after the August 26th earnings date, which identifies them as pure catalyst bets rather than plays on near-term price drift.
- Throughout the buying period, the share price was moving lower, not higher.
- Summing the three sessions together, the call premium committed came to roughly $11.6 million in total.
The fact that traders sized into calls while the stock declined tells you something specific about the conviction being expressed. These buyers treated the pullback as a discount on a catalyst bet, not as a reason to wait. That distinction matters. This is not a single monolithic position but a series of bets at different strikes and expirations, each carrying a different required move to generate a return.
When big ASX news breaks, our subscribers know first
How the options market prices an Nvidia earnings catalyst
Options on Nvidia heading into the August 26th report reflect a consensus implied move of roughly 6.5% in either direction. That figure represents the magnitude of swing, in either direction, that the options market expects around the event. It is derived from at-the-money straddle pricing (the combined cost of buying both a call and a put at the same strike and expiration), and it functions as the market’s best estimate of how much the stock will move.
The options market’s 6.5% consensus figure is derived from implied volatility mechanics that reverse-engineer collective market expectations directly from live option prices, meaning the number reflects what participants are collectively willing to pay for uncertainty rather than any historical average.
A 6.5% swing on Nvidia’s current market capitalisation translates to roughly $355 billion in value changing hands in a single session.
ORATS data covering the last 12 quarters shows an average implied move of 7.7% and an average actual move of 7.6%. The options market has been remarkably accurate at sizing Nvidia’s earnings reactions.
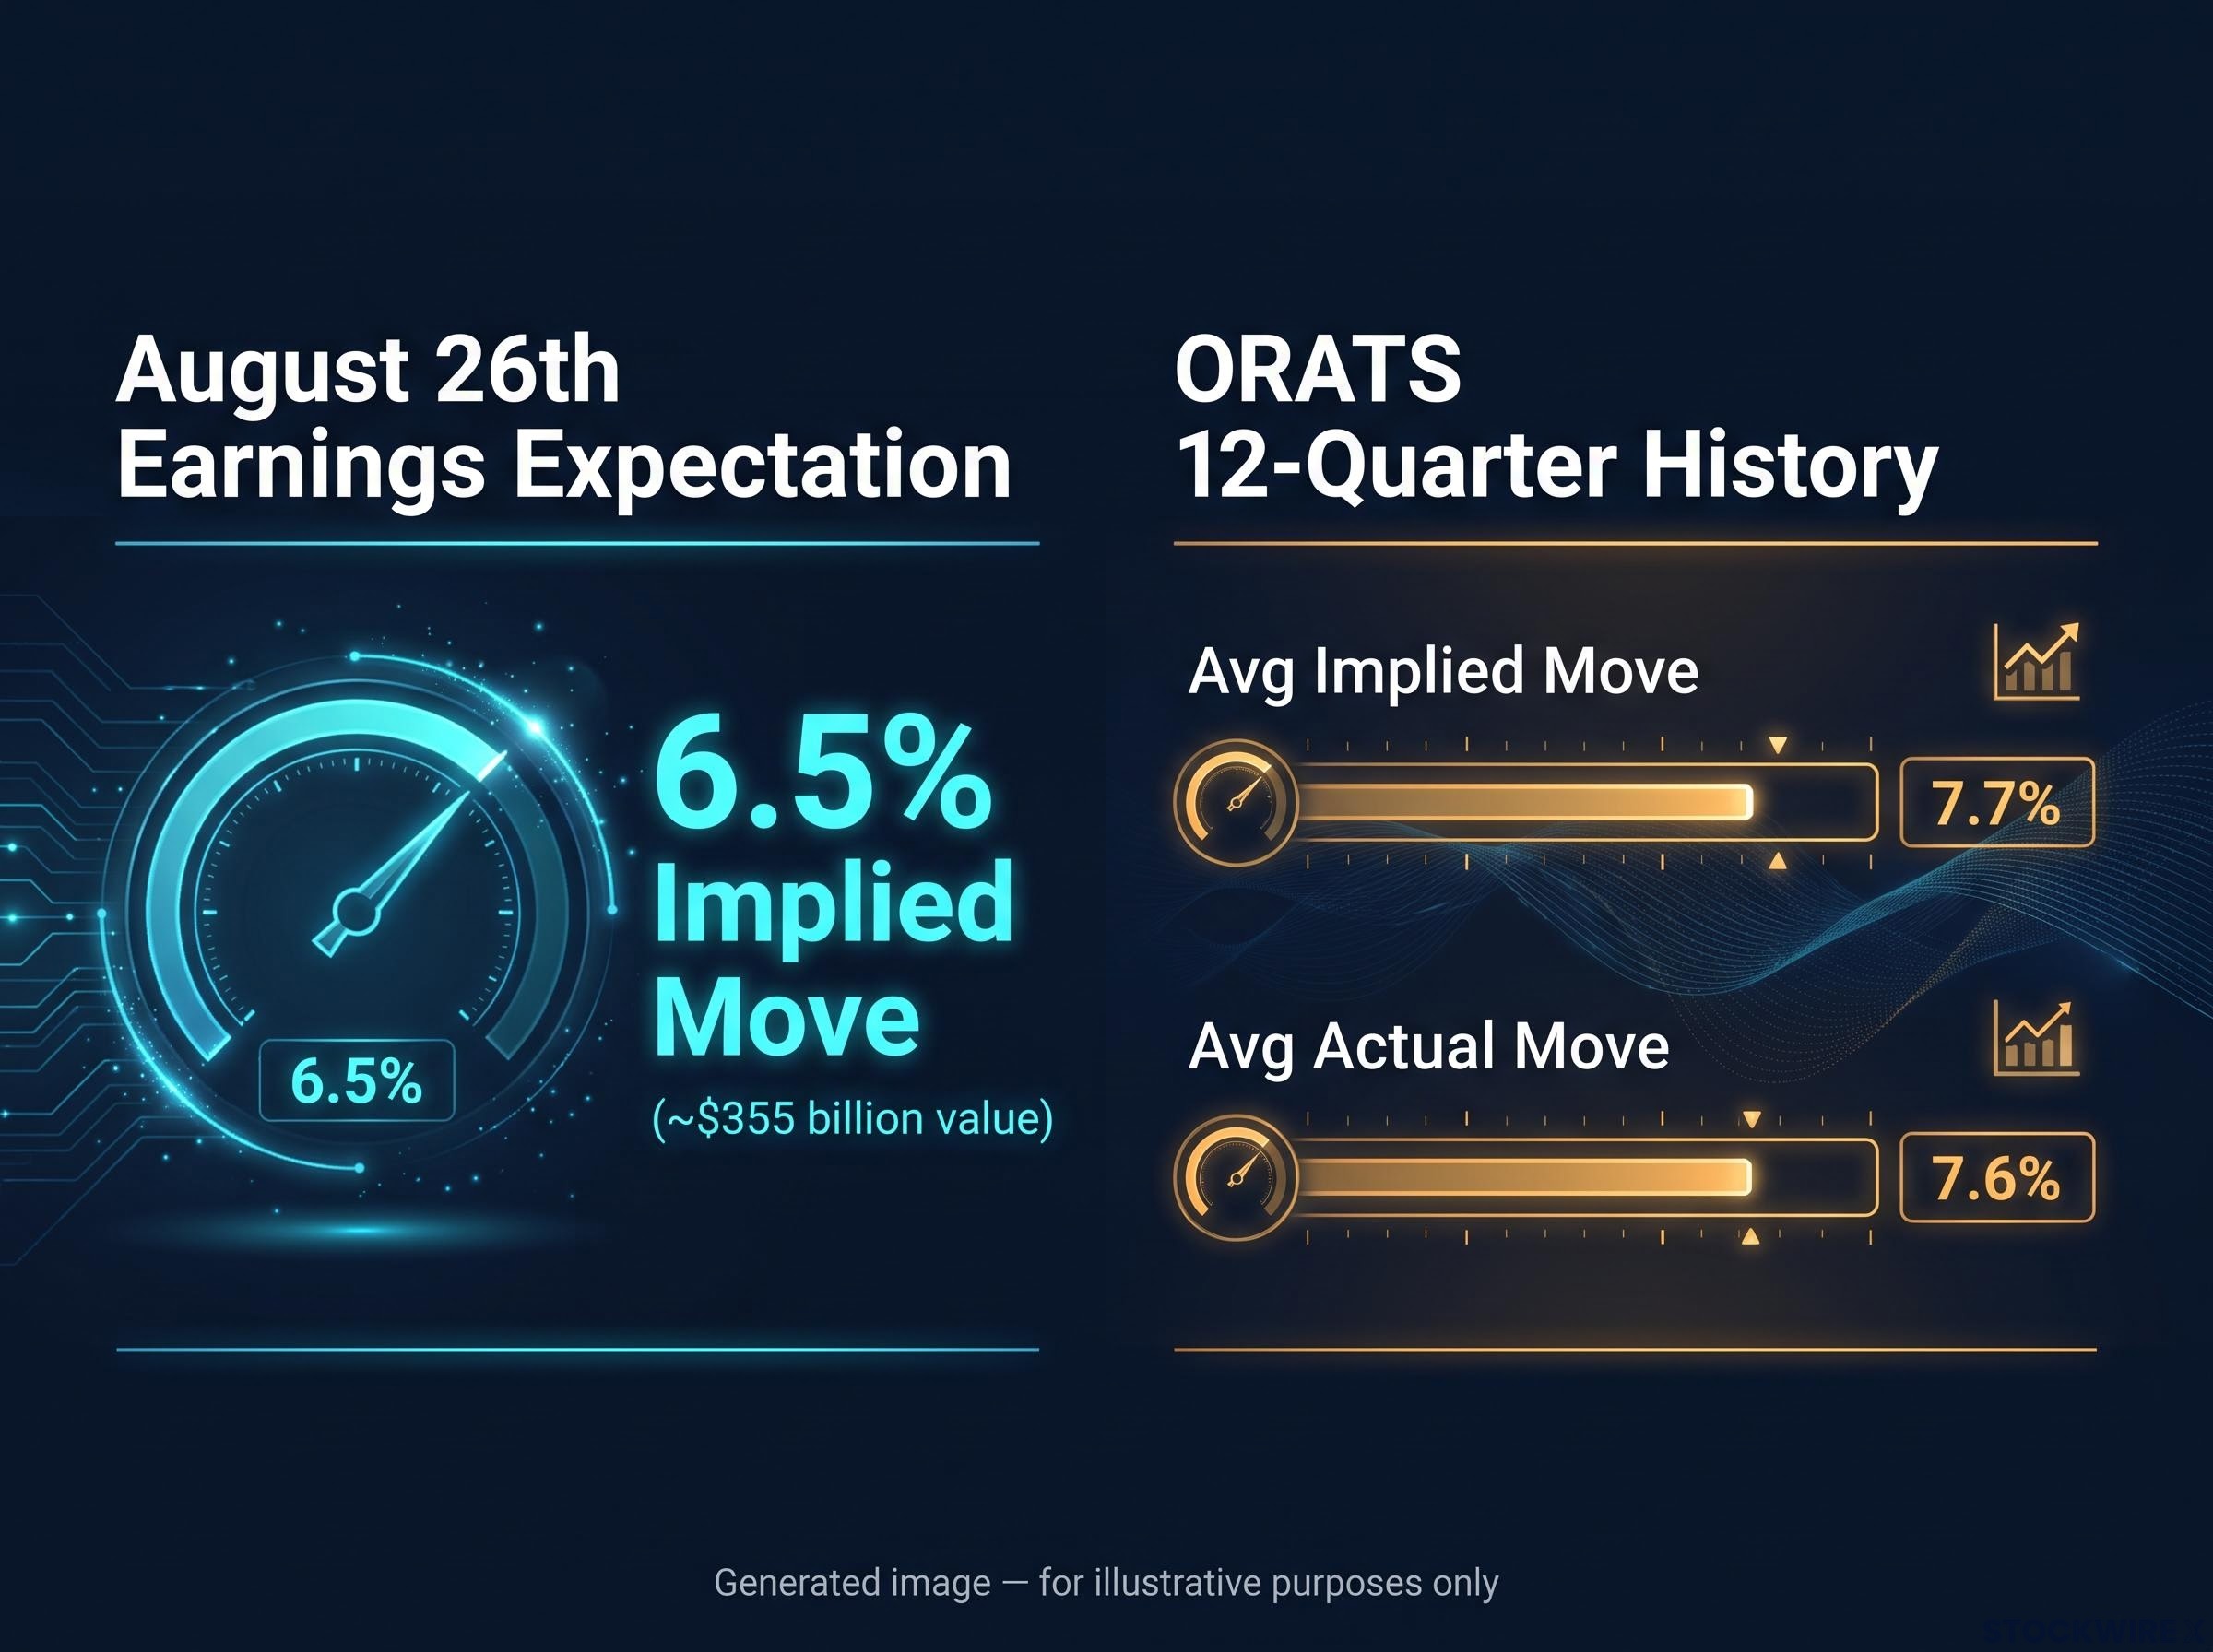
That accuracy benchmark is worth pausing on. The 6.5% implied move for this cycle sits slightly below Nvidia’s historical average actual swing of roughly 7.4%-7.6%, which means the call buyers in the case study are effectively betting that Nvidia outperforms an already well-calibrated market expectation. For the out-of-the-money $247.50 calls purchased with shares at $225, the 6.5% implied move establishes a baseline the trade must already beat, and volatility crush means even landing exactly at 6.5% upside would likely still produce a loss on that position.
Why volatility crush matters more than direction for short-dated calls
Volatility crush is the rapid collapse in implied volatility that occurs once an earnings result is released. Before the report, uncertainty inflates the price of options. After the report, that uncertainty disappears almost instantly, and the inflated premium drains from short-dated contracts regardless of whether the stock moved in the right direction.
ORATS earnings volatility research documents how the earnings premium embedded in options pricing accounts for the bulk of the implied volatility decline that follows an event, a mechanics-level explanation for why even correctly-directional short-dated call positions can lose value once results are released.
A recent cycle illustrates the mechanism concretely. Options priced in approximately a plus-or-minus 5.9% move ahead of the report. Nvidia delivered strong results, but the stock moved approximately -1.8%. Short-dated call buyers lost money despite a fundamentally solid quarter. The directional bet was not the problem. The premium paid for uncertainty that no longer existed was.
The historical record most Nvidia bulls are not reading closely enough
The tastytrade Signal vs. Noise analysis examined the eight most recent Nvidia earnings reports and found a pattern that sits uncomfortably alongside the bullish call positioning.
Across those eight reports, the stock ended the following week lower on seven separate occasions.
The numbers back that up. Looking at the same eight-quarter window, the stock averaged a next-day return of -2.8% and a one-week return of -6.1%. What makes this particularly striking is that Nvidia cleared or matched analyst estimates in six of those eight quarters. Solid fundamental execution did not translate into sustained price appreciation; the stock kept giving back ground in the days that followed.
The May 2026 quarter demonstrated the pattern concretely: Nvidia posted record revenue of $81.6 billion with $91 billion guidance, yet shares dipped immediately after the release as an options unwind after earnings drained the inflated premium that had accumulated in the pre-event period, confirming that strong fundamental execution and positive short-dated options outcomes are not the same thing.
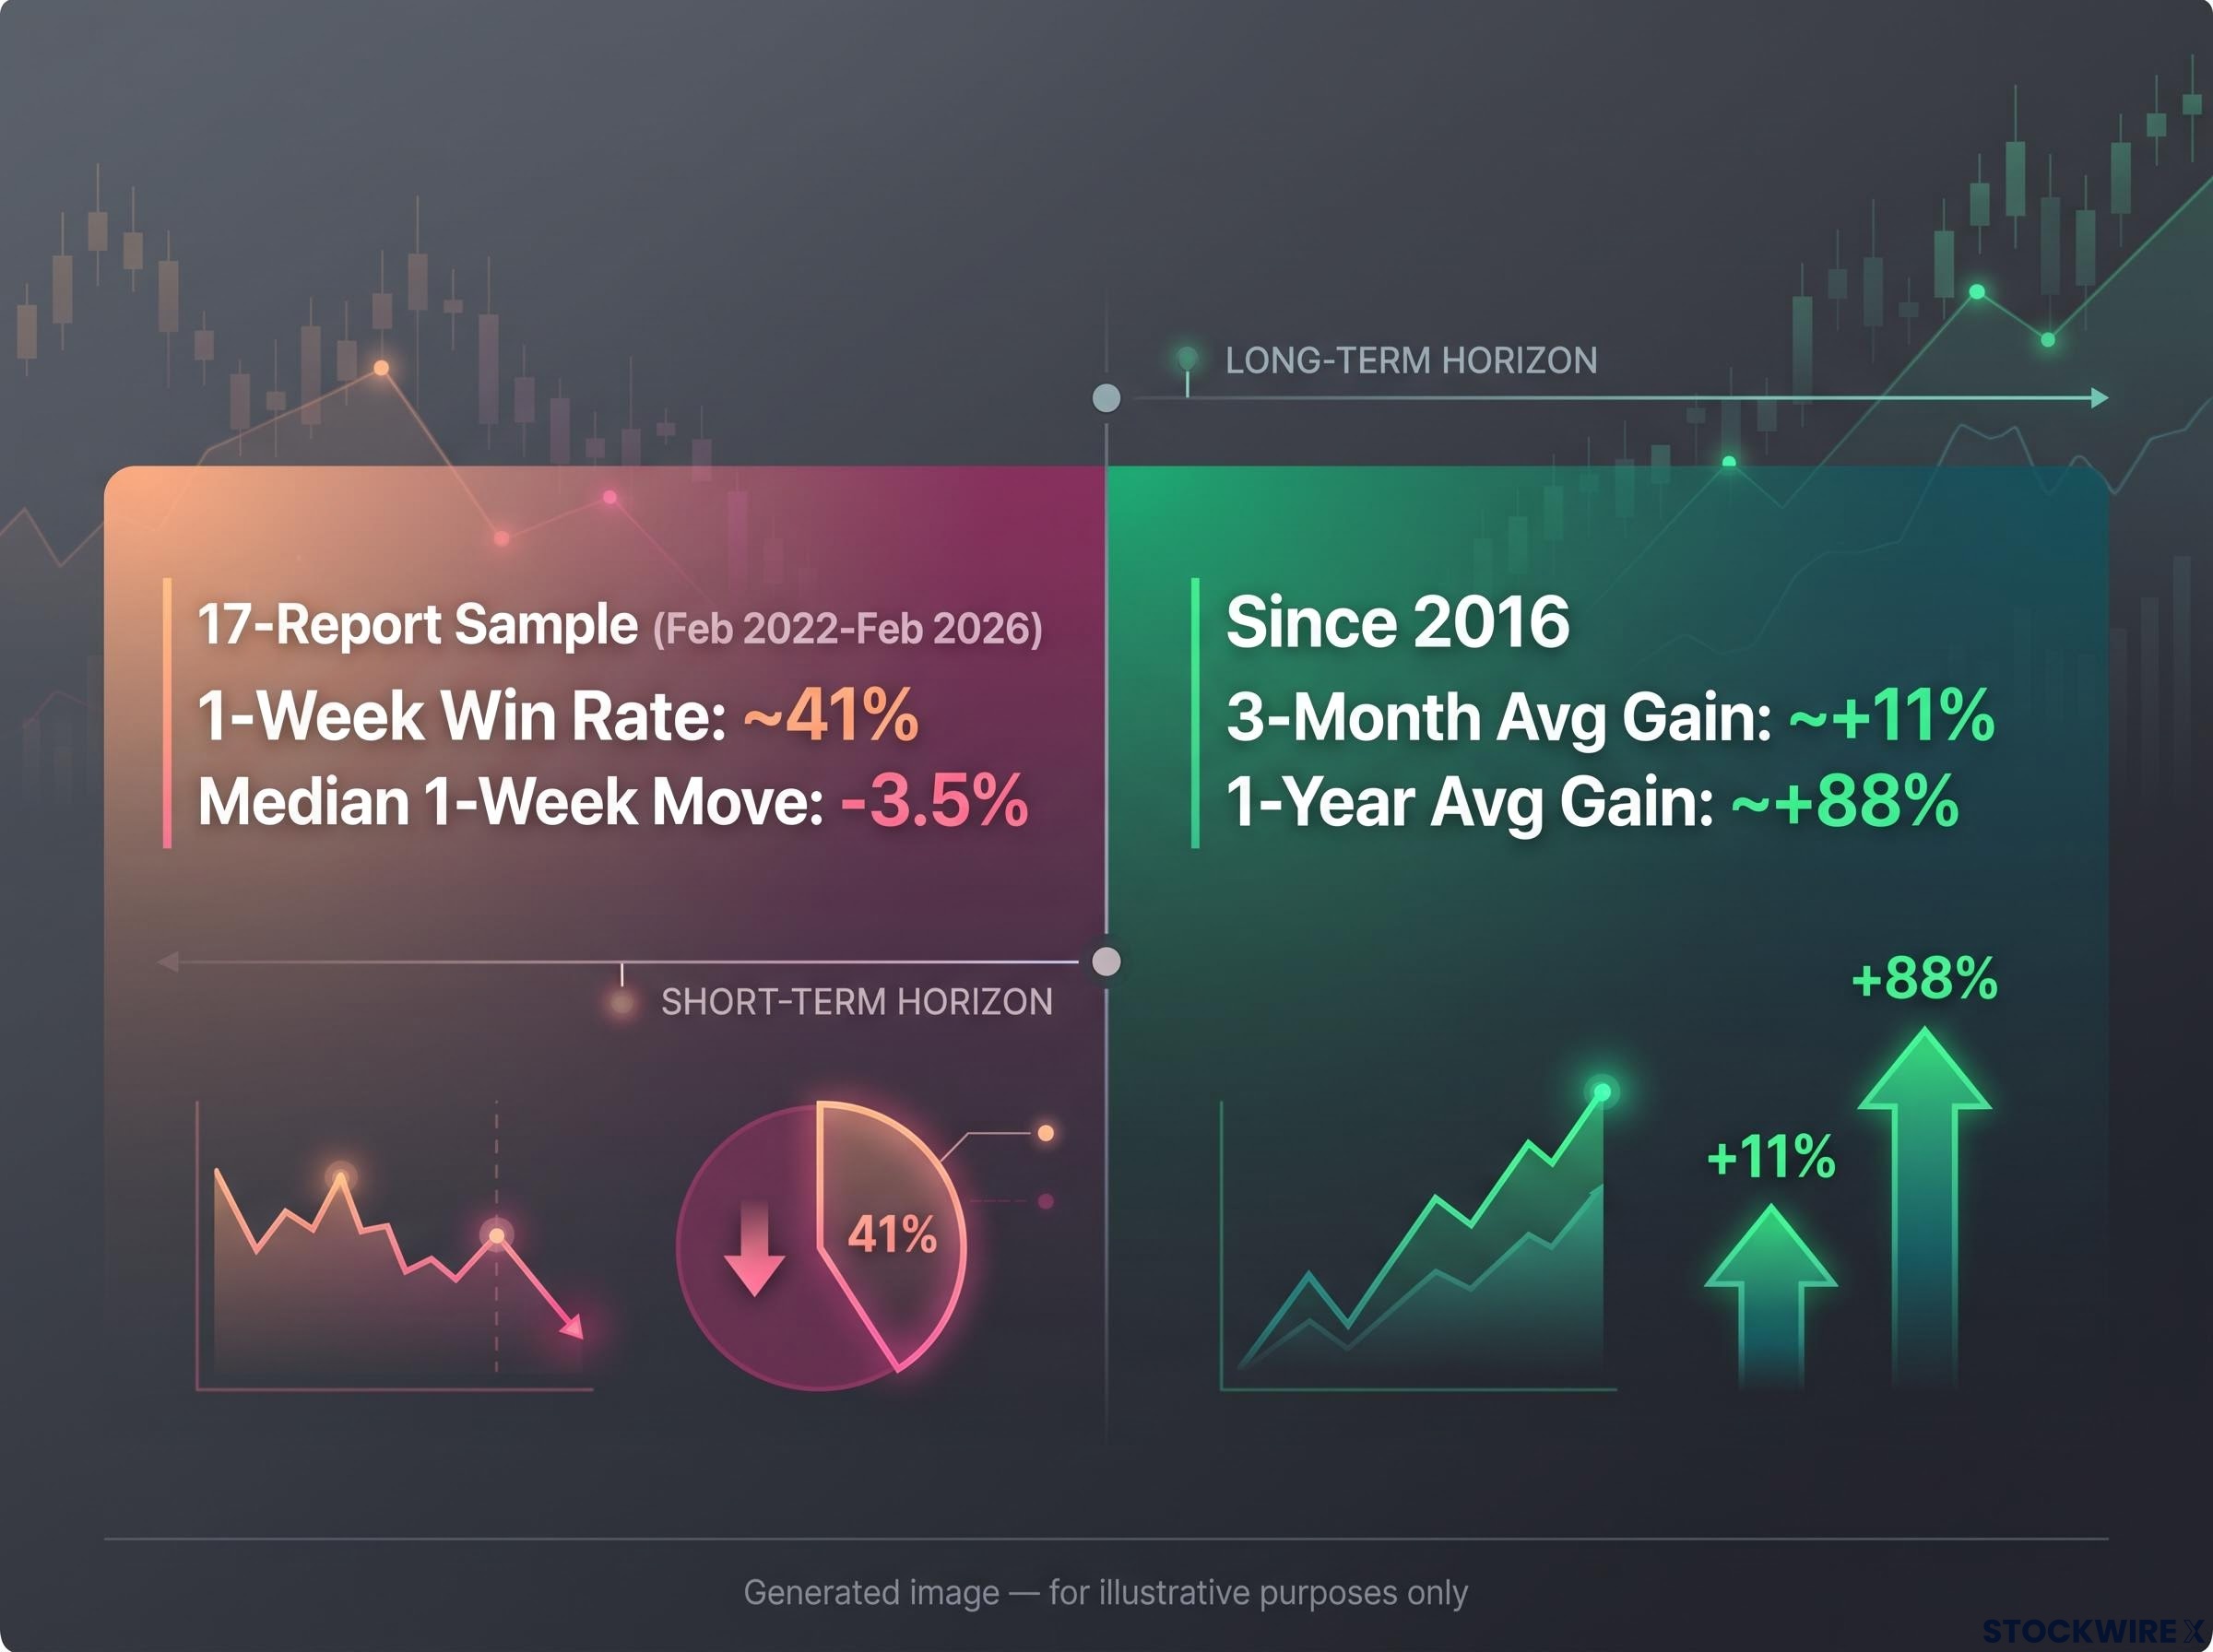
Broadening the lens to a 17-report dataset covering February 2022 to February 2026 shows a similar qualitative pattern. The average one-week move appears modestly positive at +0.9%, but that number is misleading. The median one-week move is -3.5%, and only approximately 41% of weeks finish higher, with ten of 17 weeks ending in negative territory. A small number of large post-earnings rallies pulled the average into positive territory, masking a base rate that is genuinely unfavourable.
| Sample | Avg 1-Day Move | Avg 1-Week Move | Median 1-Week Move | 1-Week Win Rate |
|---|---|---|---|---|
| Eight-report (recent) | -2.8% | -6.1% | N/A | 1 of 8 (~13%) |
| 17-report (Feb 2022-Feb 2026) | +2.4% | +0.9% | -3.5% | ~41% |
| Recent 3-quarter run (2025-2026) | Negative | -3% to -6% | Negative | 0 of 3 |
The most recent three consecutive quarters in 2025-2026 show the stock down roughly 3%-6% one week after earnings in each instance, even on strong results. The median one-week move of -3.5% and a 41% win rate mean that if you were making this same bet repeatedly over the past four years, you would have lost money on the one-week holding window far more often than you made it, regardless of whether Nvidia beat the quarter.
Why beating estimates does not reliably move Nvidia’s stock higher in the short run
The assumption is intuitive: if a company beats earnings, the stock goes up. For Nvidia, the data dismantle that assumption systematically.
The mechanism behind this pattern has three components:
- Already-priced-in beat. When a company is widely expected to exceed estimates, the published consensus number is not the real bar. The market has already moved the stock higher in anticipation of the beat, so even a genuine outperformance fails to surprise.
- The whisper number gap. Consensus EPS estimates are public and widely tracked, but the market also prices in an unofficial expectation that typically runs above the published consensus for high-growth names. For Nvidia, analyst enthusiasm routinely sets internal expectations above the published figure. A technical beat against the consensus number can still disappoint the market’s actual embedded expectation.
- Volatility premium collapse. Even when the stock moves in the right direction, the collapse in implied volatility after the event can erode the value of short-dated options faster than the directional move can compensate.
Nvidia’s valuation compression heading into this earnings cycle adds another layer to the base-rate puzzle: with the stock trading at roughly 16x projected 2027 earnings, the lowest forward multiple in a decade, the market’s embedded skepticism about sustained growth already informs how aggressively options buyers must bet to generate returns.
The whisper number problem and what it means for Nvidia specifically
Nvidia’s growth trajectory and forward visibility mean that by the time the report drops, the stock price already embeds an expectation that goes well beyond the published consensus. This is why, across the tight eight-quarter sample, the company cleared or matched consensus in six instances and yet the stock still ended the following week lower on seven of those occasions.
The 17-report data reinforce the point. At the one-day horizon, Nvidia’s win rate is approximately 53%, barely above a coin flip. At the one-week horizon, it drops to approximately 41%, below a coin flip. For a trader holding August 28th or August 31st calls, the historical base rate suggests the stock resolving higher in that exact window is the minority outcome, not the base case, even if Nvidia reports a strong quarter.
The long game: what the data says when you hold past the volatility window
The pattern of post-earnings weakness is specific to very short holding windows. At longer horizons, Nvidia’s earnings story looks materially different.
- One-week win rate (17 reports): approximately 41%
- Three-month post-earnings average gain (since 2016): approximately +11%
- One-year post-earnings average gain (since 2016): approximately +88%
Since 2016, Nvidia’s average one-year post-earnings gain is approximately +88%. The short-term weakness that punishes call buyers has historically been the entry point for the long-term move.
This is a horizon problem, not a company quality problem. The same earnings catalyst that has driven negative short-term drift has also historically been a launching pad for significant gains once the volatility crush and immediate sell-the-news dynamics resolve.
That context does not rehabilitate the short-dated call trades in the case study. Those positions expire in days, not months. The +88% average one-year post-earnings gain tells you something very different from what it tells a trader holding August 28th calls. The same underlying asset, the same earnings event, the same reported results produce categorically different outcomes depending on the instrument and the holding window.
What expiration choice tells you about risk in any catalyst trade
The three analytical layers in this analysis, positioning, implied move mechanics, and base-rate history, converge on a single variable: expiration.
The August 28th and August 31st expirations land in the one-day and one-week windows where Nvidia’s historical win rate is approximately 53% and 41% respectively. The implied move of 6.5% requires outperformance of an already well-calibrated market expectation. The $247.50 August 28th call required approximately a 10% move, nearly double the implied move, to reach profitability.
These are not obviously bad trades. Conviction like this sometimes pays. But the $11.6 million in premium sits in the two windows where Nvidia’s base rate is most unfavourable, and that is information any informed market participant should hold alongside the bullish conviction driving the positioning.
When evaluating any options catalyst trade, three questions clarify the risk:
- Identify the expiration window and check the stock’s historical win rate in that specific window. A strong company with a weak short-term win rate is a different proposition from a strong company with a strong one.
- Compare the required move to the implied move to assess the probability hurdle. If the trade needs the stock to move twice as far as the market expects, the odds are steep before you account for direction.
- Account for volatility crush before assigning a directional thesis any weight. For short-dated options, the collapse in implied volatility after the event is a cost that even correct directional calls must overcome.
The key analytical question for any catalyst trade is not whether the company will perform well. It is whether the expiration window gives the base rate any chance to work in the trade’s favour.
Investors exploring how markets calibrate implied moves across different event types will find our full explainer on catalyst implied move pricing, which breaks down why FOMC and CPI events produce structurally different volatility signatures and shows how to use that gap as a repeatable framework for reading market confidence.
This article is for informational purposes only and should not be considered financial advice. Investors should conduct their own research and consult with financial professionals before making investment decisions. Past performance does not guarantee future results. Financial projections are subject to market conditions and various risk factors.