Nvidia is growing revenue at roughly 42% annually, holds the dominant position in AI compute, and just received a $350 price target from one of Wall Street’s largest investment banks. It is also trading at its lowest forward earnings multiple in a decade.
That disconnect is the story BofA Global Research published today, 8 August 2026. When a high-growth stock compresses in valuation while its underlying business accelerates, one of two things is true: the market is pricing in a real structural threat, or the market is wrong. BofA’s analysis lands firmly on the second interpretation, and the data the firm presents is specific enough to examine rather than simply accept.
Here is the framework for evaluating BofA’s four-part thesis: the specific numbers underpinning the $350 price target, the 26 August earnings report as a near-term test of the thesis, and the risks BofA acknowledges but believes are overstated. After reading, you will have a clear basis for deciding whether the valuation compression is a buying opportunity or a signal the market knows something BofA does not.
The multiple that made BofA publish a note
Start with the number that prompted the note. According to BofA’s 8 August client note, Nvidia is currently valued at roughly 16x projected earnings for calendar-year 2027, a forward price-to-earnings (P/E) ratio, calculated as the share price divided by projected future earnings, that has not been this low at any point in the past decade.
On a nearer-term forward basis, the figure sits at approximately 18.7x. Either way, the picture is the same: a generational low.
Context sharpens the signal. Over the past decade, Nvidia’s forward P/E has ranged between 25x and 56x, with a ten-year average of 36.9x. The stock’s PEG ratio, which divides the P/E by the earnings growth rate, sits at approximately 0.5x against projected average sales growth of roughly 42%. A PEG below 1.0x is generally considered inexpensive for a growth stock; 0.5x for a company growing revenue at this pace is structurally anomalous.
The PEG ratio mechanics that make a 0.5x reading so anomalous are rooted in a simple correction to P/E: dividing the multiple by the earnings growth rate converts a static price-to-earnings snapshot into a growth-adjusted cost, and at any reading below 1.0x the market is implicitly pricing in structural underperformance that the company’s own trajectory does not support.
| Metric | Current | Historical avg / range | Implied discount |
|---|---|---|---|
| Forward P/E (2027 EPS basis) | 16x | 36.9x avg | ~57% |
| Forward P/E (near-term) | ~18.7x | 25x-56x range | ~49% vs avg |
| PEG ratio | ~0.5x | 1.0x (fair-value threshold) | ~50% |
| Projected sales growth | ~42% | N/A | N/A |
BofA describes the stock as “undemanding relative to its growth profile.”
The gap between a 16x-19x current multiple and a 36.9x historical average is not a rounding error. It tells you the market is applying a structural discount to Nvidia that has no precedent in the stock’s own recent history, and understanding why that discount exists matters more than the number itself.
When big ASX news breaks, our subscribers know first
What BofA’s $350 price target actually assumes
A price target without visible mechanics is an opinion. BofA’s $350 objective is built on three components:
- The earnings base: calendar-year 2027 EPS, which BofA models above current consensus.
- The multiple applied: 26x forward earnings, excluding cash on the balance sheet.
- The ex-cash adjustment: stripping out Nvidia’s cash position so the multiple reflects the operating business alone.
That 26x figure is the detail worth pausing on. It sits at the very bottom of Nvidia’s historical 25x-56x forward P/E band. BofA is not asking the market to re-rate the stock to a premium. It is arguing that Nvidia should recover to its own historical floor, which makes the thesis more defensible than a headline “$350 target” might initially suggest.
From a share price of $223.96 as of today, the target implies upside of 45%-70%, depending on the earnings assumptions applied. The 56% gap between the current 16x multiple and the 26x target multiple is where the return lives.
The 2030 scenario: what $25 EPS implies
BofA’s modelling puts Nvidia’s annual earnings per share above $25 by calendar-year 2030. Running that through even conservative multiples produces striking figures.
At 20x earnings, $25 EPS implies a share price of $500. At 25x, it implies $625. At BofA’s own floor multiple of 26x, the figure reaches $650. These are scenario analyses consistent with BofA’s published framework, not price targets, and they require the AI capital expenditure cycle to sustain itself for four more years. But they illustrate why BofA treats the current valuation as a compression rather than a correction.
How Nvidia built a moat the market is not fully pricing
According to BofA’s analysis, Nvidia is on track to hold 65%-70% of the broader AI accelerator market all the way to 2030. That share is not sustained by hardware alone. Three layers of competitive advantage reinforce each other.
- Hardware: Nvidia’s GPU architecture and the upcoming Vera Rubin chip cycle keep the company at the performance frontier for AI training and inference workloads. Each generation resets the switching calculus for data centre operators.
- Software: The CUDA ecosystem, Nvidia’s proprietary programming platform for GPU-accelerated computing, creates switching costs that BofA describes as “completely unappreciated” by the market. Developers, libraries, and partner integrations are all built on CUDA, making migration to a competitor’s architecture expensive and disruptive.
- Networking: Nvidia’s networking segment is growing rapidly, capturing increasing value per data centre rack beyond individual GPU card sales. This shifts the competitive framing from “chip seller” to “full-stack AI platform,” which changes both the revenue ceiling and the durability of margins.
AI GPU market share estimates from Silicon Analysts and IDC place Nvidia’s share of AI accelerator revenue at 75% to 81% in 2026, figures that sit at or above BofA’s own 65%-70% projection and reinforce the argument that CUDA’s switching costs are sustaining dominance competitors have so far failed to erode.
BofA describes the software moat as “completely unappreciated” by the market.
Demand signals reinforce the picture. Rental prices for B200 GPUs on the spot market have climbed to roughly $5.66 per hour, a level close to all-time highs. That is a market-based indicator of sustained scarcity, not a company-issued forecast.
BofA raised its estimate of the AI data centre total addressable market (TAM), the total potential revenue available in a given market, to approximately $1.7 trillion by 2030, up from $1.4 trillion previously. A 65%-70% market share projection in a $1.7 trillion addressable market means the moat argument is not about protecting a niche. It is about whether Nvidia can hold the commanding position in what may become one of the largest technology markets ever measured.
August 26 earnings as the first real test of the thesis
Nvidia reports fiscal Q2 results after market close on 26 August 2026. BofA’s above-consensus positioning makes this release a direct test of the firm’s thesis.
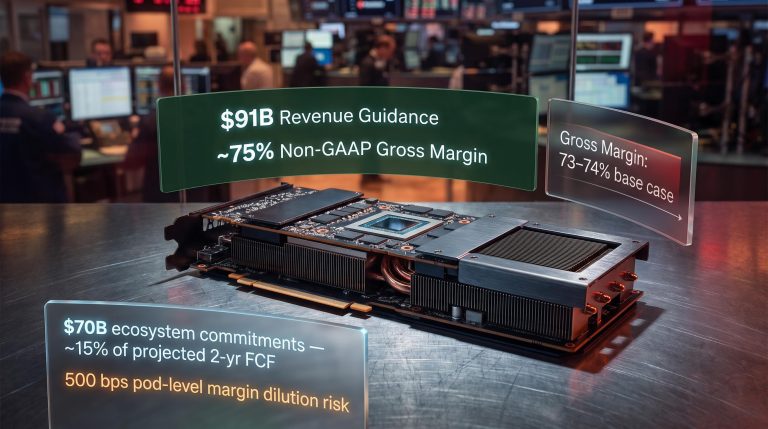
Nvidia set its own fiscal Q2 revenue guidance at roughly $91 billion. BofA’s internal modelling puts the figure at $94-95 billion, and the firm expects the company to guide fiscal Q3 revenue in the range of $107-108 billion, comfortably ahead of the broader analyst consensus sitting at approximately $104 billion. For the full fiscal year 2026, BofA models revenue of $210-215 billion and EPS of $4.70-$4.80, compared to street consensus of approximately $4.38.
| Metric | Nvidia guidance | BofA forecast | Street consensus |
|---|---|---|---|
| Fiscal Q2 revenue | ~$91B | $94-95B | N/A |
| Fiscal Q3 revenue | N/A | $107-108B | ~$104B |
| FY2026 EPS | N/A | $4.70-$4.80 | ~$4.38 |
The structural driver behind BofA’s above-consensus stance is the Vera Rubin upgrade cycle, Nvidia’s next-generation chip platform, which the firm views as initiating a multi-quarter revenue tailwind as data centre operators refresh their AI compute infrastructure.
The Vera Rubin supply chain is now fully qualified across all three major HBM4 memory producers, with Samsung, SK Hynix, and Micron each cleared for the platform, removing a key production bottleneck that could otherwise have constrained the multi-quarter revenue tailwind BofA is modelling.
Four metrics to watch in the 26 August release beyond headline revenue:
- Data centre segment growth rate and mix
- Networking segment revenue as a share of total
- China exposure disclosure and any forward guidance adjustments
- Management’s tone on forward demand and order visibility
If Nvidia guides fiscal Q3 revenue at or above $107 billion, it confirms BofA’s above-consensus positioning and creates the conditions for a multiple re-rating. If guidance falls short of the $104 billion consensus, the valuation discount argument becomes harder to sustain in the near term.
The risks BofA acknowledges but thinks the market is overstating
BofA’s thesis would be less interesting if it ignored the bear case. It does not. The firm names three primary risk categories:
- Custom silicon competition: Cloud providers including Google (TPUs) and Amazon (Trainium) are developing their own AI accelerators, which could pressure Nvidia’s market share or pricing power over time.
- China and geopolitical constraints: Security probes and trade restrictions could limit shipments of Nvidia’s H-series GPUs to Chinese customers, forcing product and supply-chain adjustments that weigh on near-term revenue.
- Power and infrastructure limits: Physical constraints on electricity supply and data centre buildout could cap how fast customers can deploy new AI compute capacity, regardless of demand.
The custom silicon competitive threat from Google, Amazon, and Microsoft is most acute in inference workloads, which are projected to represent approximately 80% of the AI accelerator market by 2030, meaning the segment where Nvidia’s GPU architecture faces the strongest substitution pressure is also the one set to become the largest by revenue.
BofA’s response is not to dismiss these risks. It is to quantify them. Under scenarios incorporating tighter China restrictions, the firm models 2026 EPS of $4.40-$5.05. Even at the low end of that range, the implied P/E is 22.5x-26x, which still sits below the ten-year historical average of 36.9x.
BofA characterises the market as applying a 30-35% “unjustified EPS headwind” versus growth peers.
The stress-case scenario producing a 22.5x-26x P/E still below the historical average means that if BofA’s China-scenario modelling is directionally correct, the downside case still implies the stock is cheap relative to its own history. That does not mean the risks are immaterial. It means the current price may already be discounting them more aggressively than the evidence warrants.
What is actually embedded in the valuation gap, and what resolves it
BofA’s thesis rests on four pillars: a historically anomalous valuation, above-consensus near-term earnings, a durable competitive moat, and a risk discount the firm considers excessive. Each is individually arguable. Together, they form a coherent claim: the market is applying a discount that the fundamentals do not support.
Two conditions would validate the thesis in the near term:
- Nvidia guides fiscal Q3 revenue at or above BofA’s $107 billion forecast on 26 August.
- No material negative development on China exposure or ASIC competitive positioning emerges before year-end.
Two conditions would challenge it:
- Fiscal Q3 guidance comes in below the $104 billion consensus, signalling demand deceleration.
- A major cloud provider announces meaningful GPU displacement through custom silicon at scale.
The 16x-to-26x multiple expansion implicit in the path from the current price to BofA’s $350 target is not closed by time alone. It requires quarterly earnings beats and guidance upgrades to shift market sentiment, which means investors who agree with BofA’s thesis should be prepared for a multi-quarter re-rating process rather than an immediate re-price.
For investors with a longer time horizon
BofA’s $25 EPS projection by 2030 at a 26x multiple implies a valuation roughly five times current levels. The AI data centre TAM expansion to $1.7 trillion provides the demand framework that supports it. For investors whose evaluation window extends beyond the 26 August earnings release, the risk-reward calculation shifts: near-term binary risk on a single quarter matters less when the thesis horizon is four years of compounding earnings growth.
The AI capital expenditure cycle that BofA’s 2030 projections depend on is already tracking at an extraordinary scale, with the four largest hyperscalers collectively committing approximately $725 billion in 2026 capex and projecting a $1 trillion annual run rate for 2027, a trajectory that provides the demand floor underneath Nvidia’s TAM expansion estimate.
That does not make the long-term scenario a certainty. It is a projection that requires the AI capital expenditure cycle to sustain itself, Nvidia’s competitive position to hold, and margins to remain durable. Stress-test the assumptions rather than accept them at face value.
This article is for informational purposes only and should not be considered financial advice. Investors should conduct their own research and consult with financial professionals before making investment decisions. Past performance does not guarantee future results. Financial projections are subject to market conditions and various risk factors.