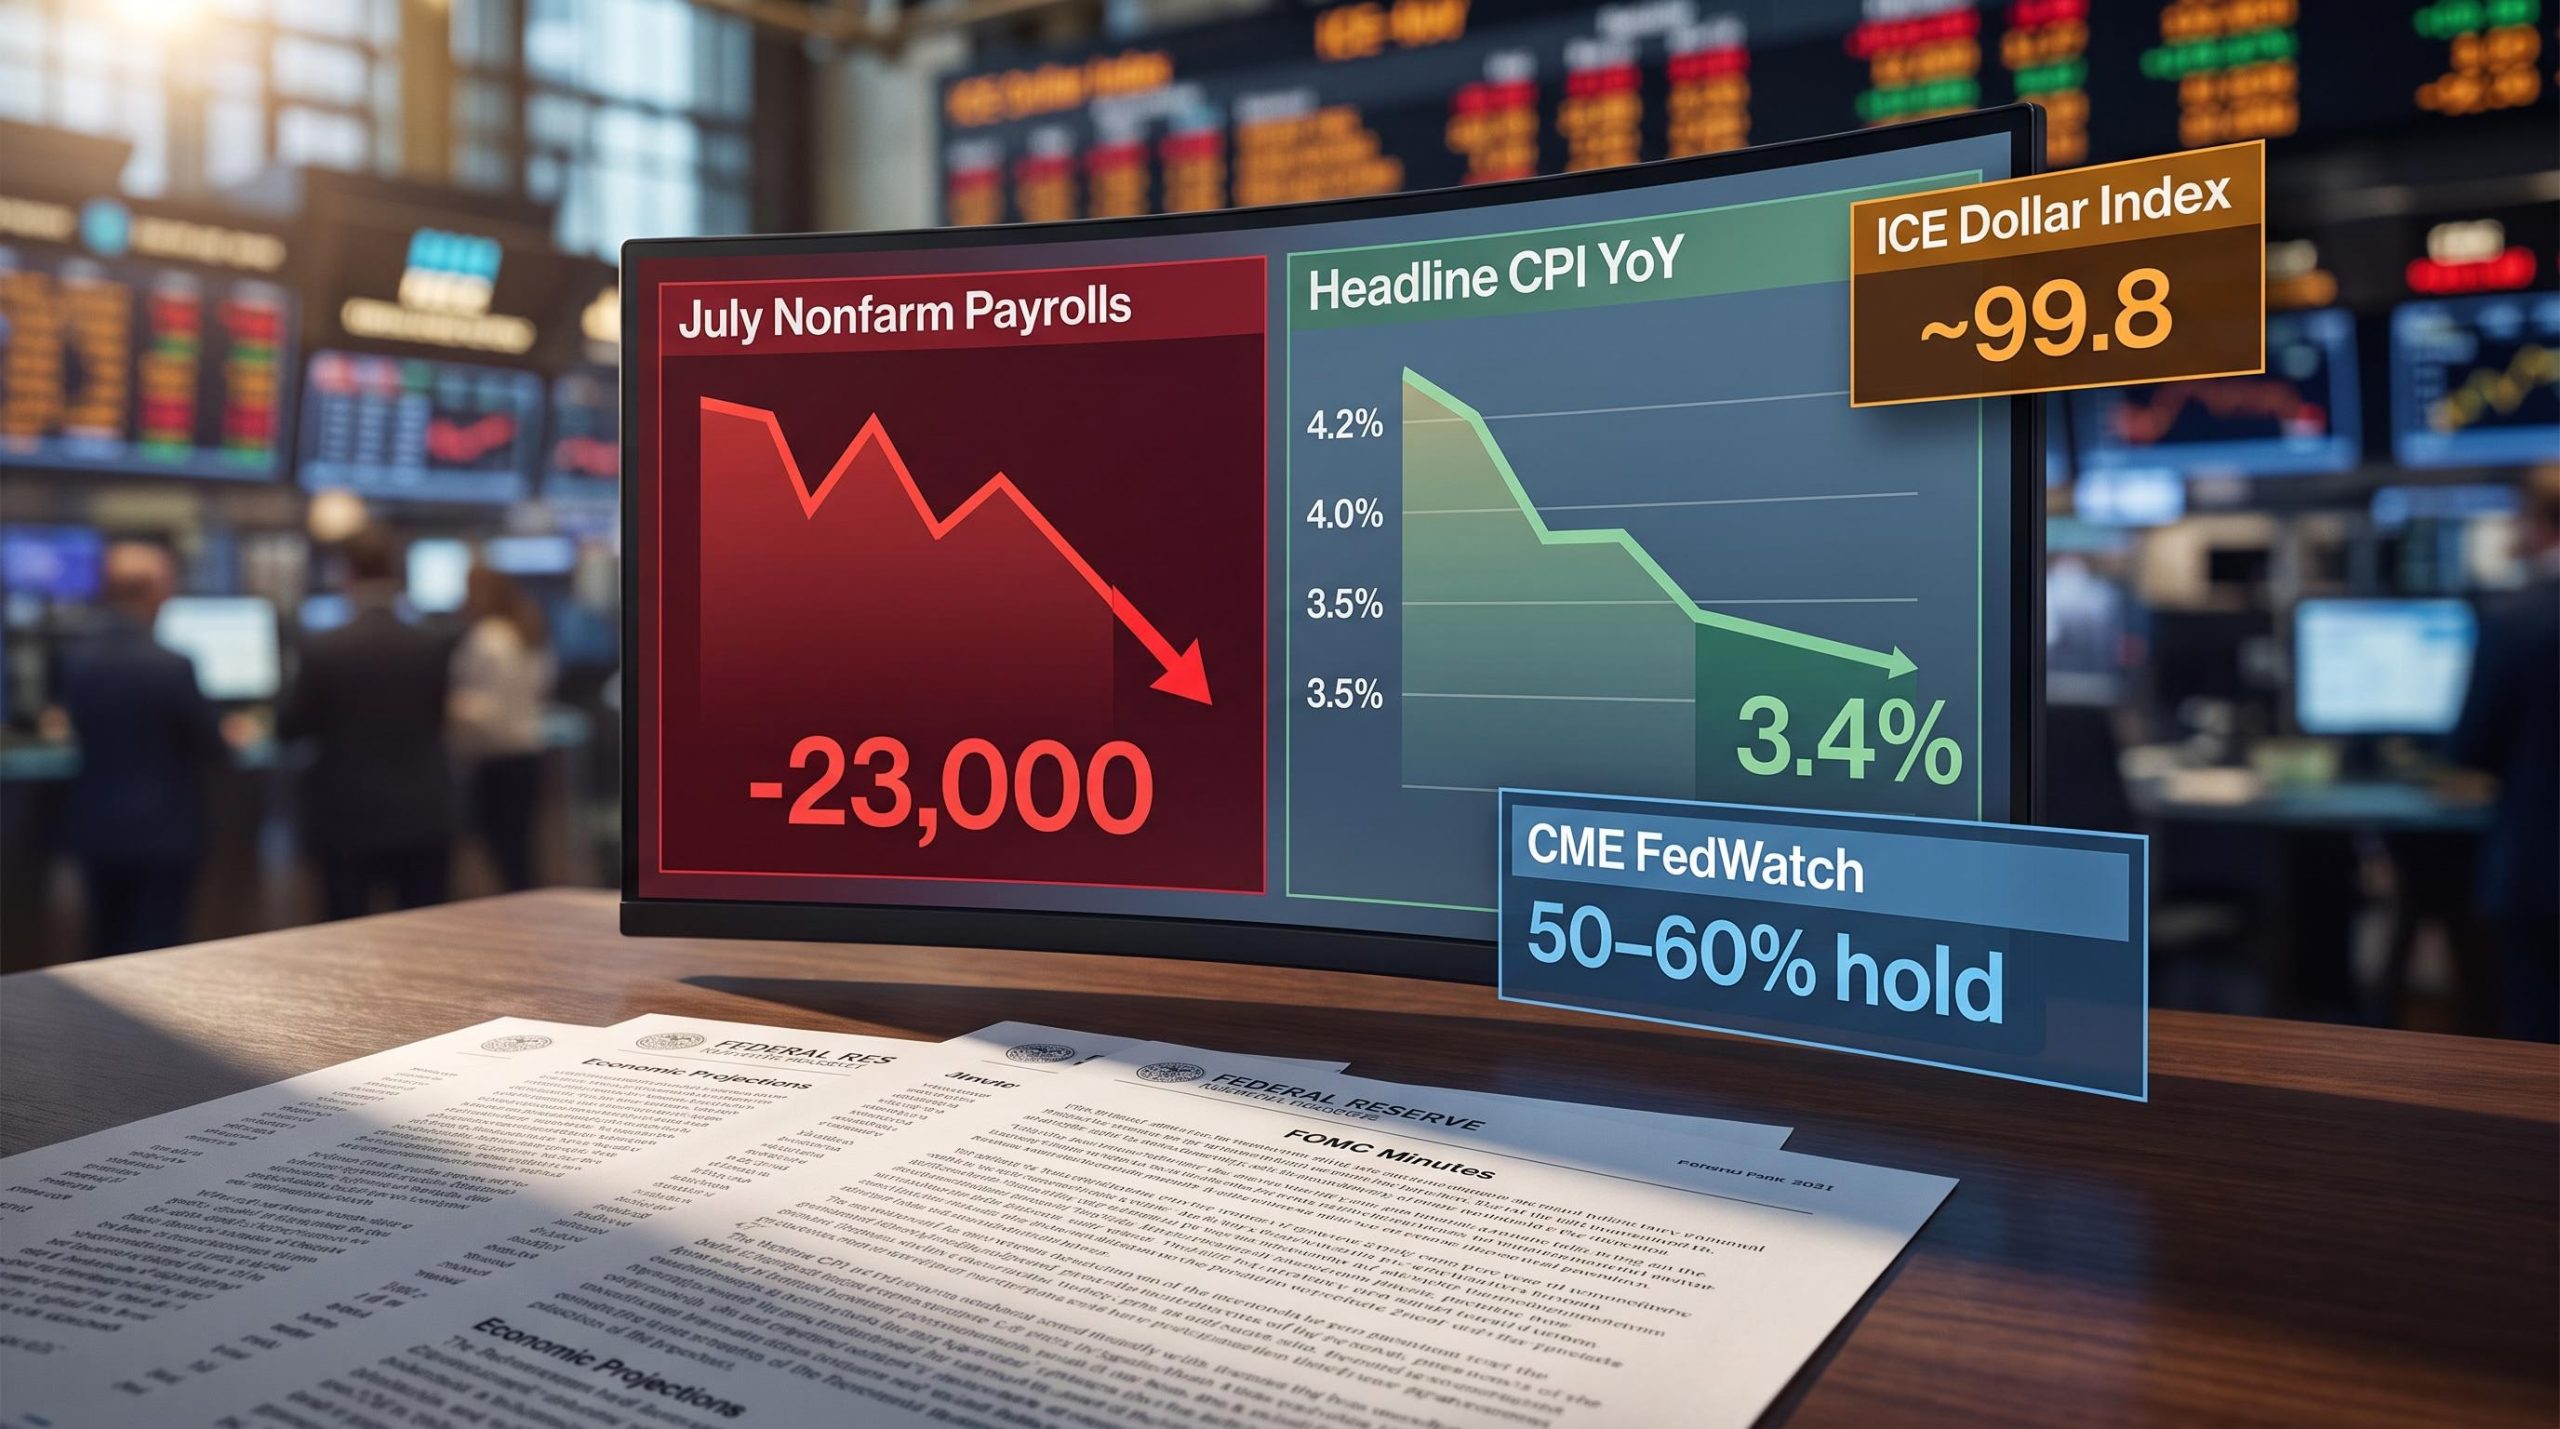
On 7 August, nonfarm payrolls contracted for the first time in this cycle, shedding 23,000 jobs against a consensus that expected modest growth. Five days later, the July CPI report lands. The two data points together are doing something the past two years of Fed-watching rarely allowed: pulling both sides of the dual mandate in exactly the same direction.
For most of the current tightening cycle, the Federal Reserve faced a familiar tension: inflation too high to cut, the labour market too hot to justify easing, too fragile to ignore. That tension is dissolving. Cooling consumer prices and a deteriorating jobs picture are converging in a way that materially reshapes what the Fed can justify doing next, and when.
Here is what the jobs data actually signals beneath the headline, how today’s CPI release fits into that picture, and what the combined read means for you if you are navigating duration, equity sector exposure, and dollar positioning right now.
What the July jobs report actually revealed beneath the headline numbers
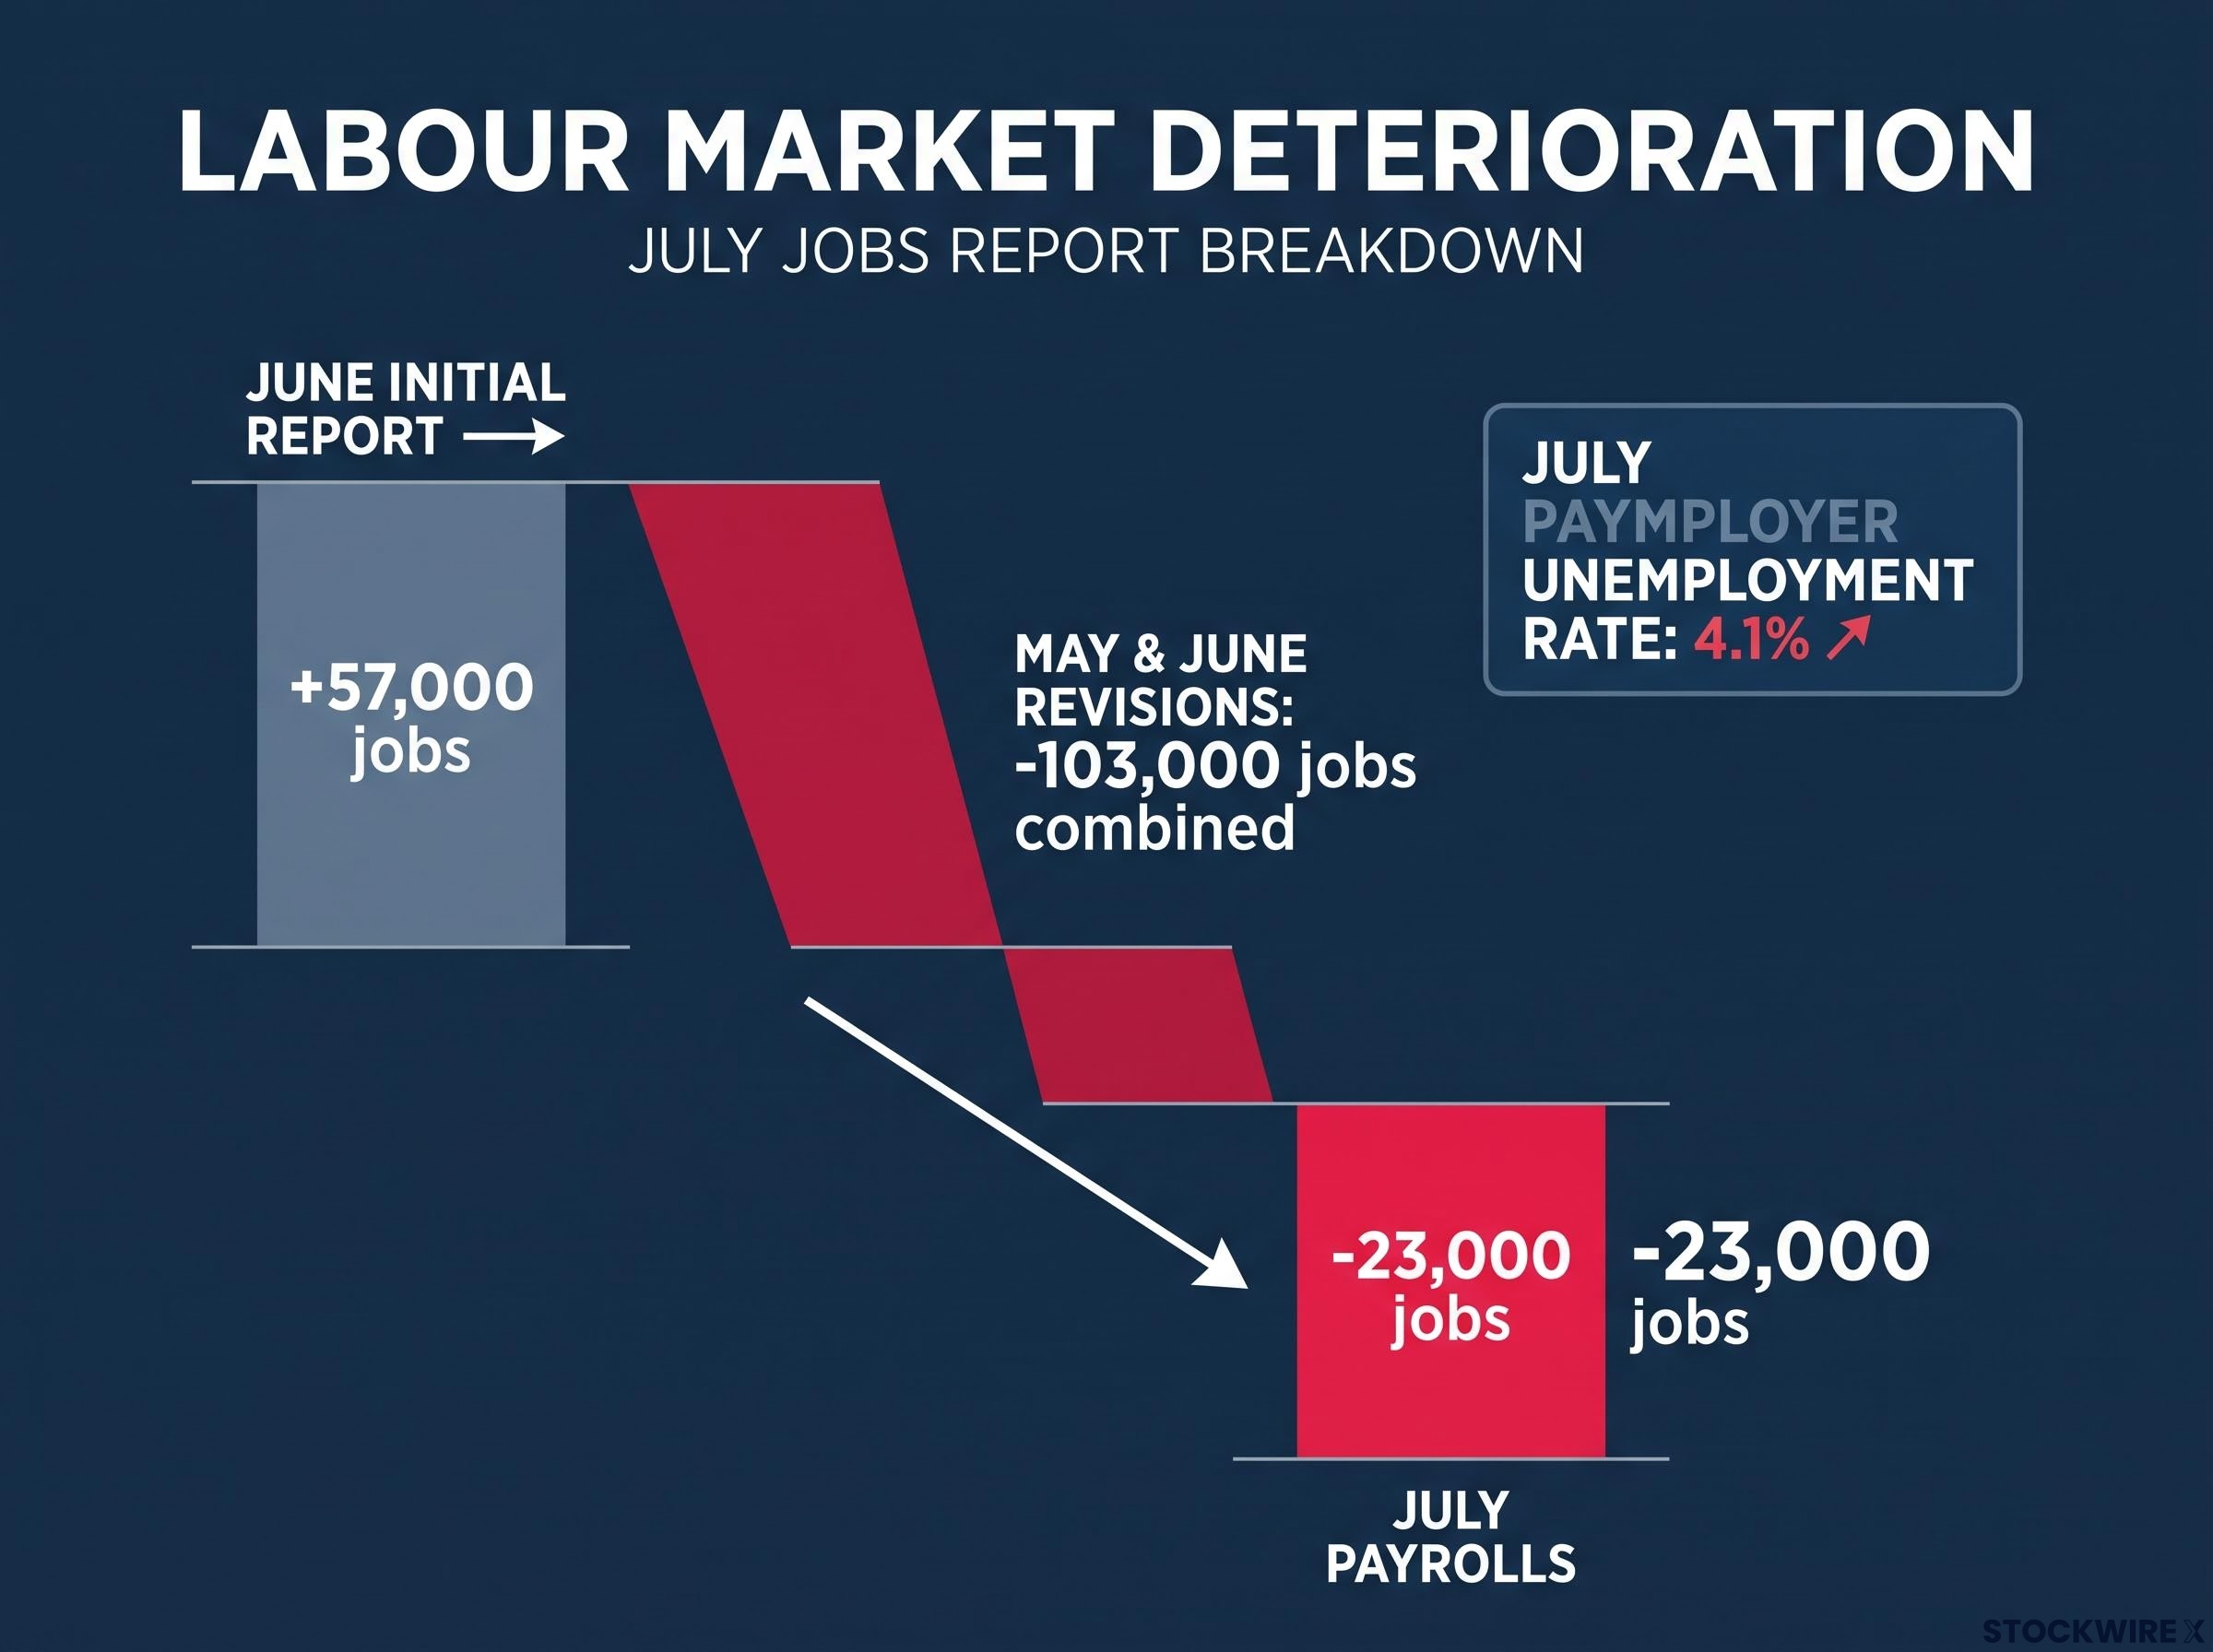
The surface number was bad enough. The Bureau of Labor Statistics reported minus 23,000 nonfarm payrolls for July, the first outright contraction of the cycle. TD Securities characterised the print as a “clear negative surprise,” and markets responded accordingly.
TD Securities called the July payrolls print a “clear negative surprise,” anchoring the immediate market reaction in the judgment that the deterioration was genuine, not statistical noise.
But the headline was not the most structurally important finding. What arrived alongside it was worse. The BLS revised May and June payrolls lower by a combined 103,000 jobs. June, initially reported at +57,000, was revised down further. The implication is that the labour market had been running weaker than the data showed for months; investors who positioned around those prior prints were operating on an incomplete picture.
The June payrolls miss, which came in at roughly half the 114,000 consensus forecast, now reads as the first clear break in the labour market trend rather than an isolated soft print, with July’s contraction confirming a deterioration that was already underway before the revision data made it visible.
Three signals emerged from the report, layered on top of each other:
- The headline: July payrolls contracted by 23,000, breaking a sustained run of positive monthly gains
- The revisions: A combined 103,000 jobs removed from May and June, meaning the softening is more advanced than any single month suggests
- The unemployment rate: Fell to 4.1%, but for reasons that do not signal strength
Why the unemployment rate decline is not good news
A declining unemployment rate sounds positive. In this case, it is not. According to TD Securities, the fall to 4.1% reflected a contraction in labour force participation rather than any genuine hiring improvement, with workers withdrawing from the job search entirely rather than finding employment. When people exit the labour force entirely, they are no longer counted as unemployed, which pushes the rate down mechanically. A genuine improvement looks different: unemployment falling alongside rising payrolls. July delivered the opposite pattern, and that distinction changes the read on labour-market health entirely.
Labour market quality signals, including involuntary part-time employment and the gap between headline payrolls and ISM employment sub-indices, had already been flashing caution several months before the July contraction materialised, suggesting the deterioration in the unemployment rate participation data is a continuation rather than a sudden break.
When big ASX news breaks, our subscribers know first
The inflation picture on the day the data lands
Before today’s number arrives at 8:30 a.m. ET, the trajectory already tells you something. Headline CPI moved from 4.2% year-on-year in May to 3.5% in June (with a minus 0.4% month-on-month print). Core CPI sat at 2.6% year-on-year in June, with a flat 0.0% monthly reading. The direction is clearly downward.
Bloomberg and Dow Jones survey data point to a July headline CPI of around 3.4% year-on-year, with core forecast to edge down to roughly 2.5%. On a monthly basis, the street is looking for +0.1% on the headline and +0.2% on core. An in-line print would confirm the existing disinflationary trend without forcing abrupt repositioning.
For most investors, the specific decimal matters less than which of three scenarios today’s release falls into. Here is what each one would signal:
| Scenario | Headline YoY | Likely Market Read | Primary Asset Affected |
|---|---|---|---|
| In-line | ~3.4% | Validates gradual disinflation; current positioning holds | Front-end Treasuries (modest rally) |
| Downside surprise | Below 3.3% | Markets price earlier, steeper cuts; dollar weakens further | US Dollar (sell-off), rate-sensitive equities (rally) |
| Upside surprise | Above 3.5% | Partially reverses recent repricing; hike probability re-emerges | Front-end yields (sell-off), equities (pullback) |
A core surprise in either direction is the variable that would force genuine repositioning. Knowing this framework in advance lets you interpret the number in real time rather than waiting for analyst commentary to tell you what it meant.
Why the dual mandate now points in one direction
The Federal Reserve operates under a dual mandate, a legal requirement to pursue both price stability (keeping inflation near 2%) and maximum employment simultaneously. For the past two years, those two objectives pulled in opposite directions. That dynamic has changed.
The Federal Reserve dual mandate framework, as reaffirmed in the FOMC’s January 2026 Statement on Longer-Run Goals, explicitly defines price stability as inflation near 2% and maximum employment as the highest sustainable level of labour utilisation the economy can support without generating excess inflation.
Here is what justified “higher for longer” through most of this cycle, and what the data now shows instead:
- What justified holding rates high: Inflation remained well above 2%, and the labour market kept adding jobs at a pace that suggested the economy could absorb restrictive policy without significant damage. As long as employment held up, the Fed had cover to prioritise inflation.
- What the data now shows: Payrolls have contracted. Prior months were revised lower by 103,000 combined. Inflation has dropped from 4.2% to 3.5% to a projected 3.4%. The employment mandate is now pulling toward easing at the same time the price-stability mandate is easing its grip on the other side.
This is the structural shift worth internalising. It is not about a single payrolls miss or a single CPI print. It is the first time in this cycle that both mandates are simultaneously aligned toward easier policy rather than creating a tension the Fed must referee. That changes the decision calculus in a way that no individual data point, on its own, ever could.
How markets have repriced since the jobs report
The repricing that followed the 7 August payrolls release was not a single-asset reaction. It moved coherently across rates, currencies, and equities, and the logic connecting the three tells you where markets believe this is heading.
The CME FedWatch Tool shifted to approximately 50-60% probability of a hold at the September FOMC meeting following the jobs report, a meaningful move away from hike pricing and toward hold-or-cut territory.
That probability shift is the most direct gauge of how Federal Reserve rate expectations changed in five days. It drove the rest.
| Asset Class | Direction of Move | Driving Logic | Key Risk to Thesis |
|---|---|---|---|
| Treasuries (front-end yields) | Rally (yields lower) | Markets pricing prolonged hold and eventual cuts | Upside CPI surprise reignites hike expectations |
| US Dollar (ICE index ~99.8) | Weaker | Rate-differential narrows if Fed eases while other central banks hold | August payrolls rebound removes easing urgency |
| Equities | Mixed: rate-sensitive up, cyclicals pressured | Lower discount rates benefit duration; labour weakness threatens earnings | Labour deterioration accelerates faster than rate relief arrives |
The dollar is the clearest single indicator to watch from here. If the Fed moves toward easing while other major central banks hold or tighten, the rate differential becomes a sustained headwind for the greenback, and that has direct implications for anyone with international equity or commodity exposure. Rate-sensitive sectors (real estate, utilities, long-duration growth) benefit from the repricing. Cyclicals (industrials, consumer discretionary) face a countervailing headwind: lower rates help the discount rate, but a weakening labour market threatens the earnings those sectors depend on. You need to hold both of those simultaneously.
What the dual mandate means for portfolios and how monetary policy actually works
Monetary policy does not work instantly. The rate decisions the Fed made in 2024 and 2025 are still working their way through the economy right now. This transmission lag, typically six to eighteen months, is what makes the current data so important and the Fed’s position so difficult.
Monetary policy transmission lags, which Friedman characterised as long and variable, mean the July payrolls contraction is most accurately read as the delayed product of rate decisions made in 2024 and early 2025 rather than a signal that current policy has suddenly become too restrictive.
Here is how the chain works:
- The Fed raises rates
- Credit conditions tighten across the economy (mortgages, business loans, lines of credit)
- Hiring slows as the cost of capital rises and demand softens
- Payrolls contract as employers pull back
The July jobs report sits at step four. The softening you are seeing is the delayed product of past hikes, not a new shock requiring a new response. But the Fed cannot simply wait for the data to confirm a full recovery before cutting; by the time unemployment data clearly signals distress, the damage from high rates is already embedded and harder to reverse.
The two risks the Fed is weighing simultaneously
The Fed faces genuinely balanced risks from here. Moving too slowly to ease could deepen labour-market damage as restrictive rates continue to weigh on hiring and investment. Moving too quickly could risk re-accelerating inflation before it is firmly anchored at 2%. The July payrolls contraction raises the probability of the first scenario. Still-above-target inflation, even at 3.4-3.5%, keeps the second scenario live. Neither risk has been resolved.
What comes before the September meeting, and what to watch for
Several data points and events will determine how far the current repricing extends before the September FOMC meeting. Not all carry equal weight. Here is the sequence that matters, and what each needs to show to shift the current narrative:
- July CPI (today, 12 August): The scenarios are already established. An in-line print keeps the narrative intact. A core surprise in either direction is what forces repositioning.
- Jackson Hole symposium (late August): This is the key interpretive moment. If Chair Powell frames inflation as “on track” while emphasising growing concern about employment conditions, that is effectively the Fed pre-announcing that easing is under consideration. Rate-sensitive markets will move before any formal decision.
- August payrolls (pre-September): A second consecutive negative or near-zero print would make a September cut, or at minimum a strong signal of November cuts, very difficult for the Fed to avoid. Watch labour force participation specifically, given the July unemployment rate anomaly.
- September FOMC meeting: The decision point the entire calendar is building toward. By then, the Fed will have two more months of employment data and one more CPI print to weigh.
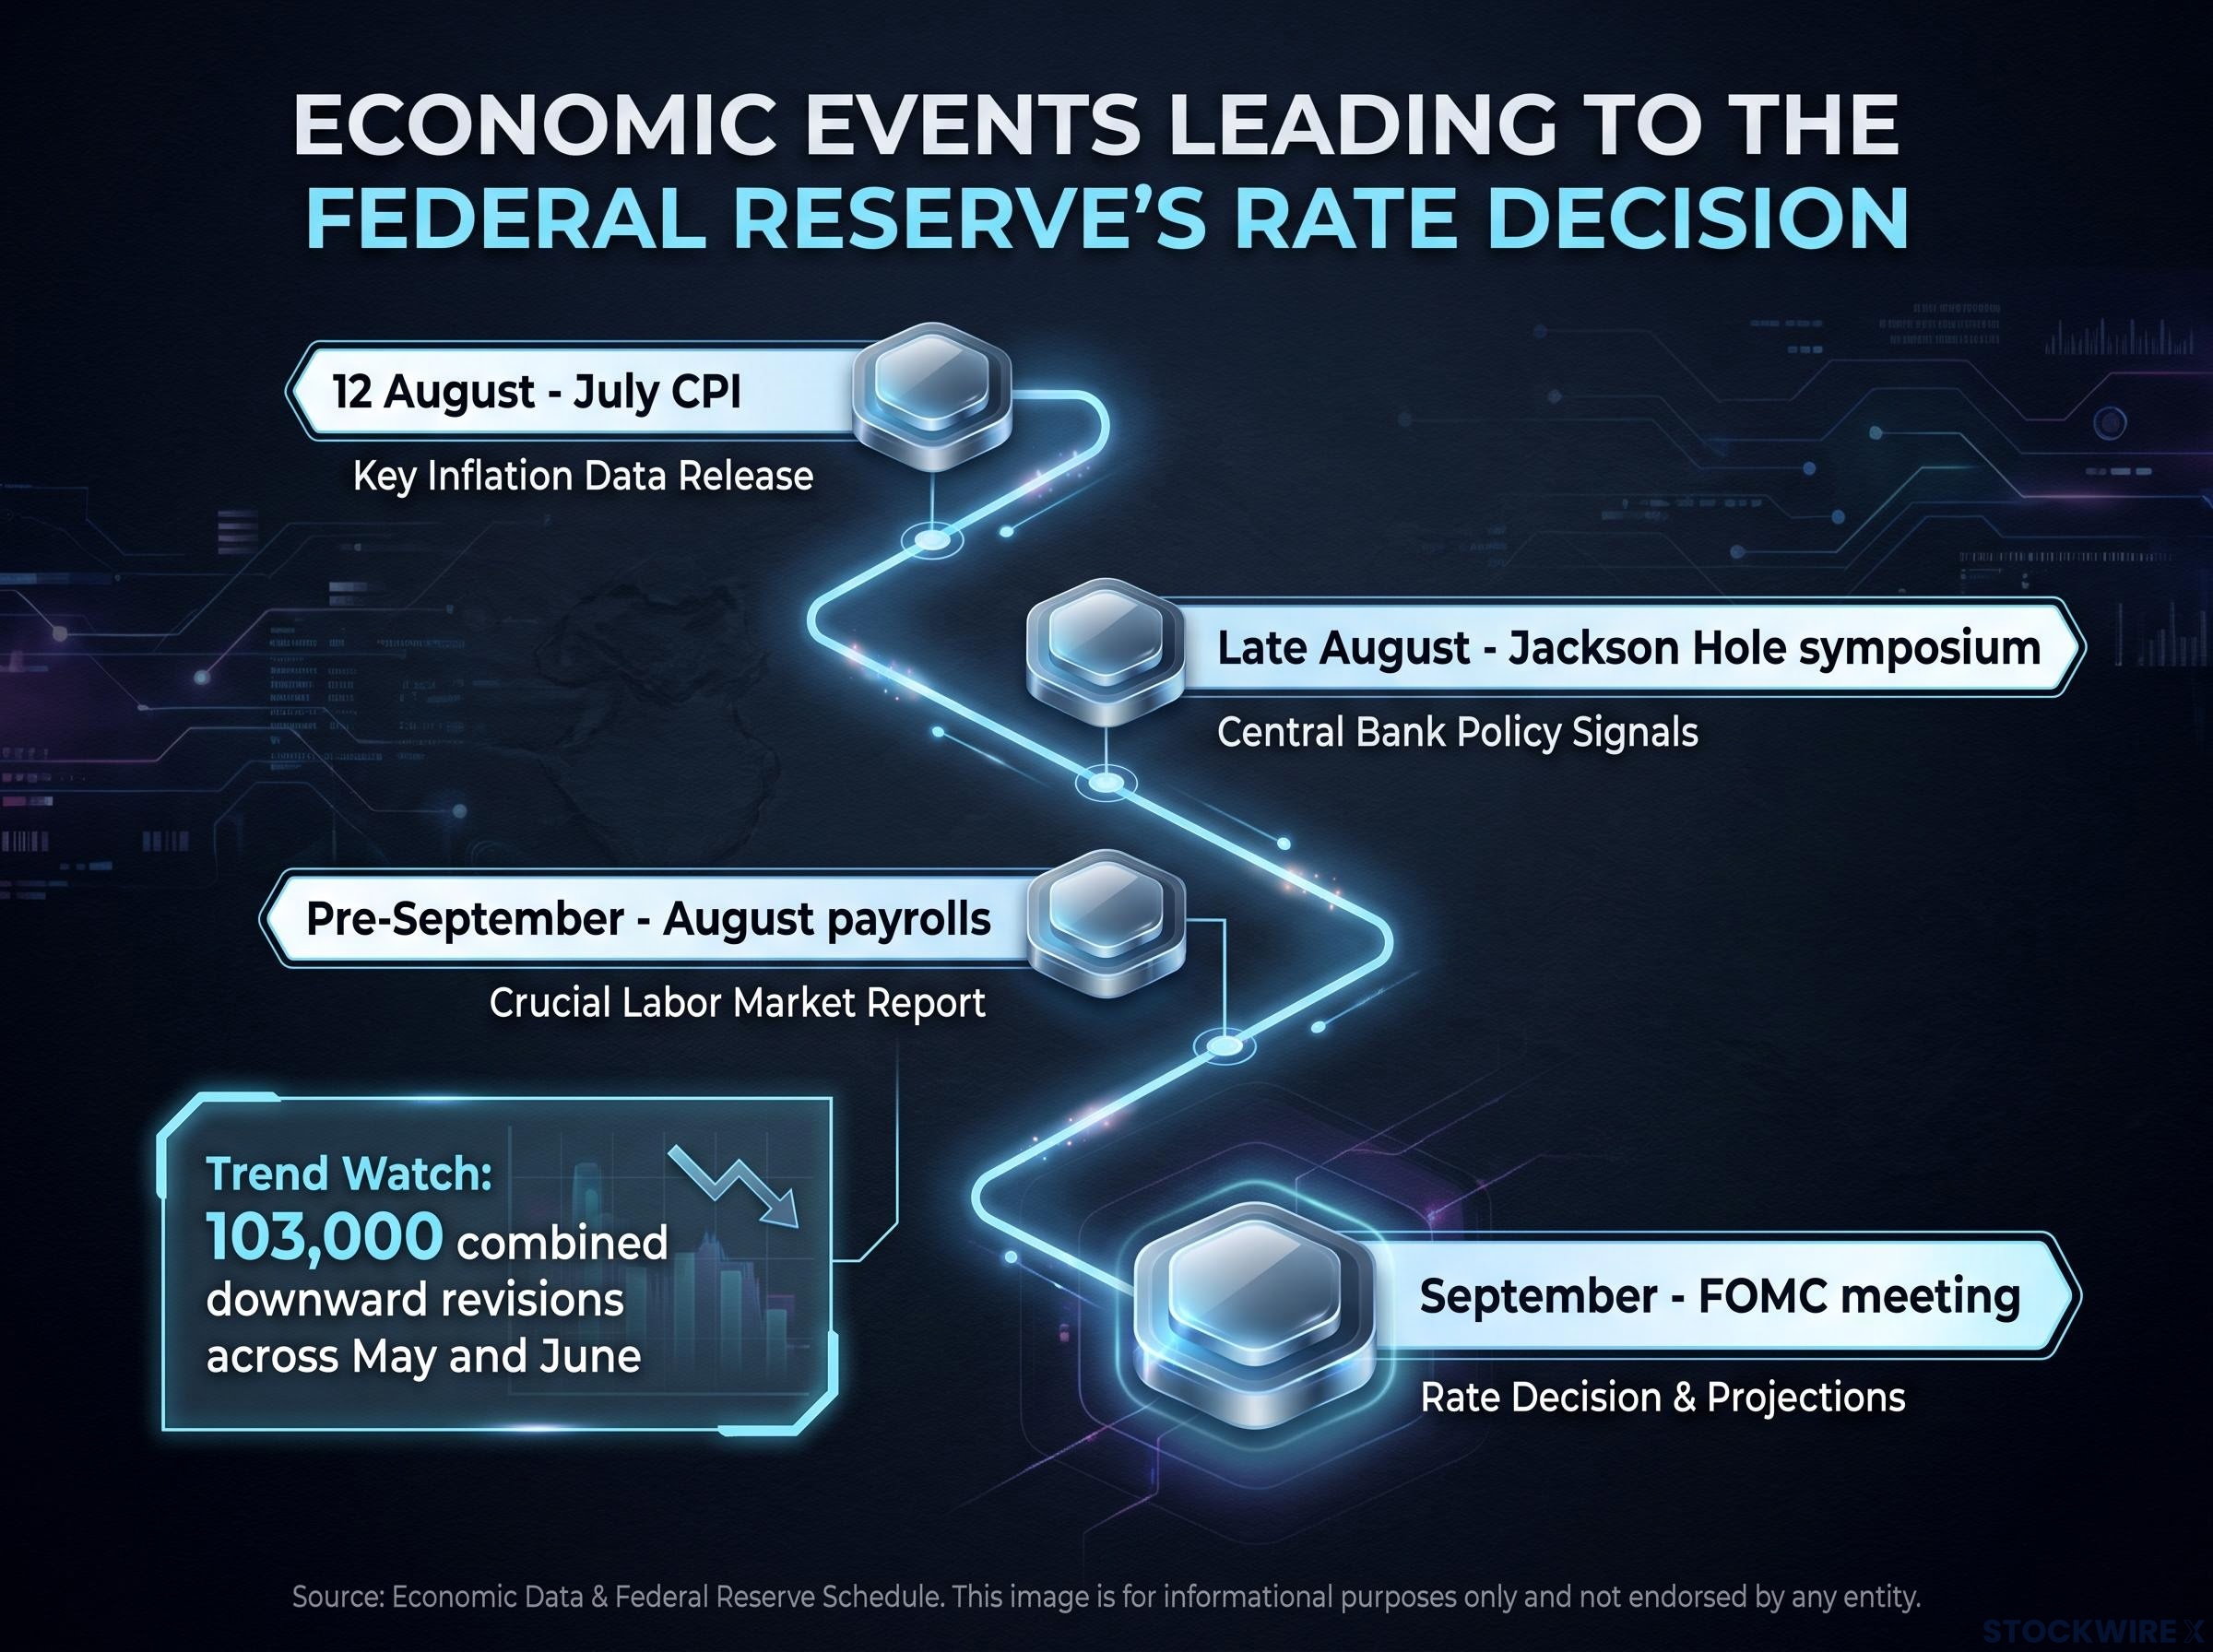
Jackson Hole is where the Fed’s framing becomes explicit. If Powell acknowledges both mandates pulling in the same direction, the market will treat it as a signal that the pivot is under active discussion, not a hypothetical.
Given the scale of recent revisions (103,000 combined across May and June), single prints deserve less confidence than the multi-month trend. Track participation rates within each employment release. That is where the July anomaly revealed itself, and it is where the next signal is most likely to sit.
The case for positioning ahead of the curve, and what could still go wrong
The convergence of both mandates toward easier policy represents the most unambiguous pivot signal the market has seen since the hiking cycle began. Investors who wait for explicit Fed confirmation will have missed most of the move in rates and rate-sensitive equities. The repricing in front-end Treasuries, the dollar, and duration-sensitive sectors has already started, and it started on 7 August, not whenever the Fed formally announces a cut.
That said, directional clarity is not timing certainty. Three specific conditions would break the current thesis:
Fed communication risk is not a theoretical concern in the current environment: the institutional backdrop involves a newly confirmed chair whose relationship with the White House has been publicly scrutinised, adding a layer of interpretive uncertainty to any forward guidance delivered at Jackson Hole.
- A CPI upside surprise today, particularly in core, that suggests disinflationary progress has stalled
- A rebound in August payrolls strong enough to cast the July contraction as an anomaly rather than a trend
- Unexpected Fed communication suggesting tolerance for higher unemployment in service of inflation anchoring, reaffirming “higher for longer” despite the jobs data
The direction of travel is increasingly clear. Both sides of the dual mandate are now aligned toward easier policy for the first time in this cycle. But investors who confuse directional clarity with timing certainty are the ones most likely to be shaken out by interim volatility before the pivot materialises.
What you can control is the quality of your analytical framework for reading incoming data, not the timing of a Fed announcement that may or may not arrive on schedule. The data calendar laid out above gives you a sequenced structure for monitoring. The thesis-breaking conditions give you explicit triggers for reassessment. Holding a directional view with clear awareness of what would invalidate it is what separates analytical positioning from speculation.
This article is for informational purposes only and should not be considered financial advice. Investors should conduct their own research and consult with financial professionals before making investment decisions. Past performance does not guarantee future results. Financial projections are subject to market conditions and various risk factors.