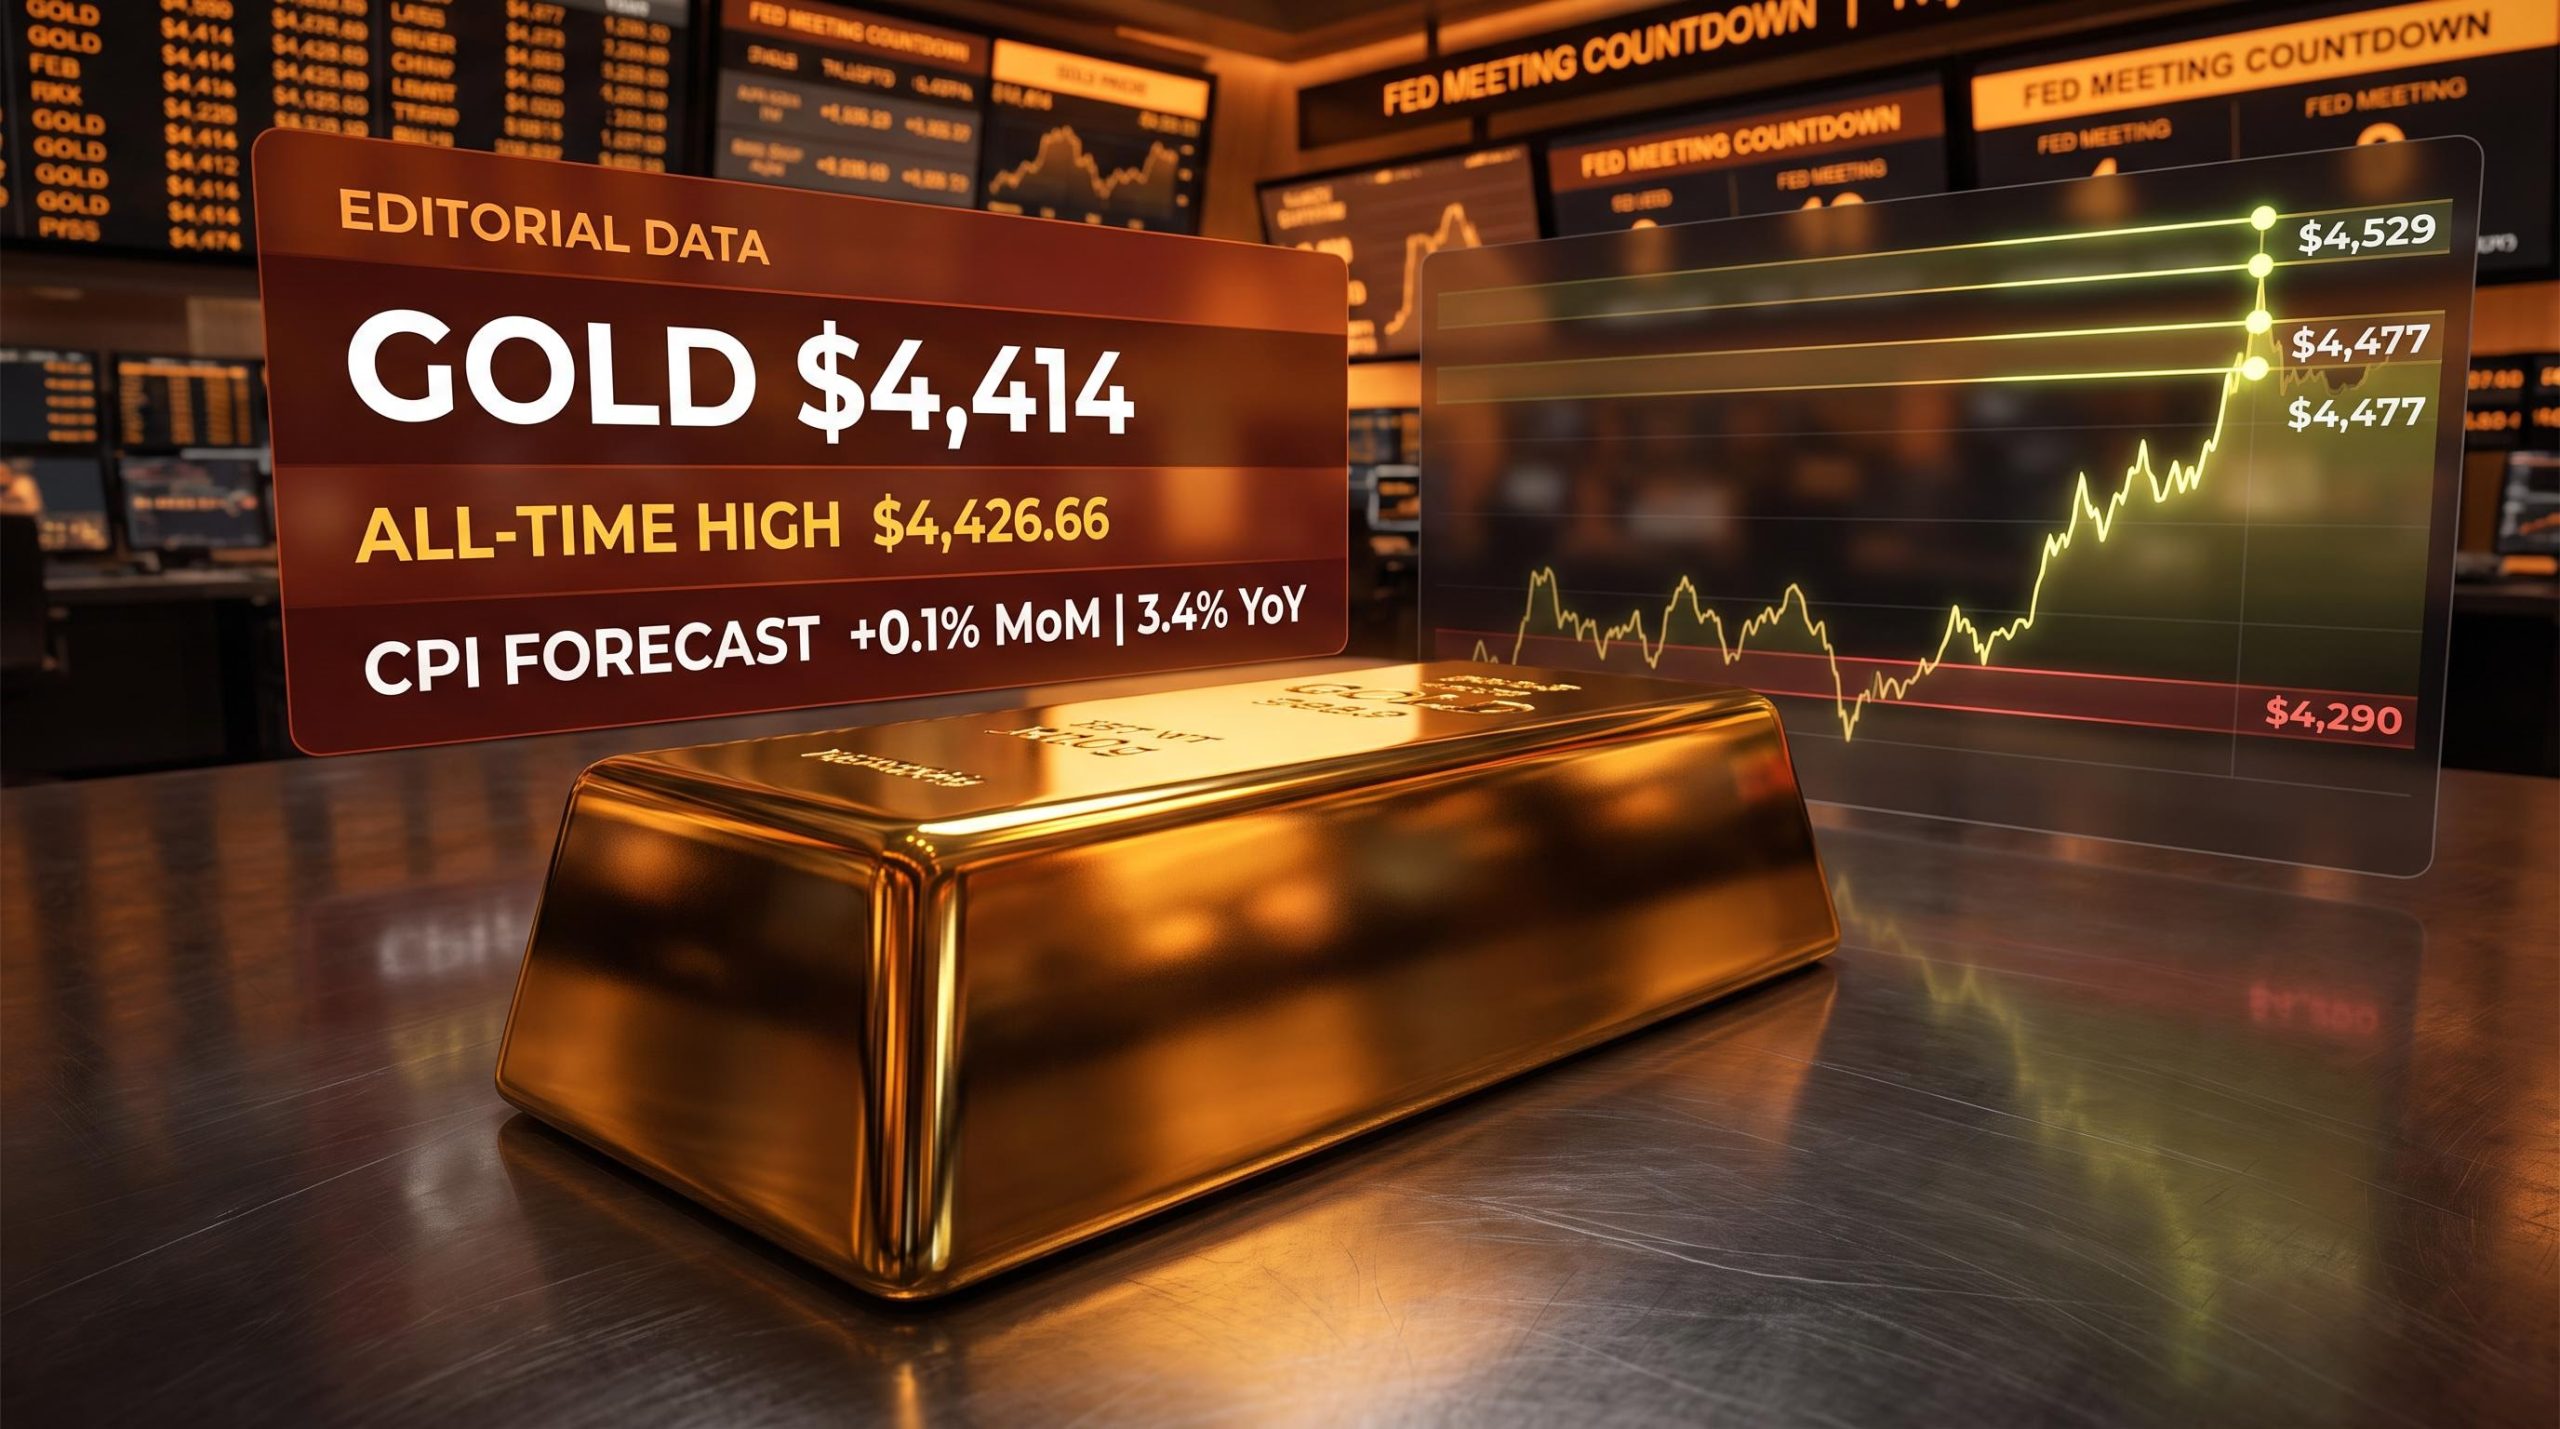
Gold is trading at $4,414 per ounce this morning in Asia, a level that has now been contested three times in two days. The next decisive move may arrive within hours when the US Bureau of Labor Statistics (BLS) releases its July Consumer Price Index (CPI) reading.
The inflation report lands at a moment when Fed rate-cut expectations, a softening dollar, and persistent central-bank buying have already pushed gold to a fresh all-time record of $4,426.66. Whether today’s print confirms disinflation or surprises to the upside will directly reset the odds of a September policy pivot, the single variable gold traders are pricing around most aggressively right now.
Here is how the three paths this data could take would likely affect gold in the near term, where the technical levels sit that traders will be watching as the numbers hit, and why the structural backdrop matters more than any single print.
Why gold is back above $4,400 right now
Spot gold reclaimed $4,400 for the third time in two sessions during the Asian session on 12 August 2026, trading around $4,414-$4,415 per ounce with August futures near $4,406. That third reclaim tells you something about the current dynamic: bulls keep defending this level, but the repeated tests also signal that conviction is not yet strong enough to sustain a clean break higher.
Fresh record high: Gold touched $4,426.66 per ounce, its highest level in history and the first time the metal has traded above its prior peak set on 5 June.
The rally to these levels is not a single-catalyst move. Four forces have converged to push gold into historically elevated territory:
- Weaker US payrolls data reduced the probability of further Fed tightening and shifted rate expectations toward cuts
- A softer US dollar made gold cheaper for holders of other currencies, lifting demand mechanically
- Central-bank buying, notably from China, added structural demand beneath the spot market
- Crude oil price volatility introduced a separate layer of inflation uncertainty, reinforcing gold’s appeal as an inflation hedge
That combination of forces is why the $4,400 level has become a magnet rather than a ceiling. Each driver on its own would be supportive. Together, they explain why gold is pressing against record territory ahead of a data release that could either validate or challenge the current trajectory.
When big ASX news breaks, our subscribers know first
How CPI data moves gold prices
Gold’s reaction to CPI does not happen in a straight line. It flows through two primary transmission channels, and understanding both is what separates a reactive trade from an informed one.
- Dollar direction: Gold is priced in US dollars, so when CPI comes in soft and the dollar weakens, gold becomes cheaper for international buyers. That mechanical support tends to push prices higher. The reverse applies when a hot print strengthens the dollar.
- Fed rate-cut expectations: CPI data directly shapes how markets price the timing and pace of interest rate cuts. Lower inflation increases the odds of cuts, which reduces real yields (the return on bonds after subtracting inflation). When real yields fall, gold, which pays no interest, becomes relatively more attractive compared to interest-bearing assets.
Real yields and dollar strength remain the two mechanical forces most capable of overriding every geopolitical and inflationary catalyst in gold’s favour, a dynamic that played out sharply earlier in 2026 when gold fell nearly 25% from its prior record even as war and elevated inflation data argued the other way.
For anyone holding gold positions or considering them, the core takeaway is that today’s CPI print is not just a data point. It is effectively a lever that could shift the September Fed decision in either direction, and gold’s price will move to reflect whatever that shift implies for real borrowing costs.
What the forecasts show
Consensus estimates point to a monthly CPI gain of +0.1% for July, following the -0.4% drop recorded in June, with the year-on-year rate expected to pull back to 3.4% from 3.5% the month prior. The BLS was scheduled to publish this report on Wednesday of this week.
If those numbers land as expected, they would confirm a gradual cooling trend without signalling an abrupt collapse in price pressures. That is the baseline. The scenarios below map what happens if reality diverges from it.
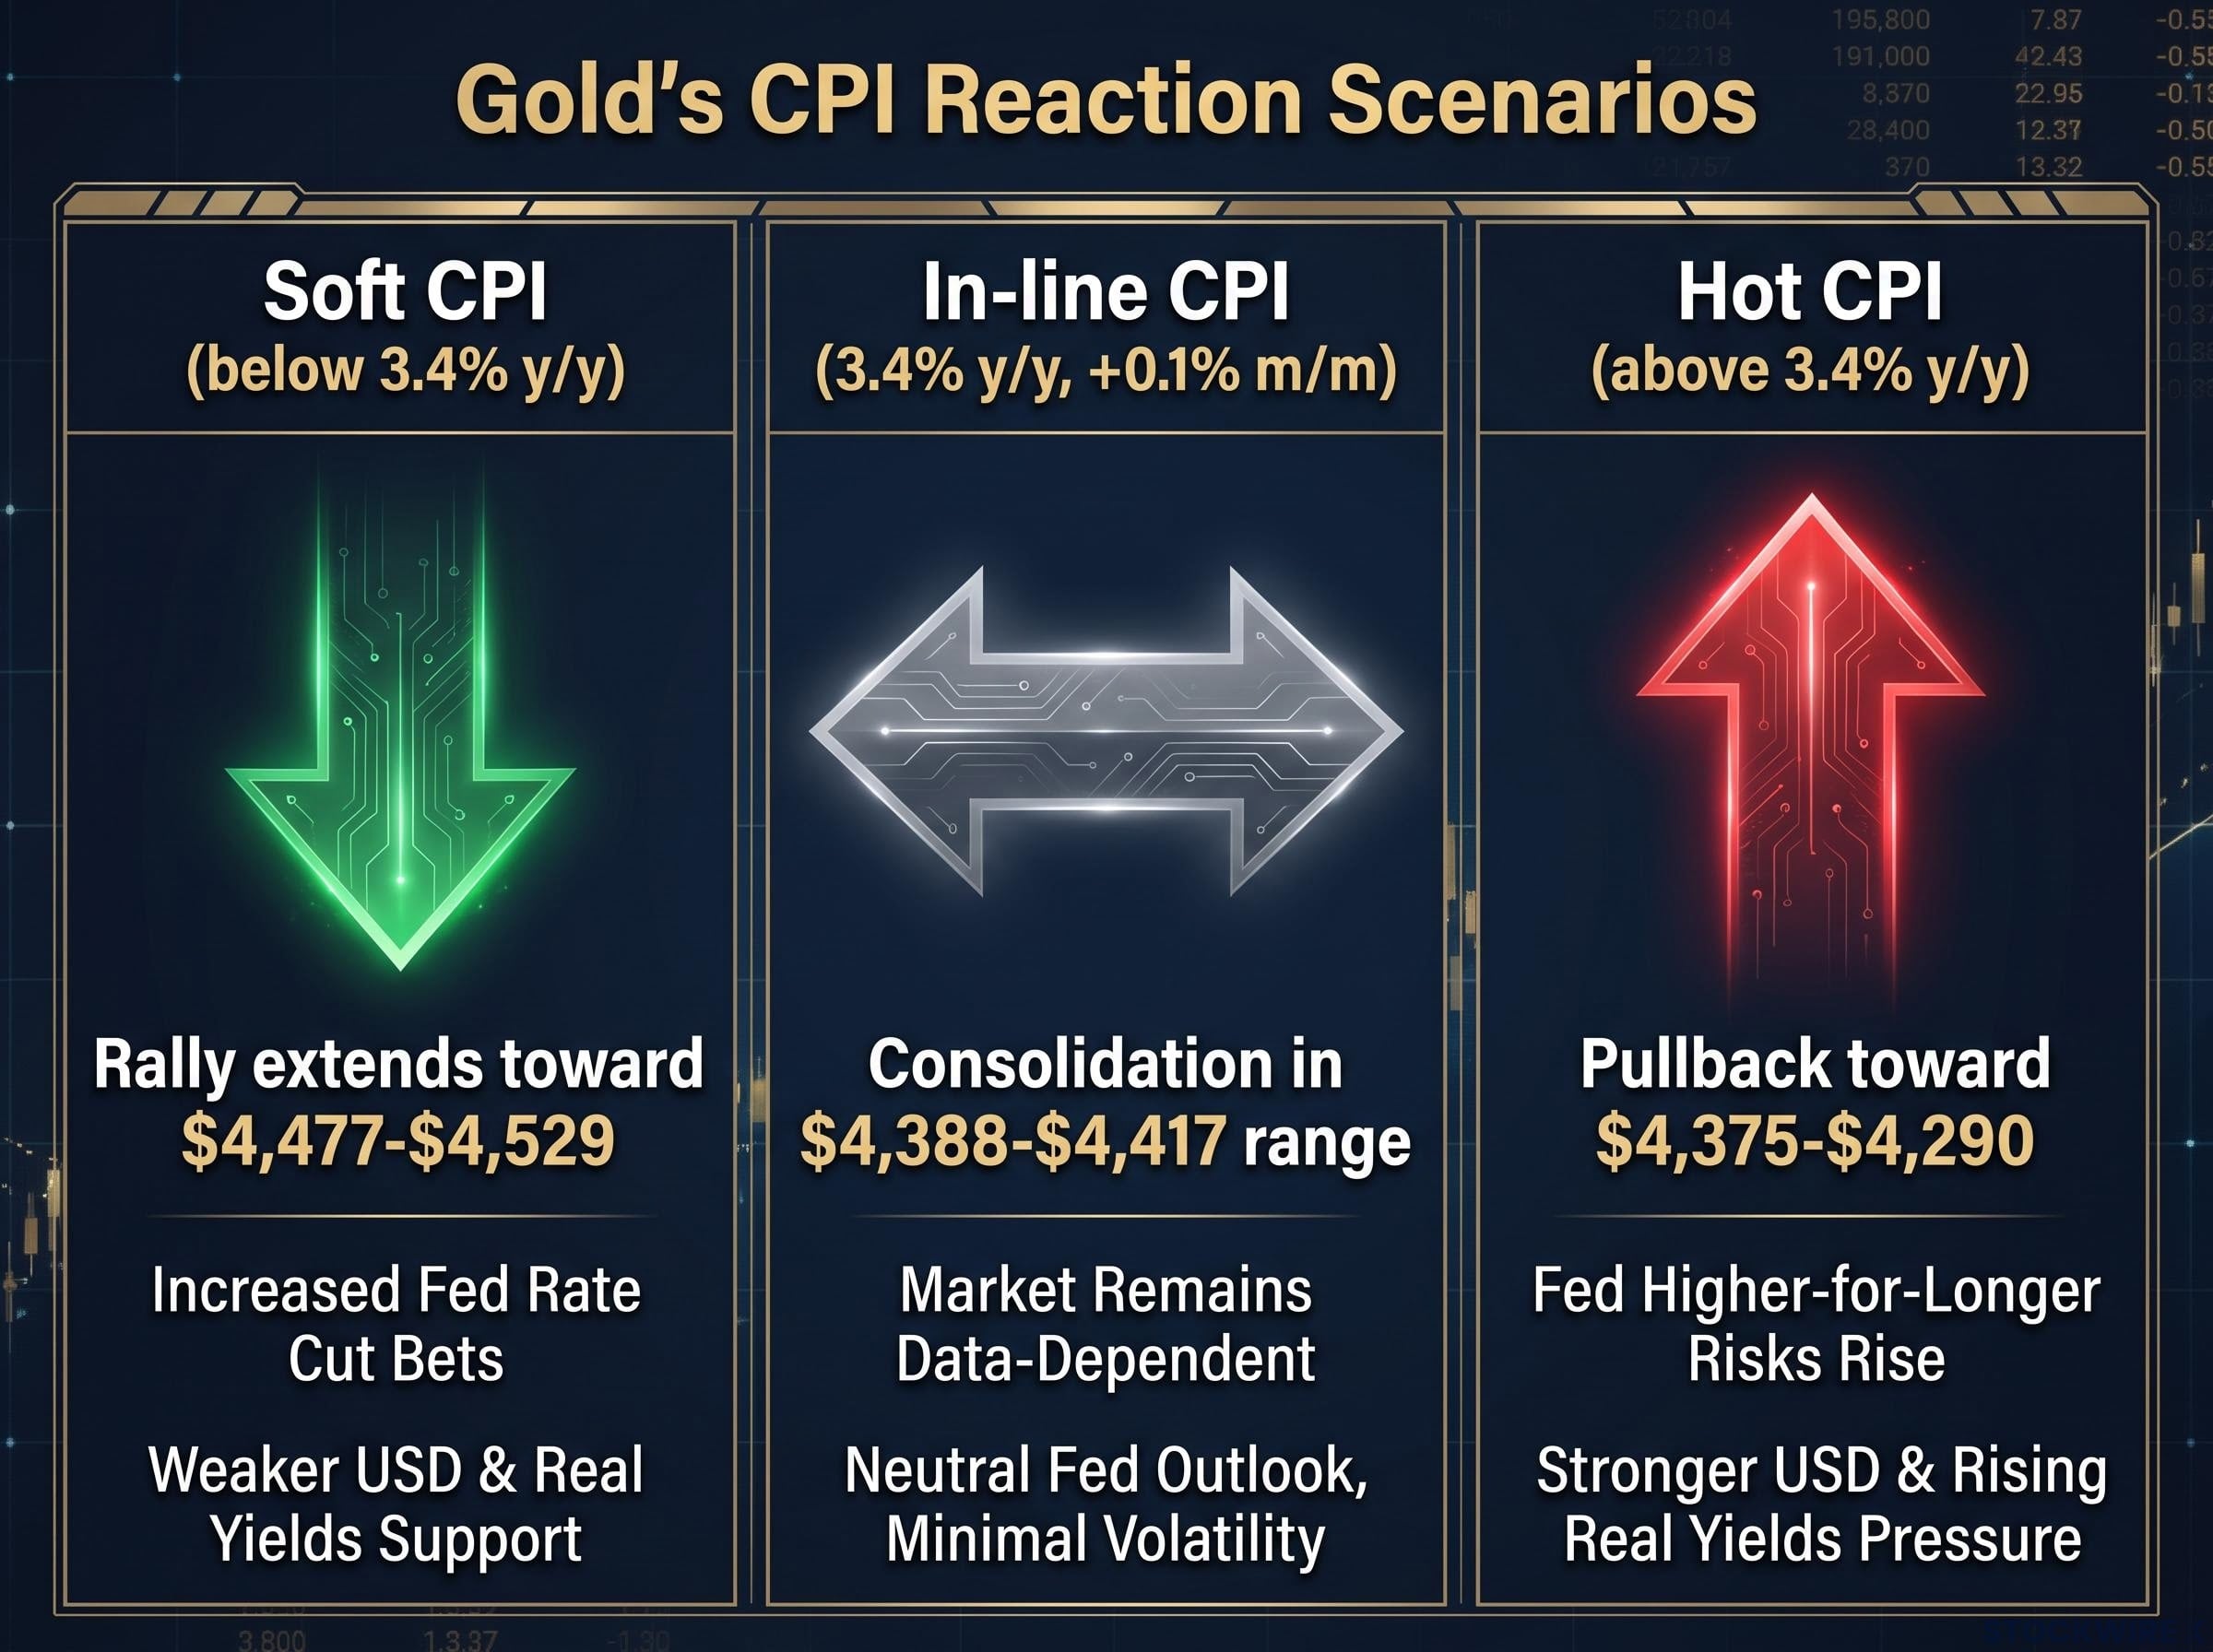
Three scenarios and what each one likely means for gold
| CPI Outcome | Fed Reaction Expected | Dollar Direction | Gold Implication |
|---|---|---|---|
| Soft (below 3.4% y/y) | Increased confidence in September rate cut | Weaker | Rally extends toward $4,477-$4,529 resistance |
| In-line (3.4% y/y, +0.1% m/m) | No material change to expectations | Largely unchanged | Consolidation in $4,388-$4,417 range |
| Hot (above 3.4% y/y) | Rate-cut expectations pushed out | Stronger | Near-term pullback toward $4,375-$4,290; inflation-hedge demand intact |
Soft CPI is the most straightforwardly bullish scenario. Increased rate-cut confidence would weaken the dollar and compress real yields simultaneously. According to Mitrade, a close above $4,417 would open the path to $4,499-$4,529. FXLeaders identifies $4,477 as the first major resistance, with $4,589 and $4,696 as extended targets. The Times of India places next upside objectives at $4,500 and $4,580.
In-line CPI keeps gold in a holding pattern. Without a surprise to trade around, the metal would likely consolidate in the $4,388-$4,417 band as traders wait for subsequent data and Fed communication ahead of the mid-September 2026 policy meeting.
Hot CPI is the scenario that deserves the closest attention, because it is not straightforwardly bearish. In the near term, a stronger dollar and higher real yields would create headwinds, raising the risk of a pullback toward $4,375-$4,290 support. But persistent inflation simultaneously reinforces the fundamental case for holding gold as a hedge. The same print that pushes the Fed to delay cuts also validates the reason central banks and institutional investors bought gold in the first place. A short-term pullback on a hot number is not the same thing as a trend reversal.
The oil-inflation-dollar spiral triggered by US military strikes on Iran in July 2026 demonstrated how geopolitical escalation can work against gold rather than for it, strengthening the dollar and lifting Treasury yields simultaneously, which is the same mechanical sequence a hot CPI print today could replicate.
The technical levels traders are watching
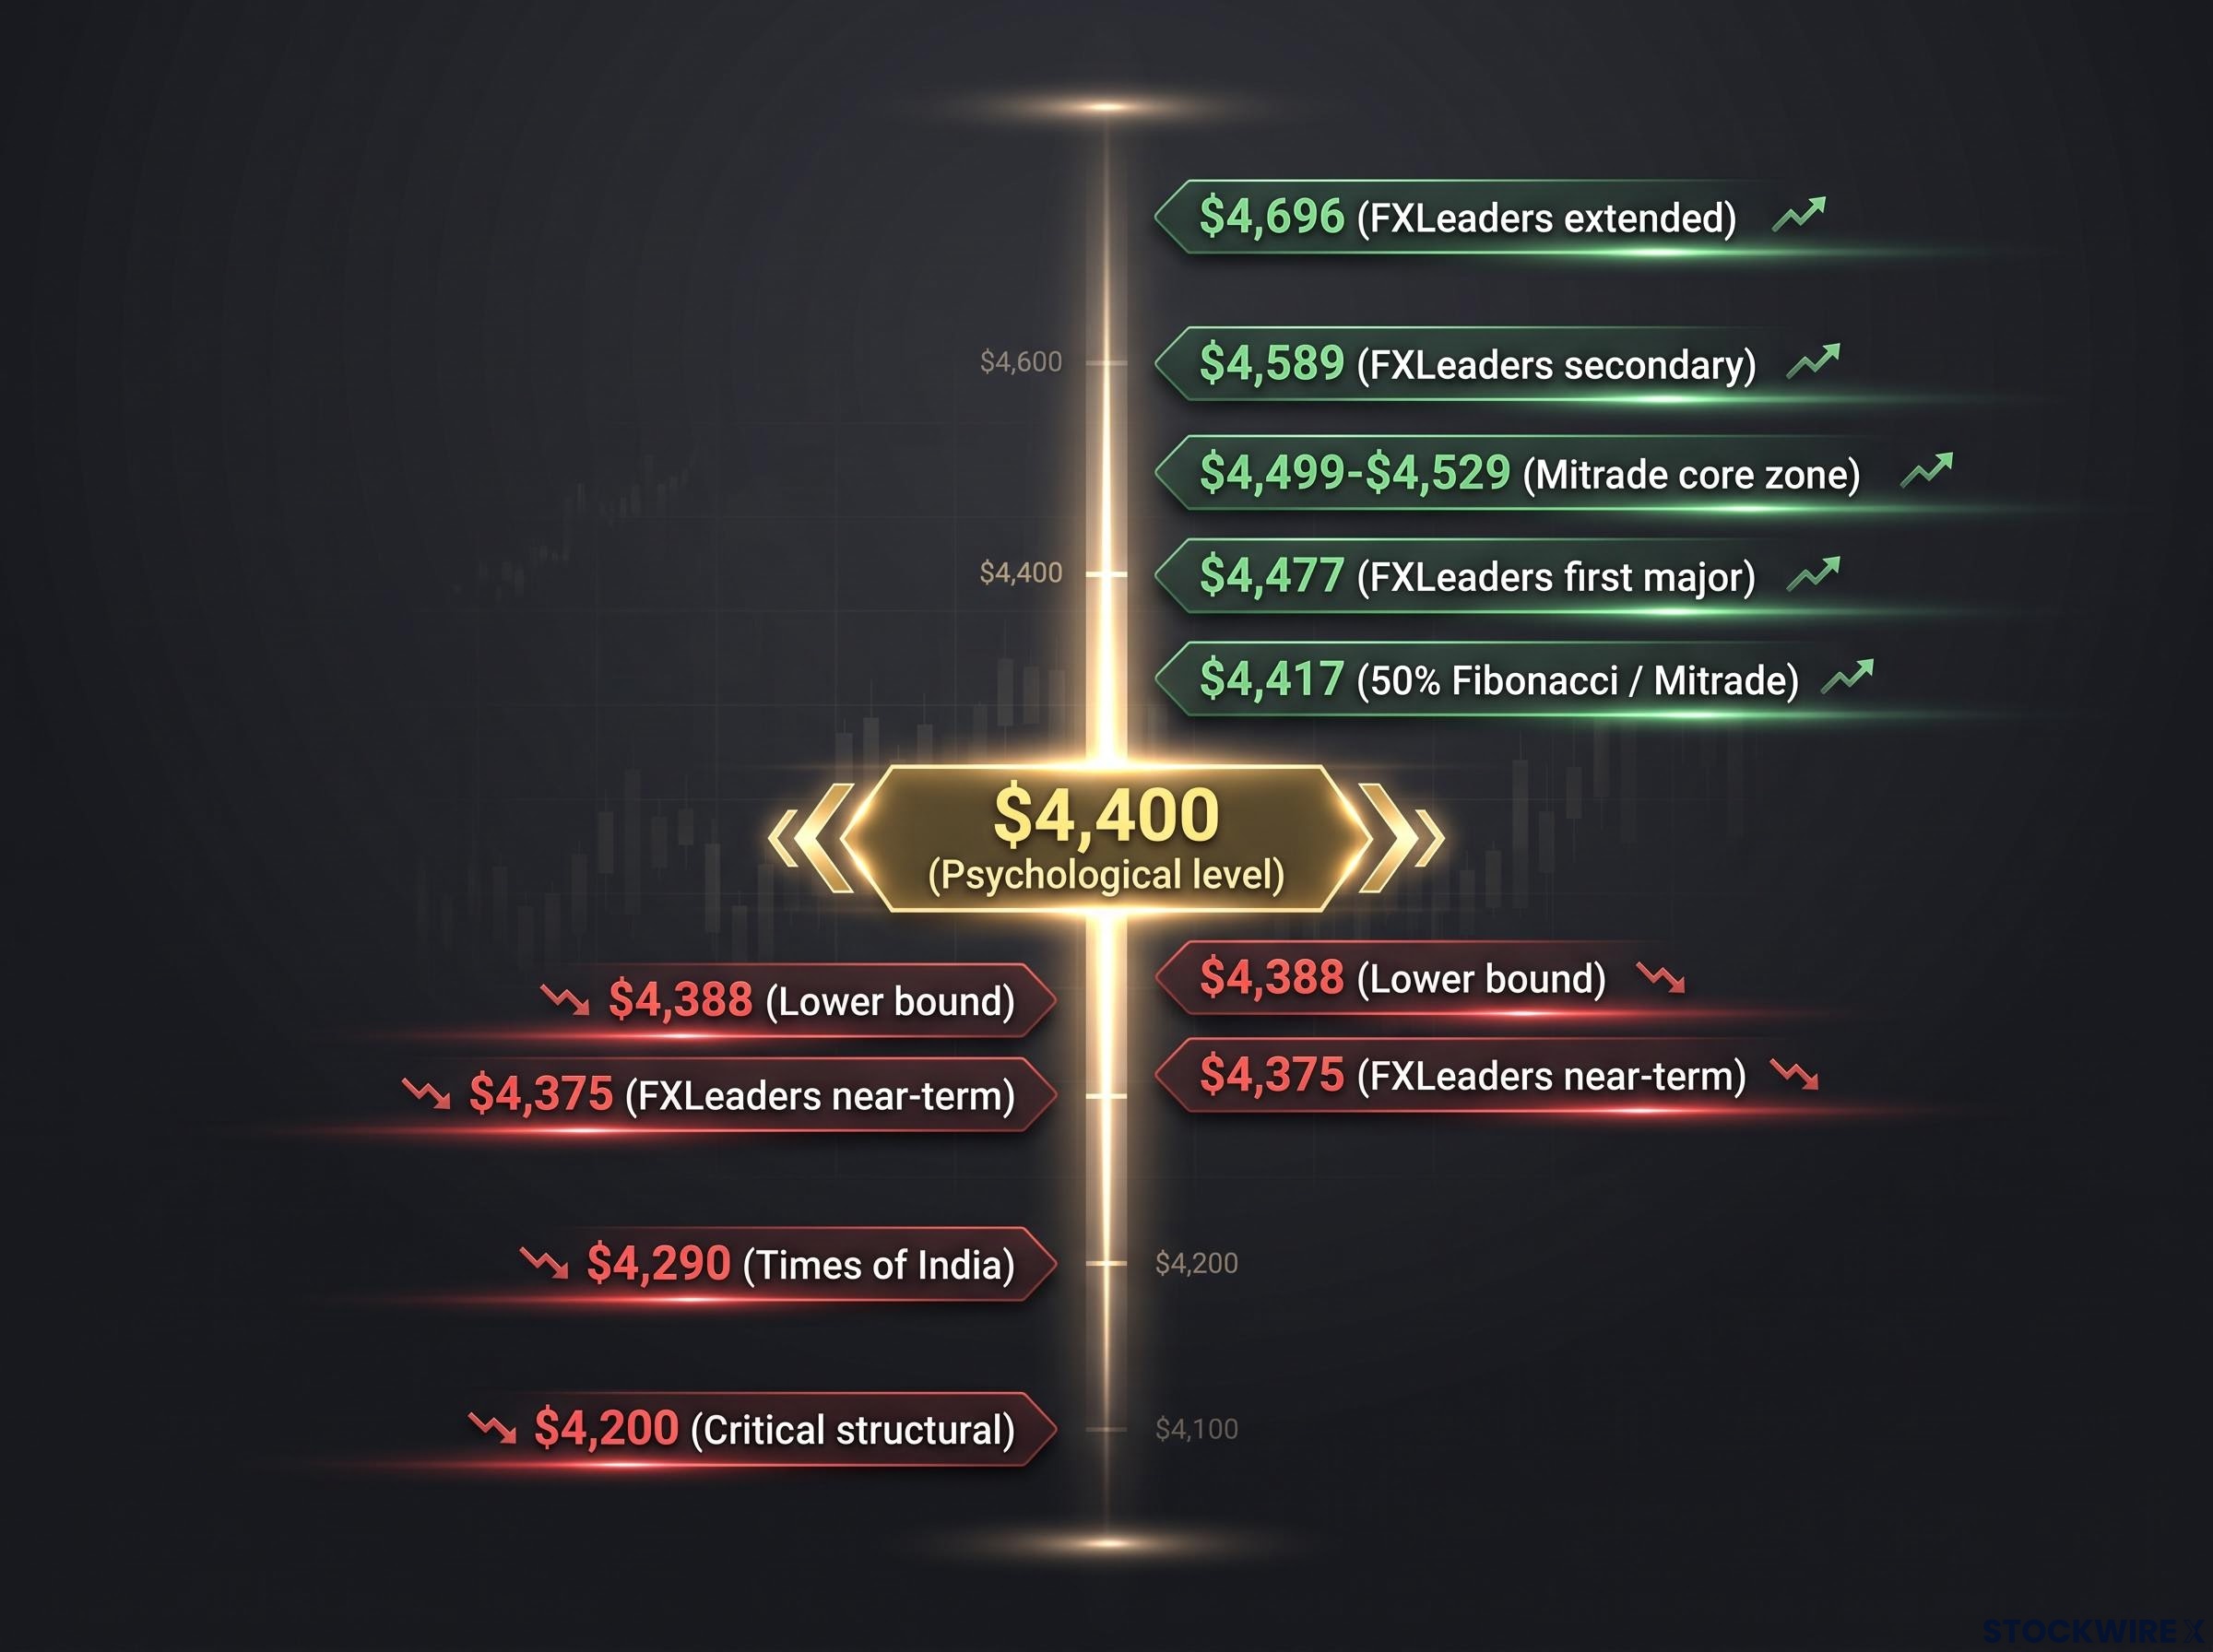
The price map starts at $4,400, the psychological level gold has been orbiting. From there, the levels that matter most sit in two directions.
The near-term decision point: A clean close above $4,417, the 50% Fibonacci retracement level identified by Mitrade, would technically confirm a continuation of the rally. That is the single number to watch as today’s CPI data lands.
| Price Level | Direction | Context or Condition |
|---|---|---|
| $4,696 | Resistance | FXLeaders extended upside target on sustained breakout |
| $4,589 | Resistance | FXLeaders secondary resistance |
| $4,499-$4,529 | Resistance | Mitrade core resistance zone; requires close above $4,417 |
| $4,477 | Resistance | FXLeaders first major resistance level |
| $4,417 | Resistance | 50% Fibonacci level (Mitrade); must close above for upside confirmation |
| $4,400 | Pivot | Psychological level; contested three times in two days |
| $4,388 | Support | Lower bound of current consolidation range |
| $4,375 | Support | FXLeaders near-term support |
| $4,290 | Support | Times of India structural support level |
| $4,200 | Support | Critical structural level; breach would question the broader breakout |
A failure to hold $4,417 on an in-line or hot print would confirm that $4,400 is acting as a ceiling rather than a floor. That distinction matters for anyone trying to read the short-term direction from today’s price action.
Technical exhaustion signals flagged by Bank of America in mid-July 2026, including an RSI of 90 that last appeared at the 1980 and 2011 secular peaks and a death cross in the daily chart, provide the bearish technical framework against which today’s Fibonacci levels should be read.
The structural case that sits beneath the short-term noise
Whatever today’s CPI print delivers, the forces that pushed gold to record territory did not appear overnight, and they will not dissipate on a single data release. Five macro tailwinds continue to provide structural support:
- Weaker US payrolls data signalling a cooling labour market
- A softer dollar environment that has persisted across multiple weeks
- Central-bank buying, with China the most prominent named buyer
- Geopolitical tensions in the Middle East sustaining safe-haven demand
- Crude oil price volatility adding to inflation uncertainty and reinforcing gold’s hedging appeal
ING analyst Chris Turner, cited by FXStreet, noted that thin summer trading conditions are expected to limit the magnitude of any single-session move, even if CPI surprises in either direction.
That liquidity caveat is worth keeping in mind. A sharp reaction on the headline number may not carry through in the way it would during a higher-volume period. The September 2026 Fed policy meeting remains the next genuine scheduled catalyst, and the accumulation of data between now and then will shape the trajectory more than any one print.
For anyone with gold exposure, the practical read is that a CPI-driven pullback toward support levels would likely represent consolidation within a broader uptrend rather than a signal to exit, provided the $4,200 structural level holds.
What today’s CPI print changes, and what it does not
Today’s number resolves a short-term binary. A soft print likely extends the rally toward $4,477-$4,529. A hot print raises pullback risk toward $4,375-$4,290 support. Neither outcome changes the structural backdrop that got gold here: central-bank demand, a weakening growth trajectory, and geopolitical risk that all pre-existed this morning’s release.
Three things to watch as the data lands and the session unfolds:
- The CPI print itself: whether annual inflation comes in above, below, or at the 3.4% consensus
- The $4,417 close condition: whether gold finishes the session above this Fibonacci level, which Mitrade identifies as the threshold for confirming directional bias
- The $4,200 structural support level: a breach here, if it came, would signal something more meaningful than a data-driven pullback
Today’s print will move the price. It will not resolve the longer-run question of whether gold at these levels reflects a structural repricing or a crowded trade. That question will only be answered by the accumulation of data between now and September.
For investors wanting to place today’s CPI reaction in the context of the full-year institutional forecast range, our deep-dive into gold price targets for H2 2026 maps the Federal Reserve’s October decision as the single most important near-term catalyst and examines where major institutions see the metal heading under one-hike versus multi-hike scenarios.
This article is for informational purposes only and should not be considered financial advice. Investors should conduct their own research and consult with financial professionals before making investment decisions. Past performance does not guarantee future results. Financial projections are subject to market conditions and various risk factors.