
EUR/USD is sitting at 1.153 on the morning of the July US CPI release, and the pair has barely moved despite a string of positive Eurozone data surprises. That disconnect is the story.
The euro is not weak because European fundamentals are bad. It is range-bound because two structural headwinds are actively discounting the good news: European natural gas prices above EUR 60 per megawatt-hour, and unresolved Gulf geopolitical tensions that push traders toward dollar safety. Against that backdrop, today’s CPI print, the Jackson Hole symposium (27-29 August), and the September FOMC meeting with its Summary of Economic Projections (SEP) form a three-stage sequence that will determine whether the pair breaks out of its 1.13-1.16 holding pattern or rotates back toward the lower band.
Here is the framework for interpreting what each CPI scenario means for the immediate price structure, how the Fed sequencing shapes the medium-term outlook, and what level of catalyst alignment it would actually take to shift EUR/USD into a new directional phase.
Why positive Eurozone data is not lifting the euro
A run of stronger Eurozone hard activity readings and broader economic data beats has failed to generate any meaningful euro appreciation. EUR/USD consolidated around 1.1550 during European trading hours this week, with last week’s high at 1.1580 acting as a ceiling that buyers have not been able to punch through. On any other read of the fundamentals, those upside surprises would have translated into meaningful appreciation.
They have not, because two structural forces are discounting every positive headline before it can move the pair.
Gulf tensions and ECB policy are operationally linked through the oil-inflation-monetary policy transmission chain: Brent above $90 per barrel following the collapse of a June 2026 ceasefire feeds directly into Eurozone inflation running at approximately 3%, a full percentage point above the ECB’s target, and keeps the central bank’s room to manoeuvre constrained in a way that pure activity data cannot offset.
- European natural gas prices above EUR 60 per megawatt-hour. Elevated energy costs sustain inflation pressure across the euro area, weigh on real incomes and competitiveness, and keep ECB policy uncertainty elevated. Until gas prices moderate, positive activity data coexists with a cost structure that limits the ECB’s room to manoeuvre.
- Gulf geopolitical uncertainty. Recent reports indicate that Pakistan and Oman have been working to bring US and Iranian positions somewhat closer, but no resolution has been reached. In periods of energy-supply risk, markets reward the dollar’s safe-haven properties and penalise currencies more exposed to import costs.
EUR 60/MWh: The current approximate floor for European natural gas prices, partially linked to unresolved Gulf tensions. This is the headwind benchmark traders are watching for signs of moderation.
What this tells you is that Eurozone data surprises are being treated as necessary but not sufficient conditions for euro appreciation. Until energy and geopolitical headwinds ease, positive prints will produce range bounces rather than breakouts, and positioning for a sustained euro rally on data strength alone is the most common error in this environment.
When big ASX news breaks, our subscribers know first
The technical map: where EUR/USD sits and what it would take to move
The pair is sitting inside a well-defined consolidation range of approximately 1.1340-1.1560, with a centre of gravity near 1.1550. Spot is at roughly 1.153-1.154 as of this morning. That is a balanced environment: buyers are cautious, sellers are reluctant to press, and neither side has generated enough momentum to force a directional break.
The resistance cluster at 1.1535-1.1570 is the first wall, and last week’s high at 1.1580 is the near-term ceiling. On the downside, 1.1390-1.1400 is the first support level, with 1.1340-1.1370 representing secondary support where a break below would tilt the balance toward dollar strength.
A clean break above the mid-1.15s is the structural threshold that would shift short-term bias toward the euro. Without that, the pair stays range-bound.
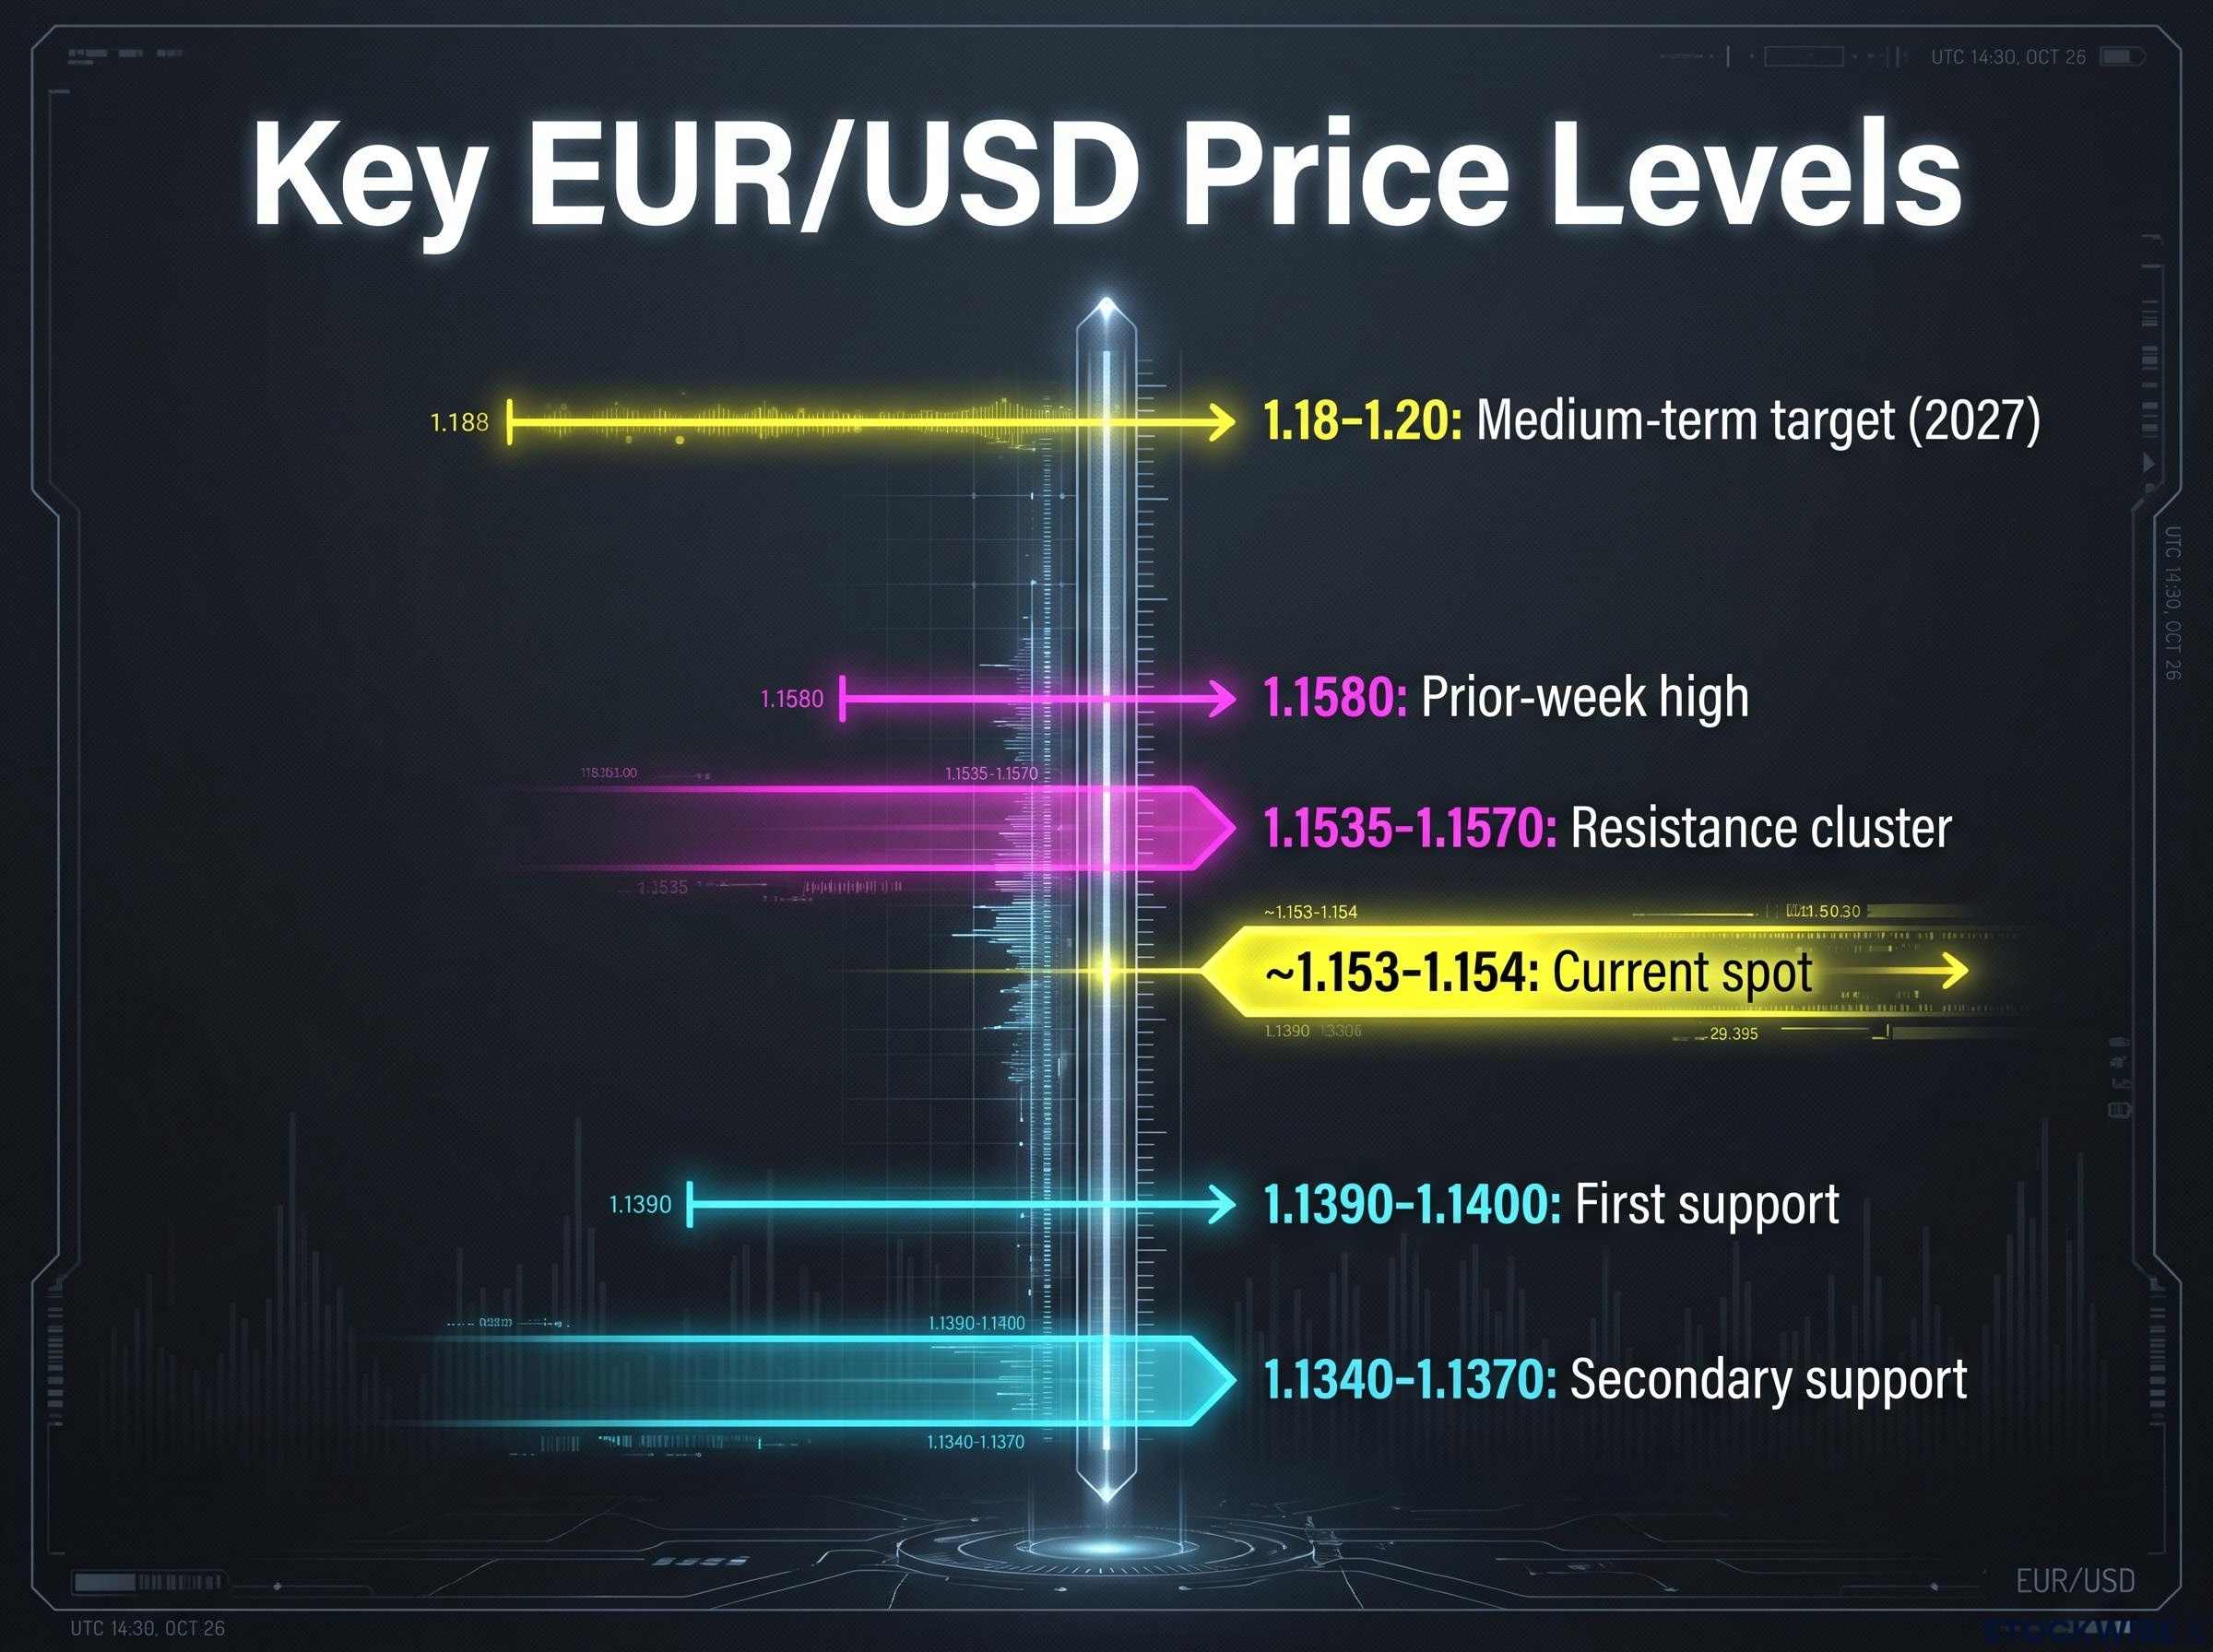
Key EUR/USD price levels at a glance
| Level | Price | Role |
|---|---|---|
| Secondary support | 1.1340-1.1370 | Break below tilts balance to dollar strength |
| First support | 1.1390-1.1400 | Initial downside target on hot CPI |
| Current spot | ~1.153-1.154 | As of 12 August 2026 |
| Resistance cluster | 1.1535-1.1570 | Near-term ceiling; centre of gravity |
| Prior-week high | 1.1580 | Options-implied cap under soft CPI scenario |
| Medium-term target | 1.18-1.20 | Institutional consensus range by 2027 |
The tight gap between current spot and the resistance cluster is the immediate takeaway for positioning. There is limited reward available from a long entry at current levels without a catalyst-driven break, and that asymmetry should inform how you size any pre-CPI position.
What the CPI print could actually do to EUR/USD today
Today marks the release of the July CPI report from the US Bureau of Labor Statistics, and it is the immediate fork in the road. According to ING analyst Chris Turner, market consensus points to a monthly gain of +0.1% (following June’s -0.4% decline) and an annual rate retreating to 3.4% from the prior month’s 3.5%.
Two scenarios branch from that baseline, and the asymmetry between them is the point.
The CPI surprise asymmetry that institutional desks exploit is more nuanced than a simple hot-or-cool binary: when the Fed funds rate sits above the neutral rate, soft prints carry larger USD downside potential than equivalent hot prints carry upside, a structural skew that shapes how professional positioning differs from retail reaction on every release day.
Soft CPI (at or below forecast). Under a soft or in-line outcome, EUR/USD would likely test last week’s high at 1.1580, which represents roughly the full extent of the move priced into one-day straddle options, consistent with the technical ceiling.
1.1580: The options-implied ceiling under a soft CPI scenario. Even a favourable print is unlikely to drive a sustained break beyond this level given thin summer liquidity.
But even a friendly number does not change the structural picture overnight. Without relief on energy and geopolitical fronts, a soft print produces a range extension rather than the start of a new trend. Thin August volumes compress follow-through, and mean-reversion bias argues against chasing the initial move.
Hot CPI (above forecast). An upside surprise reinforces the case for the Fed to maintain restrictive policy at 3.50-3.75% for longer. EUR/USD rotates back toward 1.1390-1.1400 and potentially 1.1340. The downside is structurally more vulnerable because the euro lacks strong near-term supports beyond data resilience, whereas a hawkish repricing of Fed expectations is a well-tested bearish driver for the pair.
| CPI Scenario | EUR/USD Likely Move | Key Level Reached | Durability Assessment |
|---|---|---|---|
| Soft (at or below +0.1% m/m) | Modest uptick toward resistance | 1.1535-1.1580 | Low; thin liquidity favours fade |
| Hot (above +0.1% m/m) | Rotation toward support | 1.1390-1.1340 | Moderate; reinforces Fed hold narrative |
The asymmetry is the key takeaway. A soft print delivers a range extension toward levels the pair has already tested. A hot print opens territory it has not visited recently. That skew matters when deciding whether to position ahead of the release or wait for confirmation.
The three-stage Fed sequencing framework traders are watching
CPI alone is not sufficient to drive a sustained EUR/USD breakout. The reason professional FX desks are not making large directional bets right now is that today’s print is only the first of three gates that must clear in sequence for the pair to break out of its holding pattern.
At the July 29 FOMC meeting, the committee held rates at 3.50-3.75% on a 9-3 vote, issuing a statement that differed from the June version only in minor language and the naming of three dissenters. That outcome offered no new directional catalyst, leaving the pair anchored to the middle of the range ahead of today’s data.
The July 29 FOMC statement confirmed the committee held rates at 3.50-3.75% on a 9-3 vote, with language changes so minor relative to the June version that the decision provided no new directional catalyst for EUR/USD positioning.
What comes next is where the directional resolution lives. Jackson Hole (27-29 August) is the signalling event, and the September FOMC with its Summary of Economic Projections (15-16 September) is the policy confirmation or rejection point. Additional rounds of CPI and employment data land between now and that decision, adding further layers of uncertainty to any directional bet placed today.
For investors wanting to understand how the Fed’s structural architecture could amplify the market impact of each remaining 2026 decision, our full explainer on FOMC meeting frequency reform examines how a reduction from eight to six annual meetings would concentrate rate positioning into fewer, higher-stakes windows and elevate the signal value of each CPI and payrolls release between sessions.

Catalyst sequencing at a glance
| Stage | Event | Date | Dovish Outcome (EUR/USD) | Hawkish Outcome (EUR/USD) |
|---|---|---|---|---|
| 1 | July CPI release | 12 August 2026 | Range extension toward 1.1580 | Rotation toward 1.1390-1.1340 |
| 2 | Jackson Hole Symposium | 27-29 August 2026 | Validates easing; tests 1.16+ | Reinforces dollar; pins pair to lower half |
| 3 | September FOMC (with SEP) | 15-16 September 2026 | Cut or dovish guidance supports 1.18-1.20 path | Hawkish hold pushes appreciation timeline out |
For medium-term positioning, the framework reveals that a single soft CPI print does not justify a large long EUR/USD position. The pair needs gate-clearing outcomes at all three stages. Each gate that fails resets the expected timeline for appreciation.
What “break above 1.1580” actually requires
A sustained move above 1.1580 and toward 1.16+ is not a single-catalyst event. It requires alignment across multiple fronts simultaneously.
Conditions required for breakout above 1.1580:
- Soft or in-line CPI that keeps the door open to Fed easing
- Dovish or data-dependent Fed rhetoric at Jackson Hole
- A September FOMC outcome that either delivers a cut or clearly sets up a near-term easing path
- Moderation in euro-specific headwinds: natural gas prices falling below EUR 60/MWh and/or a Gulf diplomatic resolution reducing the energy-risk premium
Conditions that would push EUR/USD toward 1.1340:
- Upside CPI surprise that materially strengthens the case for a prolonged Fed hold
- Hawkish Jackson Hole messaging emphasising residual inflation risk
- September hold with restrictive language, reinforcing higher-for-longer US real yields
- Continued euro-specific headwinds from elevated energy costs and unresolved geopolitical tensions
Thin August liquidity adds a seasonal overlay to both scenarios. Mean-reversion bias in low-volume markets means that even significant data surprises tend to produce smaller and less durable moves than the same print would generate in September or October. That structural volatility suppressor is active in both directions.
The dollar’s 2026 valuation premium is itself a structural headwind for EUR/USD: Morningstar’s model estimates the DXY is approximately 15% overvalued as of mid-2026, meaning the rate-differential pillar supporting dollar strength requires the Fed hold narrative to stay intact indefinitely, and any pivot signal from Jackson Hole or the September SEP would compress that premium faster than spot pricing currently reflects.
1.18-1.20 by 2027: The medium-term institutional consensus target, contingent on a narrowing US-Eurozone rate differential as the Fed eventually moves into an easing cycle. This remains the base case for most bank forecasts, but the timeline depends entirely on how the three-stage sequencing resolves.
Even traders who are directionally correct on today’s CPI will likely see their initial move capped or faded unless the subsequent Fed gates also clear. Position sizing and catalyst-by-catalyst reassessment matter more than the initial entry call.
What traders should take from today’s data and where the pair goes from here
Today’s CPI print is the first gate in a three-stage process, not a standalone breakout signal. Its impact on EUR/USD should be interpreted within the established 1.13-1.16 technical range, not as a catalyst powerful enough to break the pair out of it.
The structural picture is clear. Positive Eurozone fundamentals are real but discounted by energy and geopolitical headwinds that show no sign of imminent resolution. The consolidation range reflects a genuine holding pattern, not a structural ceiling. And the medium-term institutional consensus toward 1.18-1.20 by 2027 remains intact, contingent on the rate-differential narrowing thesis that the next five weeks will either validate or delay.
The sequence that will progressively resolve this uncertainty is concrete: CPI today, Jackson Hole in two weeks, September FOMC in five weeks. Sizing positions to reflect that timeline, rather than reacting to a single print, is the difference between disciplined trading and reactive positioning.
This article is for informational purposes only and should not be considered financial advice. Investors should conduct their own research and consult with financial professionals before making investment decisions. These statements are speculative and subject to change based on market developments and policy outcomes. Past performance does not guarantee future results.
—