AI Stocks Split in Two as CoreWeave Falls 14% and Meta Surges 9%
2 hrs ago

The April 2026 nonfarm payroll report arrived on 2 May with a number that looked strong on the surface: 115,000 new jobs, roughly double what most forecasters expected. But the story underneath that headline is considerably more complicated.
Released by the Bureau of Labor Statistics (BLS), the report landed at a moment when markets, the Federal Reserve, and households are all trying to read the same signals about where the US economy is heading amid tariff-driven uncertainty and a cooling hiring trend. The headline beat sparked an S&P 500 rally to an intraday all-time high, only for gains to pare by session end as the underlying data drew closer scrutiny.
What follows separates the signal from the noise: which sectors drove the gains, what the underlying figures reveal about labour market momentum, why employment data is structurally late-arriving evidence rather than forward guidance, and what the report means for the Fed’s rate path in the second half of 2026.
The beat was genuine. At 115,000 new payrolls, the April print came in well above both the Dow Jones consensus of roughly 55,000 and the FactSet median of 65,000. Private-sector employment alone added 123,000 positions, more than double the 59,000 economists had projected.
The key headline metrics tell part of the story:
Zillow Research, in its 3 May 2026 analysis, characterised the labour market as “stabilising, not accelerating.”
A single month is noisy. The BLS’s own preferred smoothing window, the three-month average, tells a different story entirely.
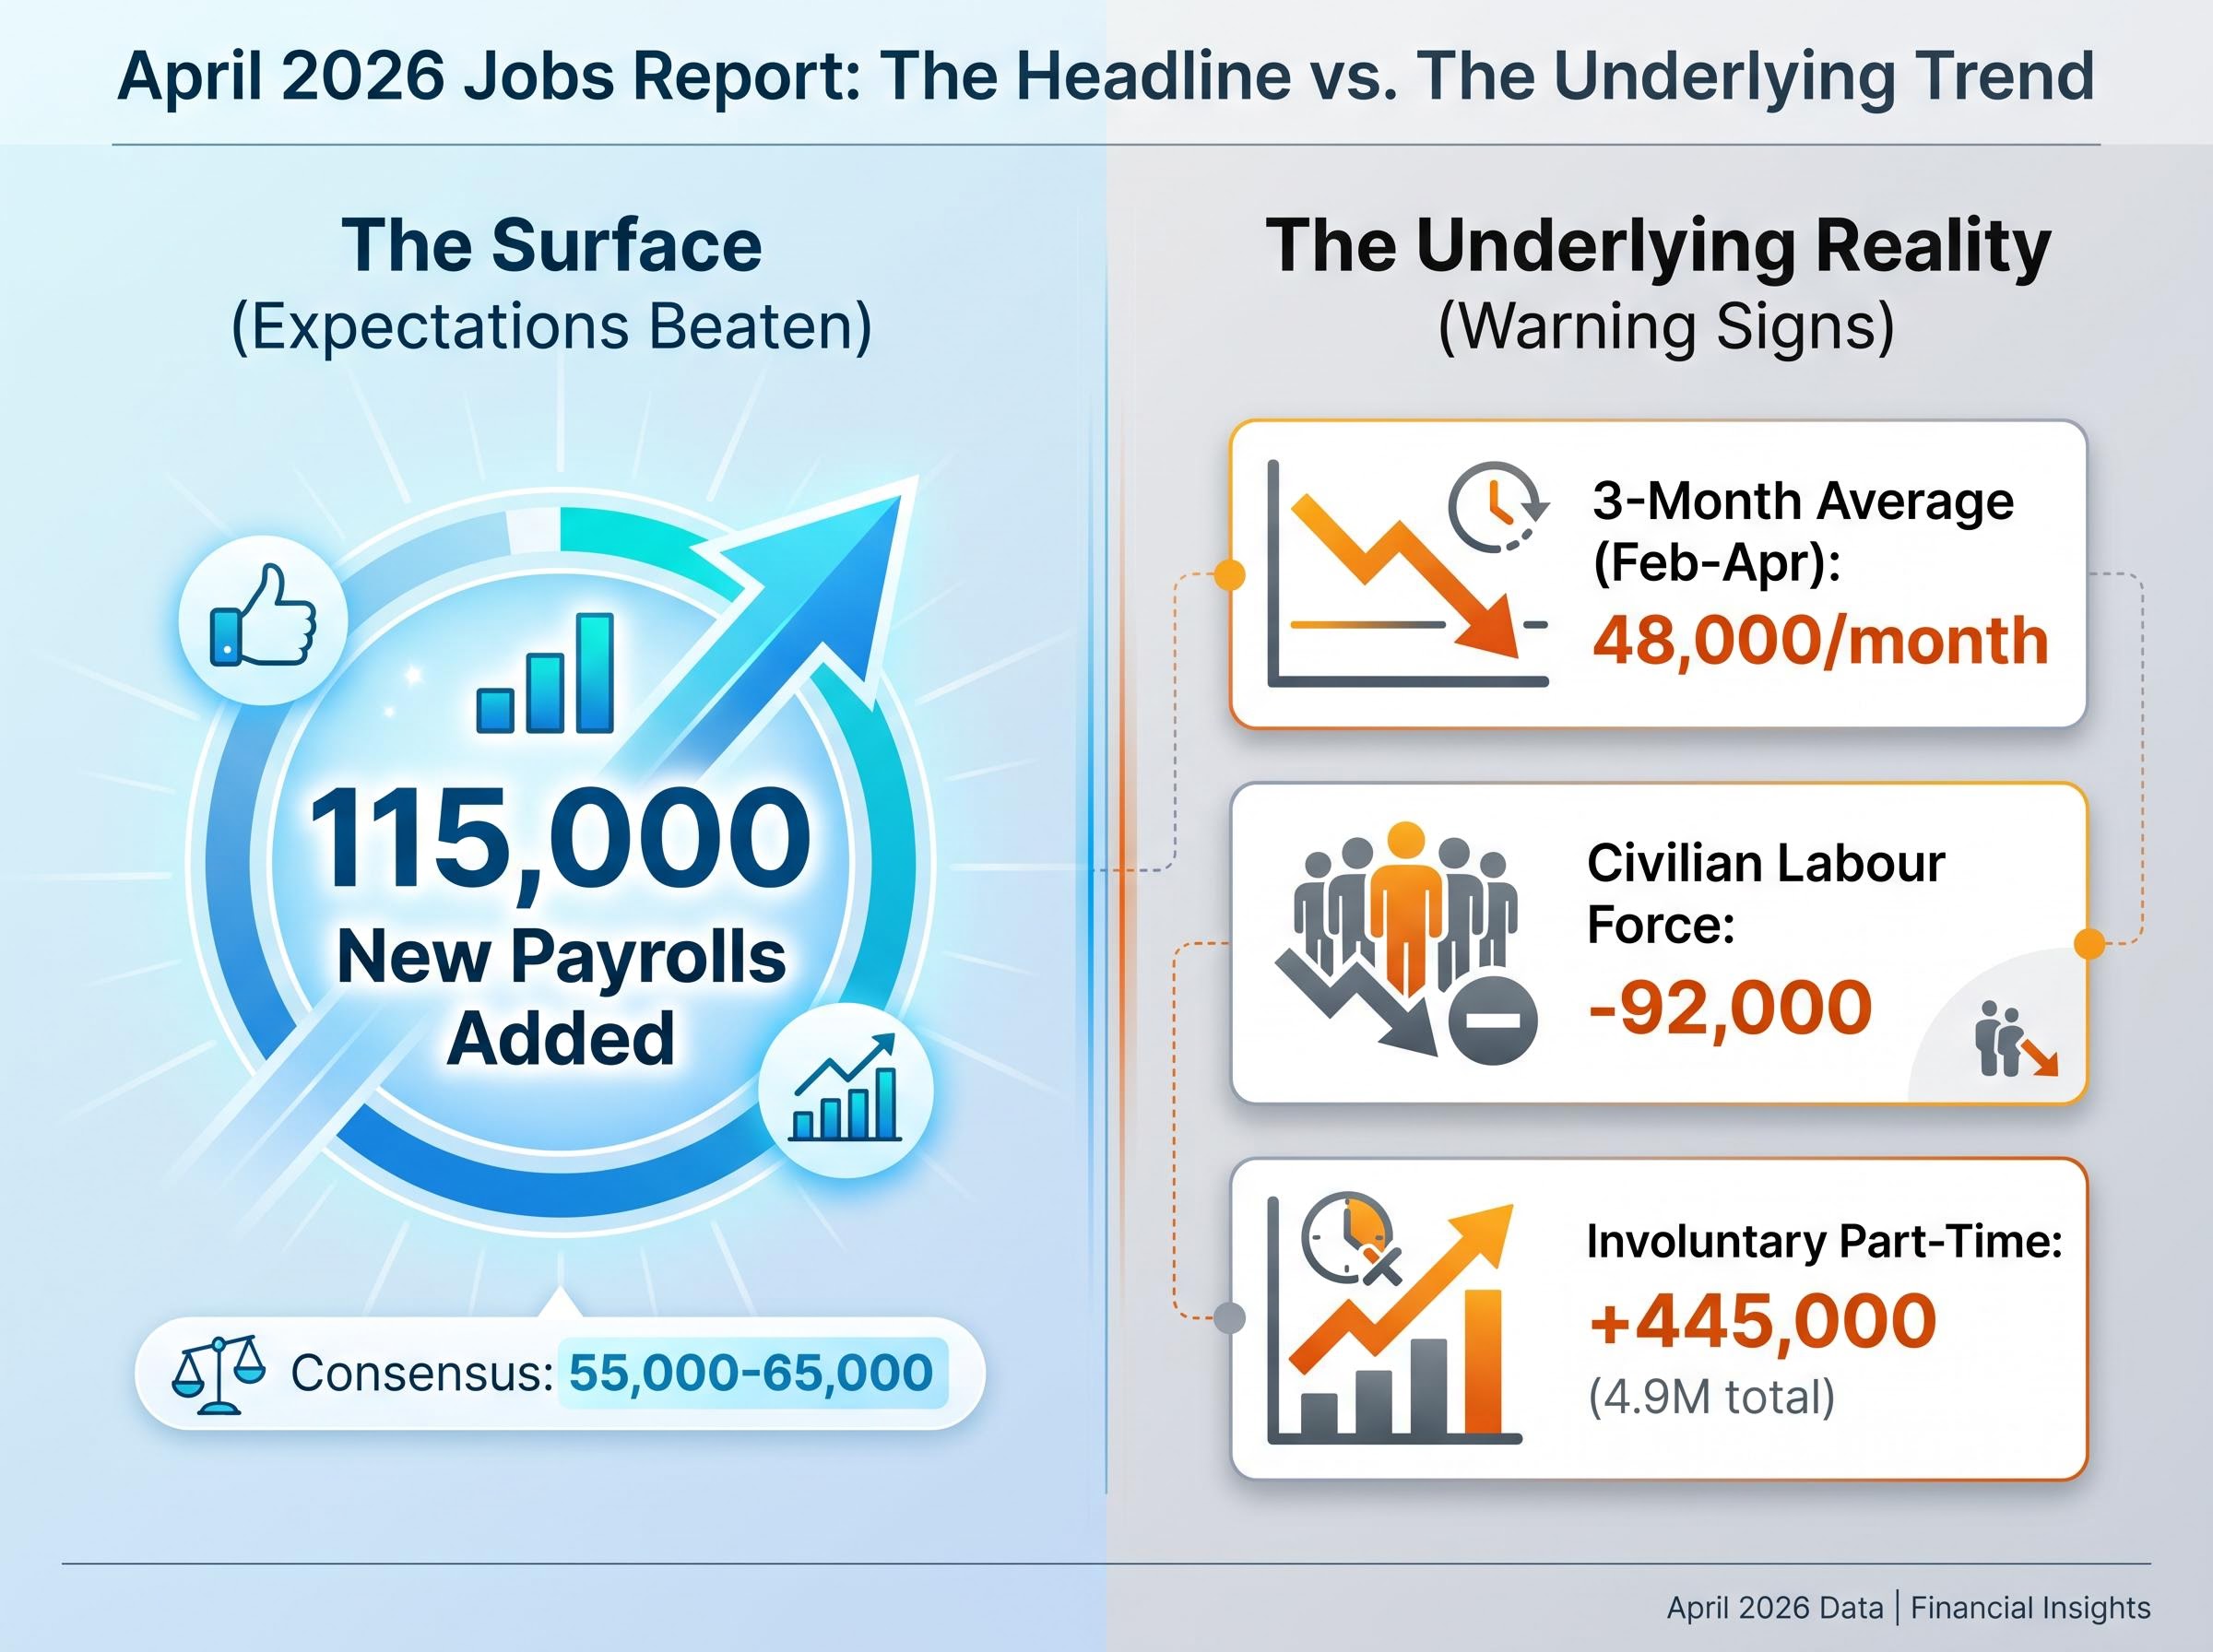
Over February to April, payroll growth averaged just 48,000 per month. At that pace, the economy is barely absorbing new labour force entrants. Zillow projects that if the three-month average holds near 50,000 per month through mid-2026, the unemployment rate would edge toward 4.5% by Q4.
The household survey deepens the concern. The civilian labour force shrank by 92,000, while the number of people not in the labour force rose by 188,000. Verified Investing flagged what it described as 803,000 in “fresh distress” signals from that same household data. These are not figures that typically accompany a healthy hiring environment.
For readers wanting context on why the 115,000 print caught most forecasters off-guard, our dedicated guide to April payrolls expectations walks through the pre-release consensus of 62,000-70,000, the methodology behind the three-month trend anchor the Fed actually uses, and why BLS revisions frequently render first-print reactions an unreliable basis for investment decisions.
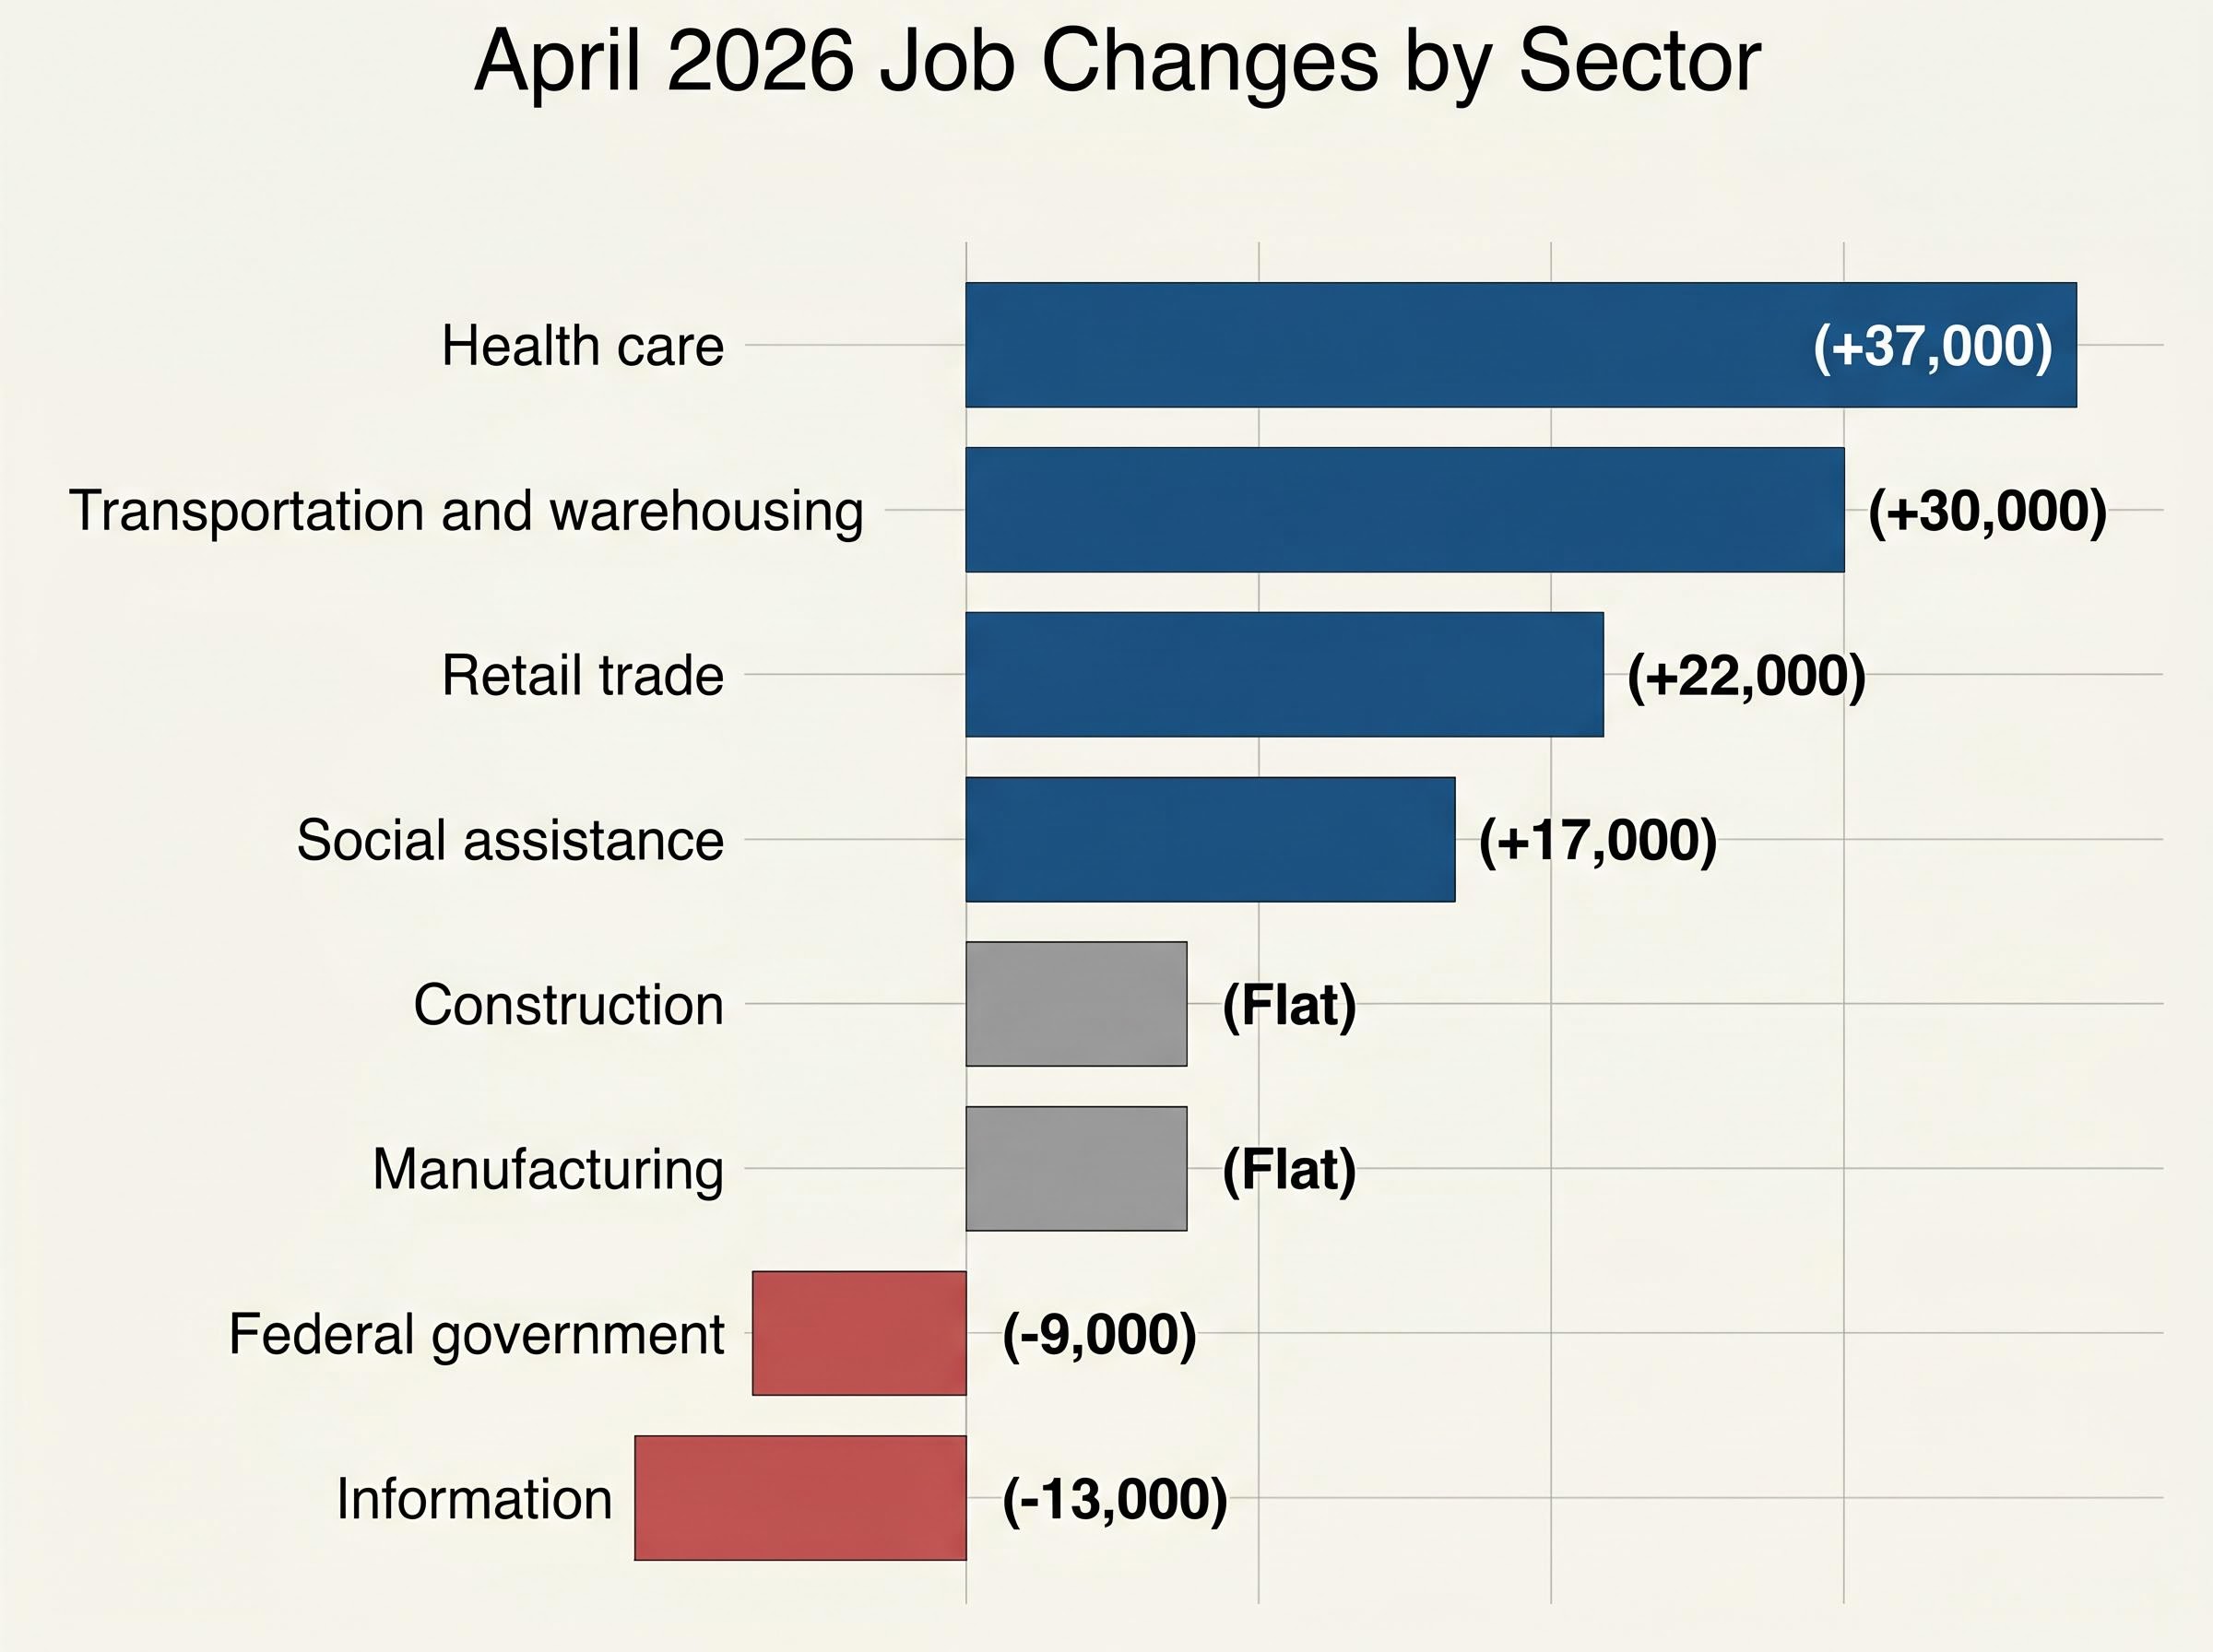
The sector breakdown reads as a tale of two economies operating simultaneously. On one side, domestic consumer-services industries absorbed demand. On the other, the goods-producing sector went quiet.
| Sector | April Change |
|---|---|
| Health care | +37,000 |
| Transportation and warehousing | +30,000 |
| Retail trade | +22,000 |
| Social assistance | +17,000 |
| Construction | Flat |
| Manufacturing | Flat |
| Federal government | -9,000 |
| Information | -13,000 |
Healthcare, transportation, and retail, all domestic consumer-facing categories, carried the entire report. Construction and manufacturing added nothing. Federal government shed 9,000 positions. Information lost 13,000.
This is not a one-month anomaly. The ISM Manufacturing Employment Index stood at 46.4 in April, marking a sixth consecutive month in contraction territory (any reading below 50 signals shrinking activity). The goods sector has effectively stalled.
Tariff impacts on manufacturing hiring do not arrive overnight. They transmit through order books, capacity planning, and supplier renegotiations, a chain that typically unfolds over quarters rather than weeks. The flat construction and manufacturing prints in April likely reflect decisions made in Q1 2026, when tariff uncertainty intensified following the administration’s January expansions.
The Bank of America Institute acknowledged this dynamic in its 5 May analysis, calling overall payroll growth “solid” based on internal deposit data showing 1.9% year-over-year growth, while simultaneously flagging small-business weakness as a tariff-adjacent vulnerability.
The tariff authority legal landscape shifted materially in the weeks surrounding the April report, with two federal courts striking down the broadest statutory pillars of executive tariff power; the resulting migration of trade risk from a binary executive shock model to an extended legislative uncertainty model changes the timeline over which goods-sector hiring decisions are likely to be made.
The instinct for most readers is to treat a strong jobs report as evidence that the economy is accelerating. The mechanics of hiring suggest otherwise.
Employment data is classified as a “late-lagging” indicator in standard business cycle frameworks. The reason is structural: businesses hire after demand has proven durable, not in anticipation of it. The sequence runs in a specific order:
By the time a payroll figure reaches a headline, the economic conditions that produced it are already months old.
According to Fisher Investments, equity markets discount economic conditions “approximately 3 to 30 months ahead of the present.”
This forward-looking window explains why the S&P 500 hitting an all-time high on 2 May was not driven by the jobs number causing fresh optimism. The market had already priced the conditions the report confirmed. The index gained approximately 0.8-0.9% intraday before paring through the session as investors absorbed the weaker details.
Equities have continued reaching record highs across multiple rate regimes from October 2022 through May 2026, with the federal funds target rate unchanged since December 2025. The jobs report confirmed where the economy had been; it did not tell markets where it is going.
If employment data is a rear-view mirror, the leading indicators are the dashboard. And the dashboard is flashing caution.
| Indicator | Actual Figure | Release Date | Forward Implication |
|---|---|---|---|
| ISM Services Employment | 48.0 | 3 May (April data) | Services hiring contracting; removes prior offset to goods weakness |
| ISM Manufacturing Employment | 46.4 | 1 May (April data) | Sixth consecutive month of contraction; goods-sector hiring stalled |
| JOLTS Job Openings | 6.866 million | 7 May (March data) | Labour demand declining gradually from recent highs |
| Initial Jobless Claims | 200,000 | Week ending 2 May | No surge in layoffs; gradual softening only |
| Conference Board Consumer Confidence | 92.8 | April release | Households cautious on labour and income outlook |
The most concerning signal in the table is the ISM Services Employment index at 48.0. Services had been the labour market’s primary buffer against goods-sector weakness. Its slip below 50 removes that offset. Both sides of the economy are now showing employment contraction in the ISM readings simultaneously.
JOLTS job openings at 6.866 million (March data, released 7 May) reinforce the picture of structurally declining labour demand, not a one-month dip.
Initial claims at 200,000 provide a counterbalance: no wave of mass layoffs is imminent. The softening is gradual, not acute.
Zillow projects payrolls averaging approximately 50,000 per month through mid-2026, with unemployment edging toward 4.5% by Q4 2026 if hiring does not accelerate.
Before the report, fed funds futures had priced in meaningful probability of rate cuts in 2026. After the report, those expectations compressed sharply.
CME FedWatch data as of 8-12 May showed approximately 3% odds of a 2026 rate cut, a materially more hawkish posture than pre-report pricing. Three factors suppressed cut probability:
The April 29 FOMC meeting produced a four-way dissent that revealed the full depth of the committee’s internal fracture: PCE inflation running at 3.5% against a 2% target, unemployment at 4.3%, and a Strait of Hormuz energy shock landing simultaneously on a committee that could not agree on the direction of the next move.
The Federal Reserve’s dual mandate framework defines maximum employment and price stability as co-equal objectives, meaning the FOMC cannot respond to labour market softening if inflation remains elevated above target, a constraint that directly shapes how committee members are likely to weigh the April data.
The Bank of America Institute characterised payroll growth as “solid,” noting 1.9% year-over-year growth in its internal data, a view that counterbalances the hawkish repricing with evidence of continued, if unspectacular, expansion.
The 10-year Treasury yield stood at approximately 4.38% as of 8 May, reflecting the modest “stronger than feared” reaction. Average hourly earnings at +3.6% year-over-year represent moderating wage pressure, neither hot enough to alarm nor cool enough to invite cuts.
The Fed’s historical pattern shows it responds to trend data across multiple months, not single-month beats. The 48,000 three-month average is a more relevant input to the committee’s decision framework than the April headline.
Kevin Warsh, nominated as Fed Chair in April 2026, has made no public comment on the April jobs data through 13 May. The dot plot held steady post-report with no intra-meeting signals, consistent with a wait-and-watch posture rather than a policy shift in either direction. The definitions of “full employment” and “stable prices” are not fixed, and Warsh’s views on the Fed’s framework add further uncertainty to the longer-term path.
What the April report confirms:
What it leaves unresolved:
Involuntary part-time employment surged by 445,000 to 4.9 million in April, one of the sharpest underlying weakness signals in the report.
Meanwhile, wage gains remain sharply uneven. Bank of America Institute data shows high-income workers receiving 6.0% year-over-year wage growth, while lower- and middle-income workers see markedly weaker gains, a divergence that complicates the “strong labour market” narrative.
The interpretive thread running through the entire report is this: strong jobs data confirms past economic conditions, not future ones. The leading indicators pointing toward continued deceleration deserve equal analytical weight to the headline.
A single jobs beat above consensus tells readers where the labour market was in April. It does not tell them where it is heading in Q3 or Q4 2026.
Three forward-facing signals deserve close monitoring in the weeks ahead. First, the monthly three-month payroll average: whether it holds near the 48,000 floor or recovers toward 100,000 or more will determine how quickly unemployment drifts higher. Second, the ISM Services Employment index: sustained contraction below 50 would confirm that the labour market’s last resilient pillar is weakening. Third, JOLTS job openings: continued decline toward 6.5 million would signal further erosion in labour demand.
The May 2026 jobs report (expected in early June) and the next JOLTS release will be the two most consequential data points for validating or revising the deceleration thesis that the April data, beneath its headline, has reinforced.
Employment data earns its analytical weight when read alongside leading indicators, not in place of them.
Global PMI divergence in April 2026 adds an international dimension to the domestic sector split: manufacturing accelerated to 51.5 globally while the eurozone services PMI collapsed to 47.6, a level associated with recessionary pressure, suggesting that the services-sector employment contraction visible in US ISM readings is part of a broader developed-market deceleration rather than a US-specific phenomenon.
This article is for informational purposes only and should not be considered financial advice. Investors should conduct their own research and consult with financial professionals before making investment decisions. Past performance does not guarantee future results. Financial projections referenced in this article are subject to market conditions and various risk factors.
The nonfarm payroll report is a monthly Bureau of Labor Statistics release measuring the number of jobs added or lost across most sectors of the US economy. Investors use it to gauge labour market health, inform expectations about Federal Reserve rate decisions, and assess the broader economic cycle.
The April 2026 report showed 115,000 jobs added, well above the 55,000-65,000 consensus, but the three-month average of just 48,000 per month, a shrinking civilian labour force, and contracting ISM employment readings on both the manufacturing and services sides revealed significant underlying weakness beneath the headline number.
A strong jobs print reduces the urgency for the Fed to cut rates, as it signals the labour market has not deteriorated enough to require easing; after the April 2026 report, CME FedWatch data showed rate cut probability for 2026 compressed to approximately 3%, reflecting a more hawkish market posture.
Employment data is a lagging indicator because businesses hire only after demand has proven durable over multiple quarters, meaning the payroll figures published by the BLS reflect economic conditions that are already months old rather than signalling where the economy is heading next.
Healthcare added 37,000 jobs, transportation and warehousing added 30,000, retail trade added 22,000, and social assistance added 17,000, while construction and manufacturing were flat, federal government shed 9,000 positions, and information lost 13,000 jobs.