At 8:30 a.m. ET this morning, the Bureau of Labor Statistics (BLS) releases July inflation data that could settle one of the most consequential questions US markets have faced all summer: was June’s dramatic cooling a genuine disinflation inflection, or an energy-driven anomaly that partially reverses this month?
Four major assets, Gold, EUR/USD, GBP/USD, and Zcash (ZEC), are pinned near critical technical levels in deliberate pre-release compression. The common thread is the Dollar. Whichever direction the CPI print pushes the greenback, the move will be amplified by the fact that consensus already leans soft, making the hotter-than-expected scenario the more disruptive outcome of the two.
Here is the framework for reading each asset’s setup before the number drops, the specific price levels that confirm or break the current narrative in each scenario, and why the real risk today is the one most traders are not sized for. Whether you hold one of these assets or simply track the macro environment, this is actionable before the release and immediately relevant after it.
Why July’s inflation number carries more weight than a typical monthly print
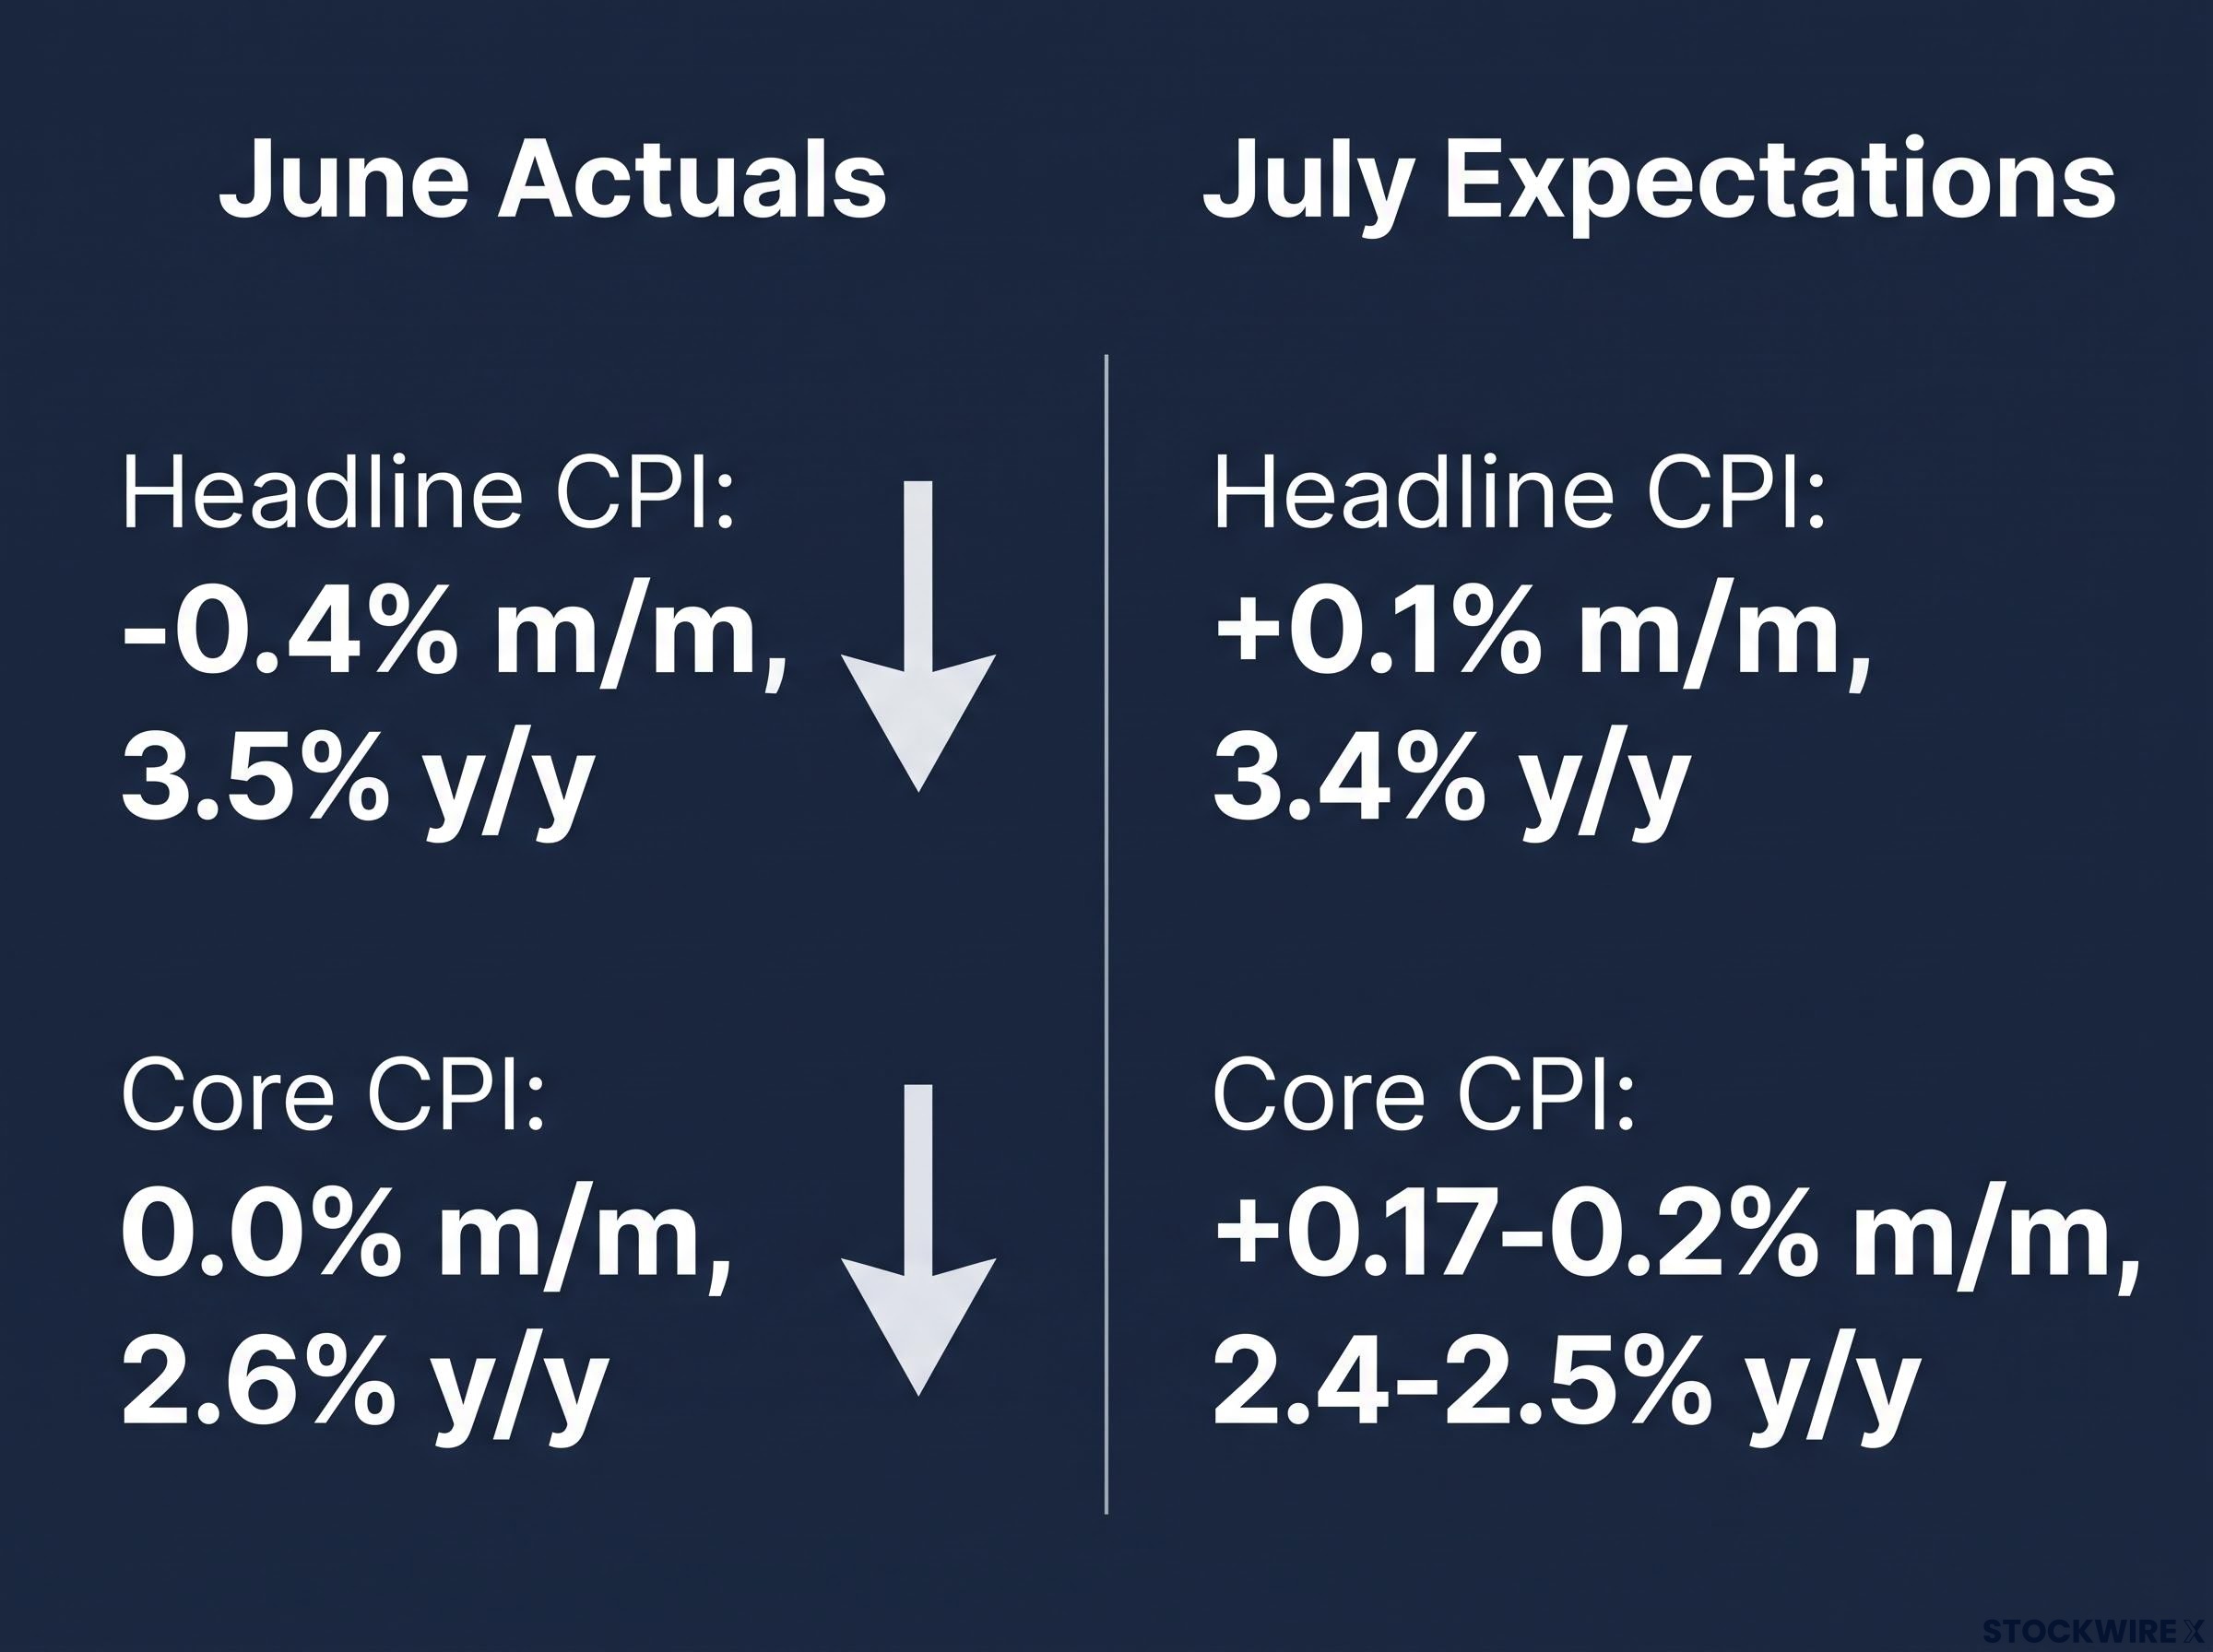
June’s CPI report did not just surprise to the downside. It rewrote the near-term inflation story. Headline CPI fell 0.4% month-on-month, dragging the annual rate down to 3.5% from 4.2%. Core CPI, which strips out volatile food and energy, was flat on the month, pulling core annual inflation to 2.6% year-on-year, well below expectations.
The June core CPI report delivered the largest downside miss relative to consensus in over a year, with headline CPI dropping 0.4% month-over-month driven primarily by a sharp fall in gasoline prices rather than any broad-based demand collapse, which is precisely why today’s July print is the test of whether that momentum is durable.
The June core CPI print: 0.0% m/m, 2.6% y/y. That was the single most market-moving data point of the summer, and July’s report is the test of whether it was the start of something or the product of temporary energy dynamics.
Gasoline prices fell nearly 10% month-on-month in June, driven partly by a short-term easing of Middle East tensions. That energy decline did much of the heavy lifting on the headline number. July’s consensus expects a partial normalisation:
- Headline CPI: a modest gain of around +0.1% m/m, with the annual rate forecast to pull back to approximately 3.4%
- Core CPI: approximately +0.17-0.2% m/m, with the annual rate projected to settle somewhere in the 2.4-2.5% range
The gap between June’s actual print and these July expectations tells you the market has already priced in a moderation, not a repeat. A genuine second month of June-like softness would be a fresh shock with outsized market impact. A reading above consensus, even modestly, would challenge the entire disinflation narrative that has been building since mid-July. The Fed’s reaction function, not the absolute number, is what every asset discussed below is pricing around.
When big ASX news breaks, our subscribers know first
How to read the Dollar’s reaction before repositioning in any asset
Before looking at any individual asset, the framework starts with the Dollar. The greenback’s directional response to the CPI print, not the number itself, is the operational signal for Gold, both currency pairs, and Zcash.
The asymmetry in today’s setup is straightforward. Market pricing as of this morning leans toward the soft-CPI scenario. Positioning already skews toward Dollar weakness. That means a softer-than-expected print largely confirms what is already in the price, while a hotter-than-expected reading forces rapid unwinding of crowded trades across all four assets simultaneously. The upside inflation surprise is the less probable scenario, but it carries disproportionate repositioning violence.
Middle East geopolitical uncertainty adds a second independent variable. If energy prices move materially alongside or after the CPI release, the secondary market reaction could diverge from the initial Dollar-driven move, particularly for energy-sensitive assets like the Euro.
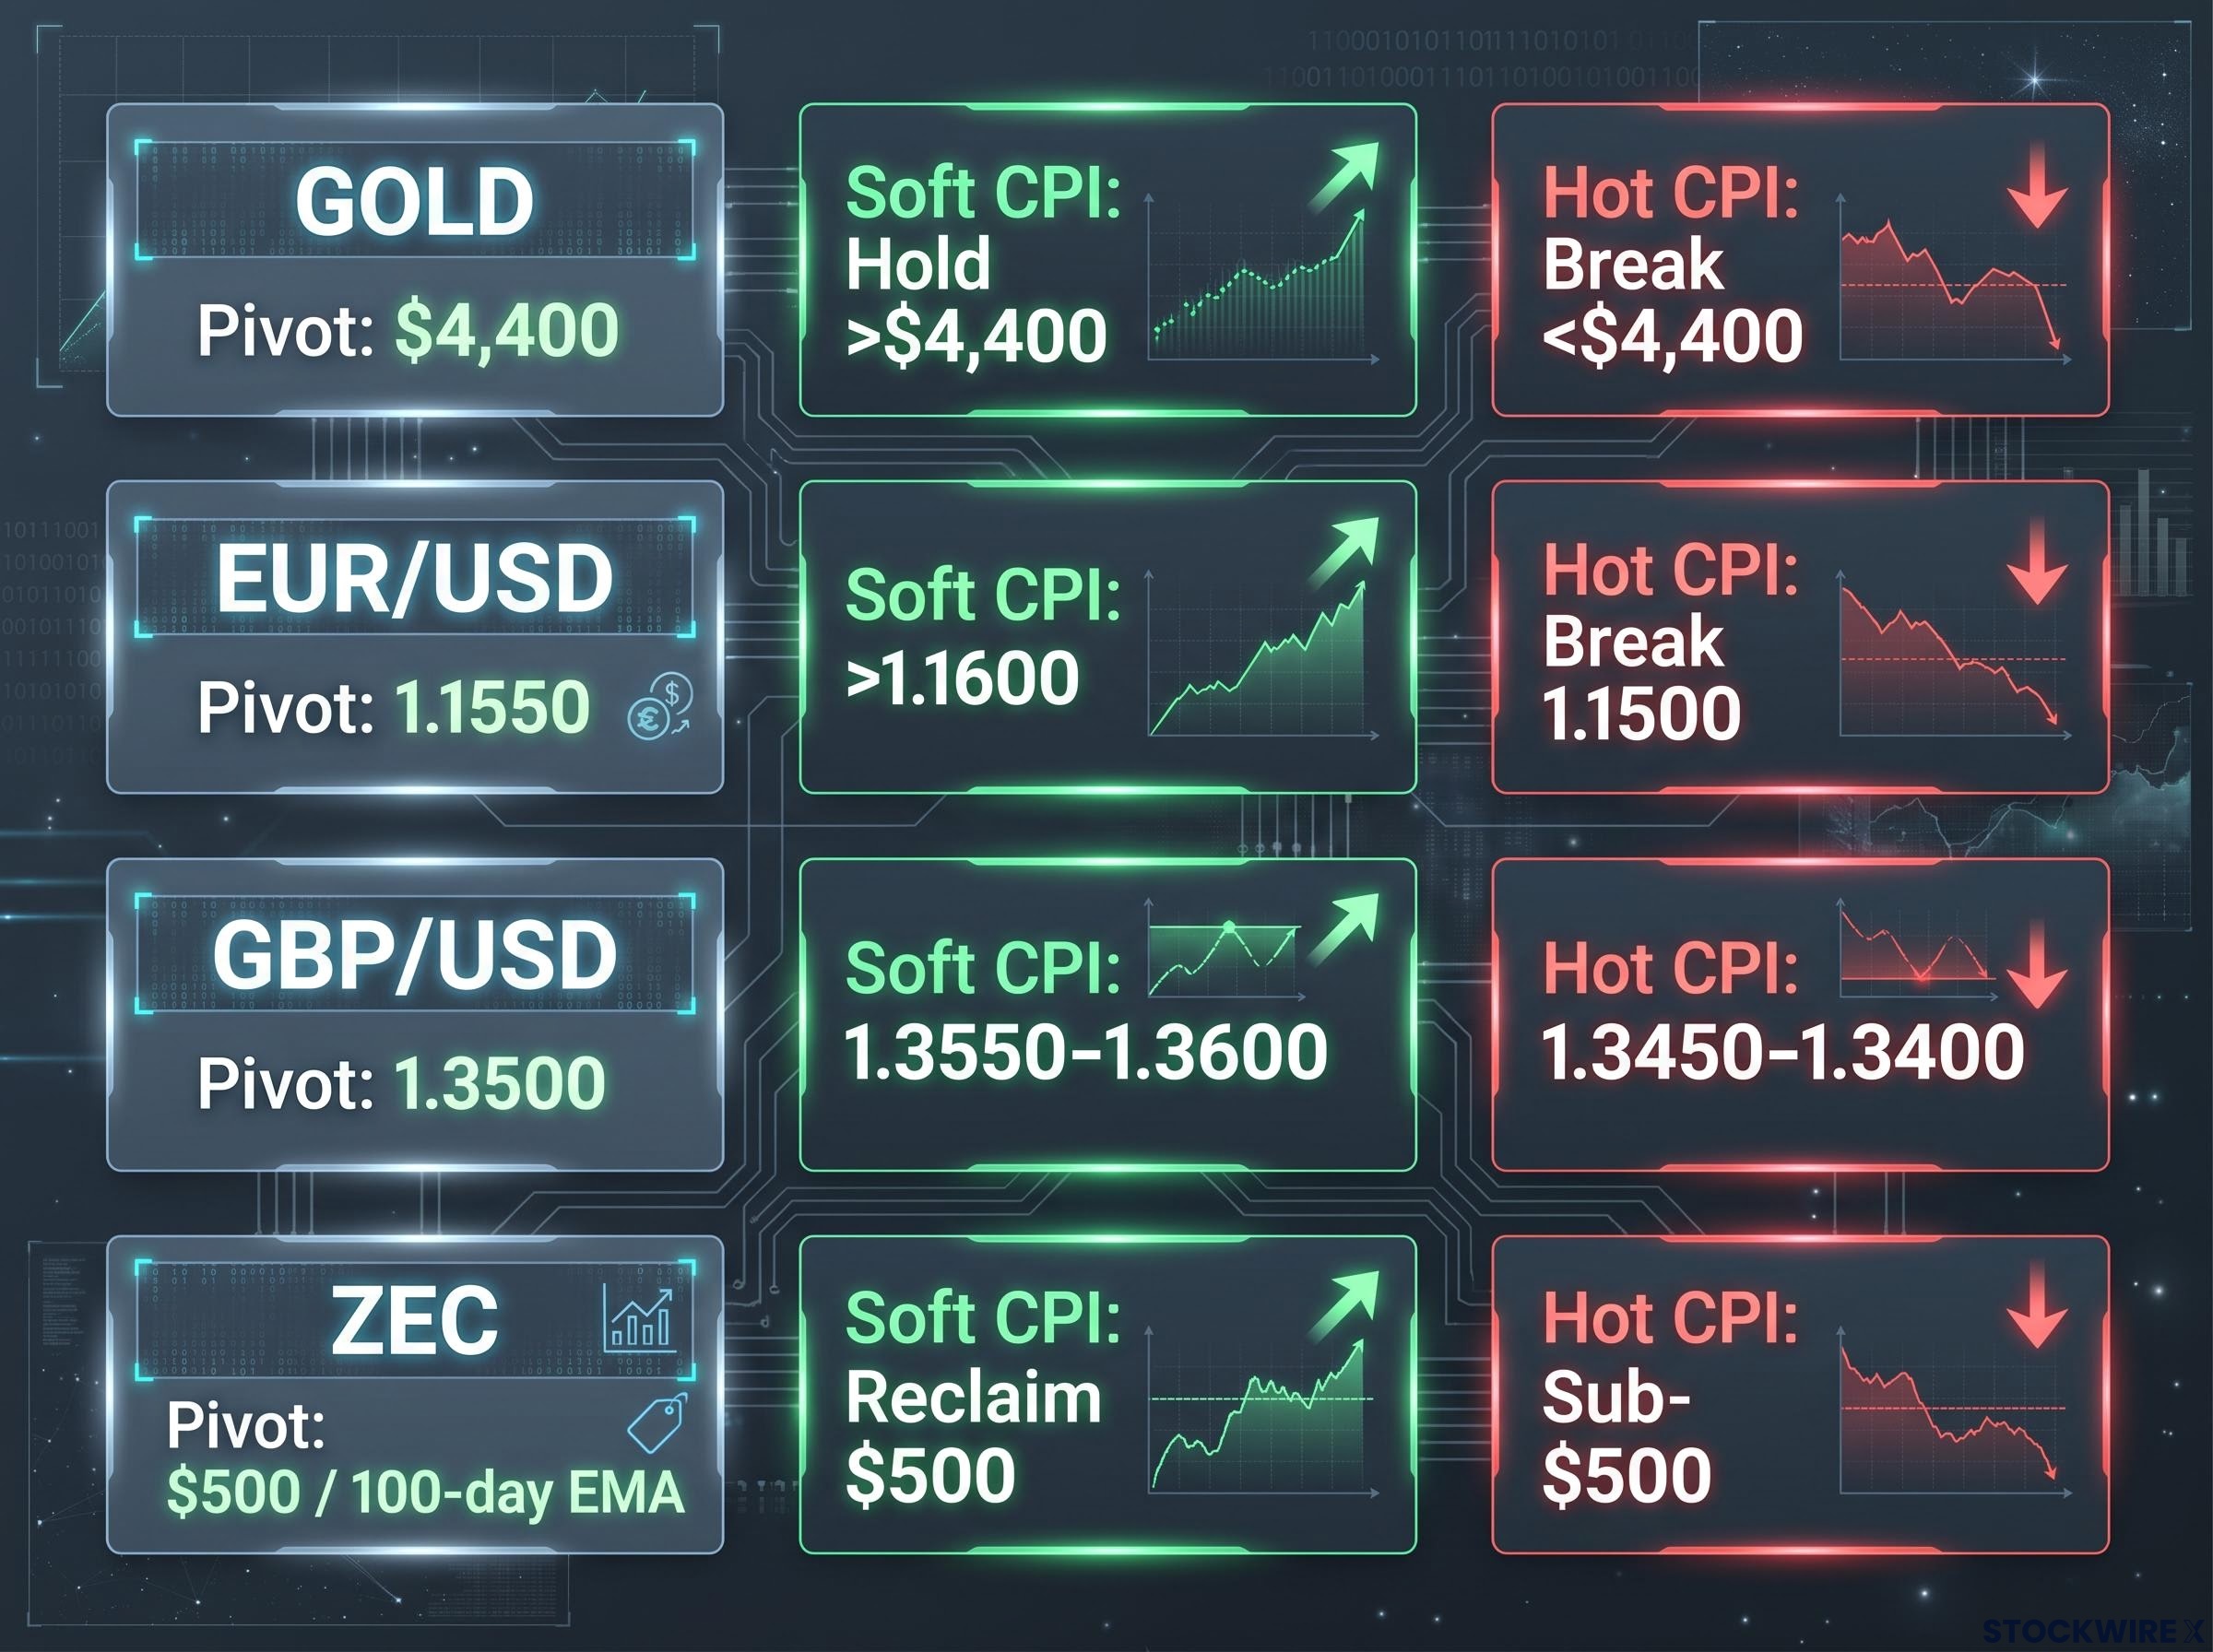
| Asset | Soft CPI outcome | Hot CPI outcome | Current pivot level |
|---|---|---|---|
| Gold | Break and hold above $4,400 | $4,400 support test; break below = vulnerable | $4,400 |
| EUR/USD | Challenge above 1.1600 | 1.1500 sustained break = narrative shift | 1.1550 |
| GBP/USD | Break above 1.3500 toward 1.3550-1.3600 | Pullback to 1.3450-1.3400 | 1.3500 |
| ZEC | Reclaim $500 and clear 100-day EMA | Persistent sub-$500 = corrective phase | $500 / 100-day EMA |
Because positioning already reflects the soft-CPI base case, a hotter print does not simply push the Dollar higher. It forces simultaneous unwinding across all four of these assets, which is why the upside inflation surprise is the scenario that demands the most preparation today.
The $4,400 threshold: reading Gold’s pre-CPI setup and what each scenario triggers
Gold has pushed back above $4,400 and is trading within reach of its strongest level since around 5 June, supported by three converging drivers: lower real-yield uncertainty as the Fed holds, macro and geopolitical risk hedging tied to ongoing Middle East tensions, and broader Fed policy ambiguity around whether the disinflation path is durable enough to warrant rate adjustments.
The $4,400 zone is not just a chart level. It is the market’s current answer to whether the disinflation trade has genuine staying power or is leveraged to a single month of soft data. How Gold responds to today’s print at that level tells you which interpretation is correct.
- Soft CPI scenario: A clean break and hold above $4,400 is the bullish confirmation. The next resistance reference is the early-June high, which marked Gold’s most recent peak. A weaker Dollar combined with falling real-yield expectations would reduce the opportunity cost of holding a non-yielding asset, reinforcing the bid.
- Hot CPI scenario: $4,400 becomes the line of support. A decisive break below it signals that the recent rally was positioning-driven rather than fundamentally anchored, leaving the move vulnerable to further unwinding as rate-hike or delayed-cut speculation re-enters the picture.
The structural test inside the hot-CPI scenario
Here is the less obvious signal to watch. If Gold holds $4,400 even on a mildly Dollar-positive print, that is actually a more bullish signal than a Gold rally on a soft print. Why? Because it isolates safe-haven demand from the Fed-rate narrative. It tells you buyers are not just betting on rate cuts; they are hedging against geopolitical and macro uncertainty that persists regardless of one month’s inflation data. Middle East tensions provide an independent floor for Gold that operates outside the CPI binary entirely.
Structural gold demand from central banks, which purchased 244 tonnes in Q1 2026 alone, provides a bid beneath the metal that operates independently of any single CPI print, which is the mechanism behind the safe-haven floor argument that persists even if today’s data pushes the Dollar temporarily higher.
EUR/USD and GBP/USD: the same catalyst, two different backstories
Both pairs are sitting at major round-number pivots in tight pre-CPI compression, EUR/USD near 1.1550 and GBP/USD near 1.3500. That is not a coincidence. The FX market has centralised risk into a single binary event rather than pricing two separately evolving stories, which means both pairs will likely move together on the initial reaction and diverge only in the hours after.
The immediate Dollar-driven move is the same for both. The divergence is in the fundamental backdrop and the secondary risk profile.
EUR/USD is supported by the European Central Bank’s (ECB) relatively hawkish posture compared to a potentially pausing Fed, which gives the pair a fundamental bullish bias on soft US CPI. However, Commerzbank FX analyst Antje Praefcke has flagged the Eurozone’s sensitivity to energy price swings, given Europe’s import dependence. If hot CPI coincides with renewed Middle East oil stress, the Euro could face asymmetric pressure: higher imported inflation and weaker growth simultaneously, a combination that hits harder than Dollar strength alone.
A Hormuz supply disruption of the kind that drove WTI above $103 in May 2026 creates a compound risk for EUR/USD that goes beyond simple Dollar strength: higher imported inflation hits European growth simultaneously, a combination the ECB has already acknowledged as capable of forcing rate decisions that conflict with its underlying policy preference.
GBP/USD benefits from the Bank of England’s (BoE) comparatively hawkish stance and resilient UK economic data. Sterling has underlying support in a Dollar-weakening scenario. But the UK is also exposed to Middle East energy disruptions, so the same compound risk applies: hot CPI plus energy stress is a uniquely challenging combination.
| Pair | Current level | Soft CPI target | Hot CPI risk level | Central bank posture |
|---|---|---|---|---|
| EUR/USD | ~1.1550 | 1.1600+ | 1.1500 sustained break | ECB cautious but relatively hawkish vs. Fed |
| GBP/USD | ~1.3500 | 1.3550-1.3600 | 1.3450-1.3400 | BoE comparatively hawkish; resilient UK data |
Knowing that both pairs share an immediate-reaction driver but diverge on the follow-through gives you actionable insight into where secondary positioning opportunities emerge once the first Dollar move settles. The initial reaction is one trade. The divergence is the second.
How broad macro compression is showing up in Zcash’s technical setup
Zcash (ZEC) has slipped below $500 following back-to-back losing sessions, with retail sentiment toward the privacy coin remaining divided ahead of the data release. This is not primarily a crypto story. It is evidence of how broadly today’s macro binary has extended into risk assets.
The 100-day exponential moving average (EMA), a trend-following indicator that smooths price over approximately five months of trading, is the level systematic and trend-following strategies are watching most closely. ZEC’s proximity to this level after consecutive declines suggests institutional and cross-asset systematic strategies have already reduced risk-on exposure ahead of the data.
- Soft CPI scenario: A reclaim of $500 and a clear break above the 100-day EMA is the bullish confirmation. If systematic strategies rebuild risk-on exposure quickly after a soft print, the bounce could be sharper than the underlying crypto-specific fundamentals would suggest.
- Hot CPI scenario: Persistent trading below $500 signals ZEC remains in a corrective phase, with macro headwinds extending the drawdown beyond what retail sentiment alone would produce.
The cross-asset pattern is the signal here. When a privacy-focused cryptocurrency, Gold, and two G10 currency pairs are all compressing into the same data event, you are looking at a macro catalyst, not a currency market event. The CPI’s ripple effects today extend well beyond traditional FX and commodity markets.
What changes after the number drops, and what to watch in the hours that follow
The initial Dollar move will be the first signal, but it is not the most reliable one. What matters more is whether the key levels across Gold, EUR/USD, GBP/USD, and ZEC hold or break on a sustained basis once the first-minute spike settles.
Three post-release signals to watch, in sequence:
- Dollar direction on the initial print. This tells you which of the two scenarios the market is pricing. It does not tell you whether the move will stick.
- Key level confirmation or failure across assets. Watch whether Gold holds or breaks $4,400, whether EUR/USD holds 1.1500 or clears 1.1600, whether GBP/USD sustains 1.3500, and whether ZEC reclaims $500. Multi-asset confirmation strengthens the signal. A Dollar move that is not confirmed by level breaks across multiple assets simultaneously is less trustworthy.
- Secondary energy market reaction. Middle East developments remain a live independent variable. If oil prices move materially in the hours after the release, the secondary reaction in EUR/USD and Gold could diverge from the initial Dollar-driven move.
The delayed-confirmation rule for crowded-positioning events
A critical nuance for today’s setup: first-minute moves on high-conviction consensus events, where positioning is already leaning one way, frequently reverse or overextend. The market’s first reaction is often mechanical, driven by algorithmic order flow hitting pre-set levels. The 30-60 minute candle is a more reliable signal for actual trend direction.
This applies specifically to today’s setup because positioning already leans soft. A hot CPI print could produce an initial Dollar spike that overshoots before the market reassesses whether the surprise is genuinely regime-changing. Conversely, a soft print may produce a muted initial reaction precisely because it was already expected, with the real move building over the following hour as confirmation trades layer in.
Making a positioning call when the market is already leaning one way
The shared insight across all four assets is that every major level today is a binary test driven by the same catalyst. Gold at $4,400, EUR/USD at 1.1550, GBP/USD at 1.3500, and ZEC at $500 are all Dollar-linked positions that resolve together. Diversification across these assets does not reduce CPI event risk; it multiplies it.
If you are positioned for Dollar weakness across multiple assets, you are effectively running a single concentrated bet on one data point. The hot-CPI scenario is the tail risk to size for, not because it is more likely, but because it is the scenario where crowded positioning creates the most violent repricing.
Three confirmation signals to watch after the release:
- Gold: Does $4,400 hold or break? A hold on a mildly hot print is structurally bullish. A clean break below signals the rally was leveraged to a single data point.
- EUR/USD and GBP/USD: Do both pairs confirm the Dollar move at their respective support or resistance levels? Multi-pair confirmation strengthens conviction; divergence between them signals follow-through opportunities.
- ZEC: Does the 100-day EMA hold as a floor or cap further downside? The crypto read confirms whether the risk-on or risk-off signal has extended beyond traditional markets.
The market’s pre-release message is consistent across all four assets: protect capital, avoid strong directional bets, and let the data decide whether the Dollar narrative shifts toward renewed strength or entrenched weakness.
The setup rewards those who let the data confirm rather than those who lean into the consensus narrative ahead of the release. The specific level thresholds above give you precise confirmation points rather than general sentiment to act on. That distinction, between reacting to the number and understanding what the number resolves, is the difference between using today’s data as information and using it as a decision tool.
For readers who want to stress-test whether today’s disinflation narrative has durable structural support, our deep-dive into generational inflation regimes examines 150 years of inflation cycle data and identifies the 13 structural reversals that make a sustained return to 2% historically more difficult than current consensus implies.
This article is for informational purposes only and should not be considered financial advice. Investors should conduct their own research and consult with financial professionals before making investment decisions. Past performance does not guarantee future results, and financial projections are subject to market conditions and various risk factors.