
According to Chris Whalen’s stress-case estimate, a substantial portion of US private equity-owned companies may be impossible to offload at the valuations currently carried on fund books. That is not a regulatory finding or a data-provider statistic. It is banking analyst Chris Whalen’s stress-case estimate, and while the precise fraction cannot be independently verified, the directional thrust lands uncomfortably close to what observable market data already confirms.
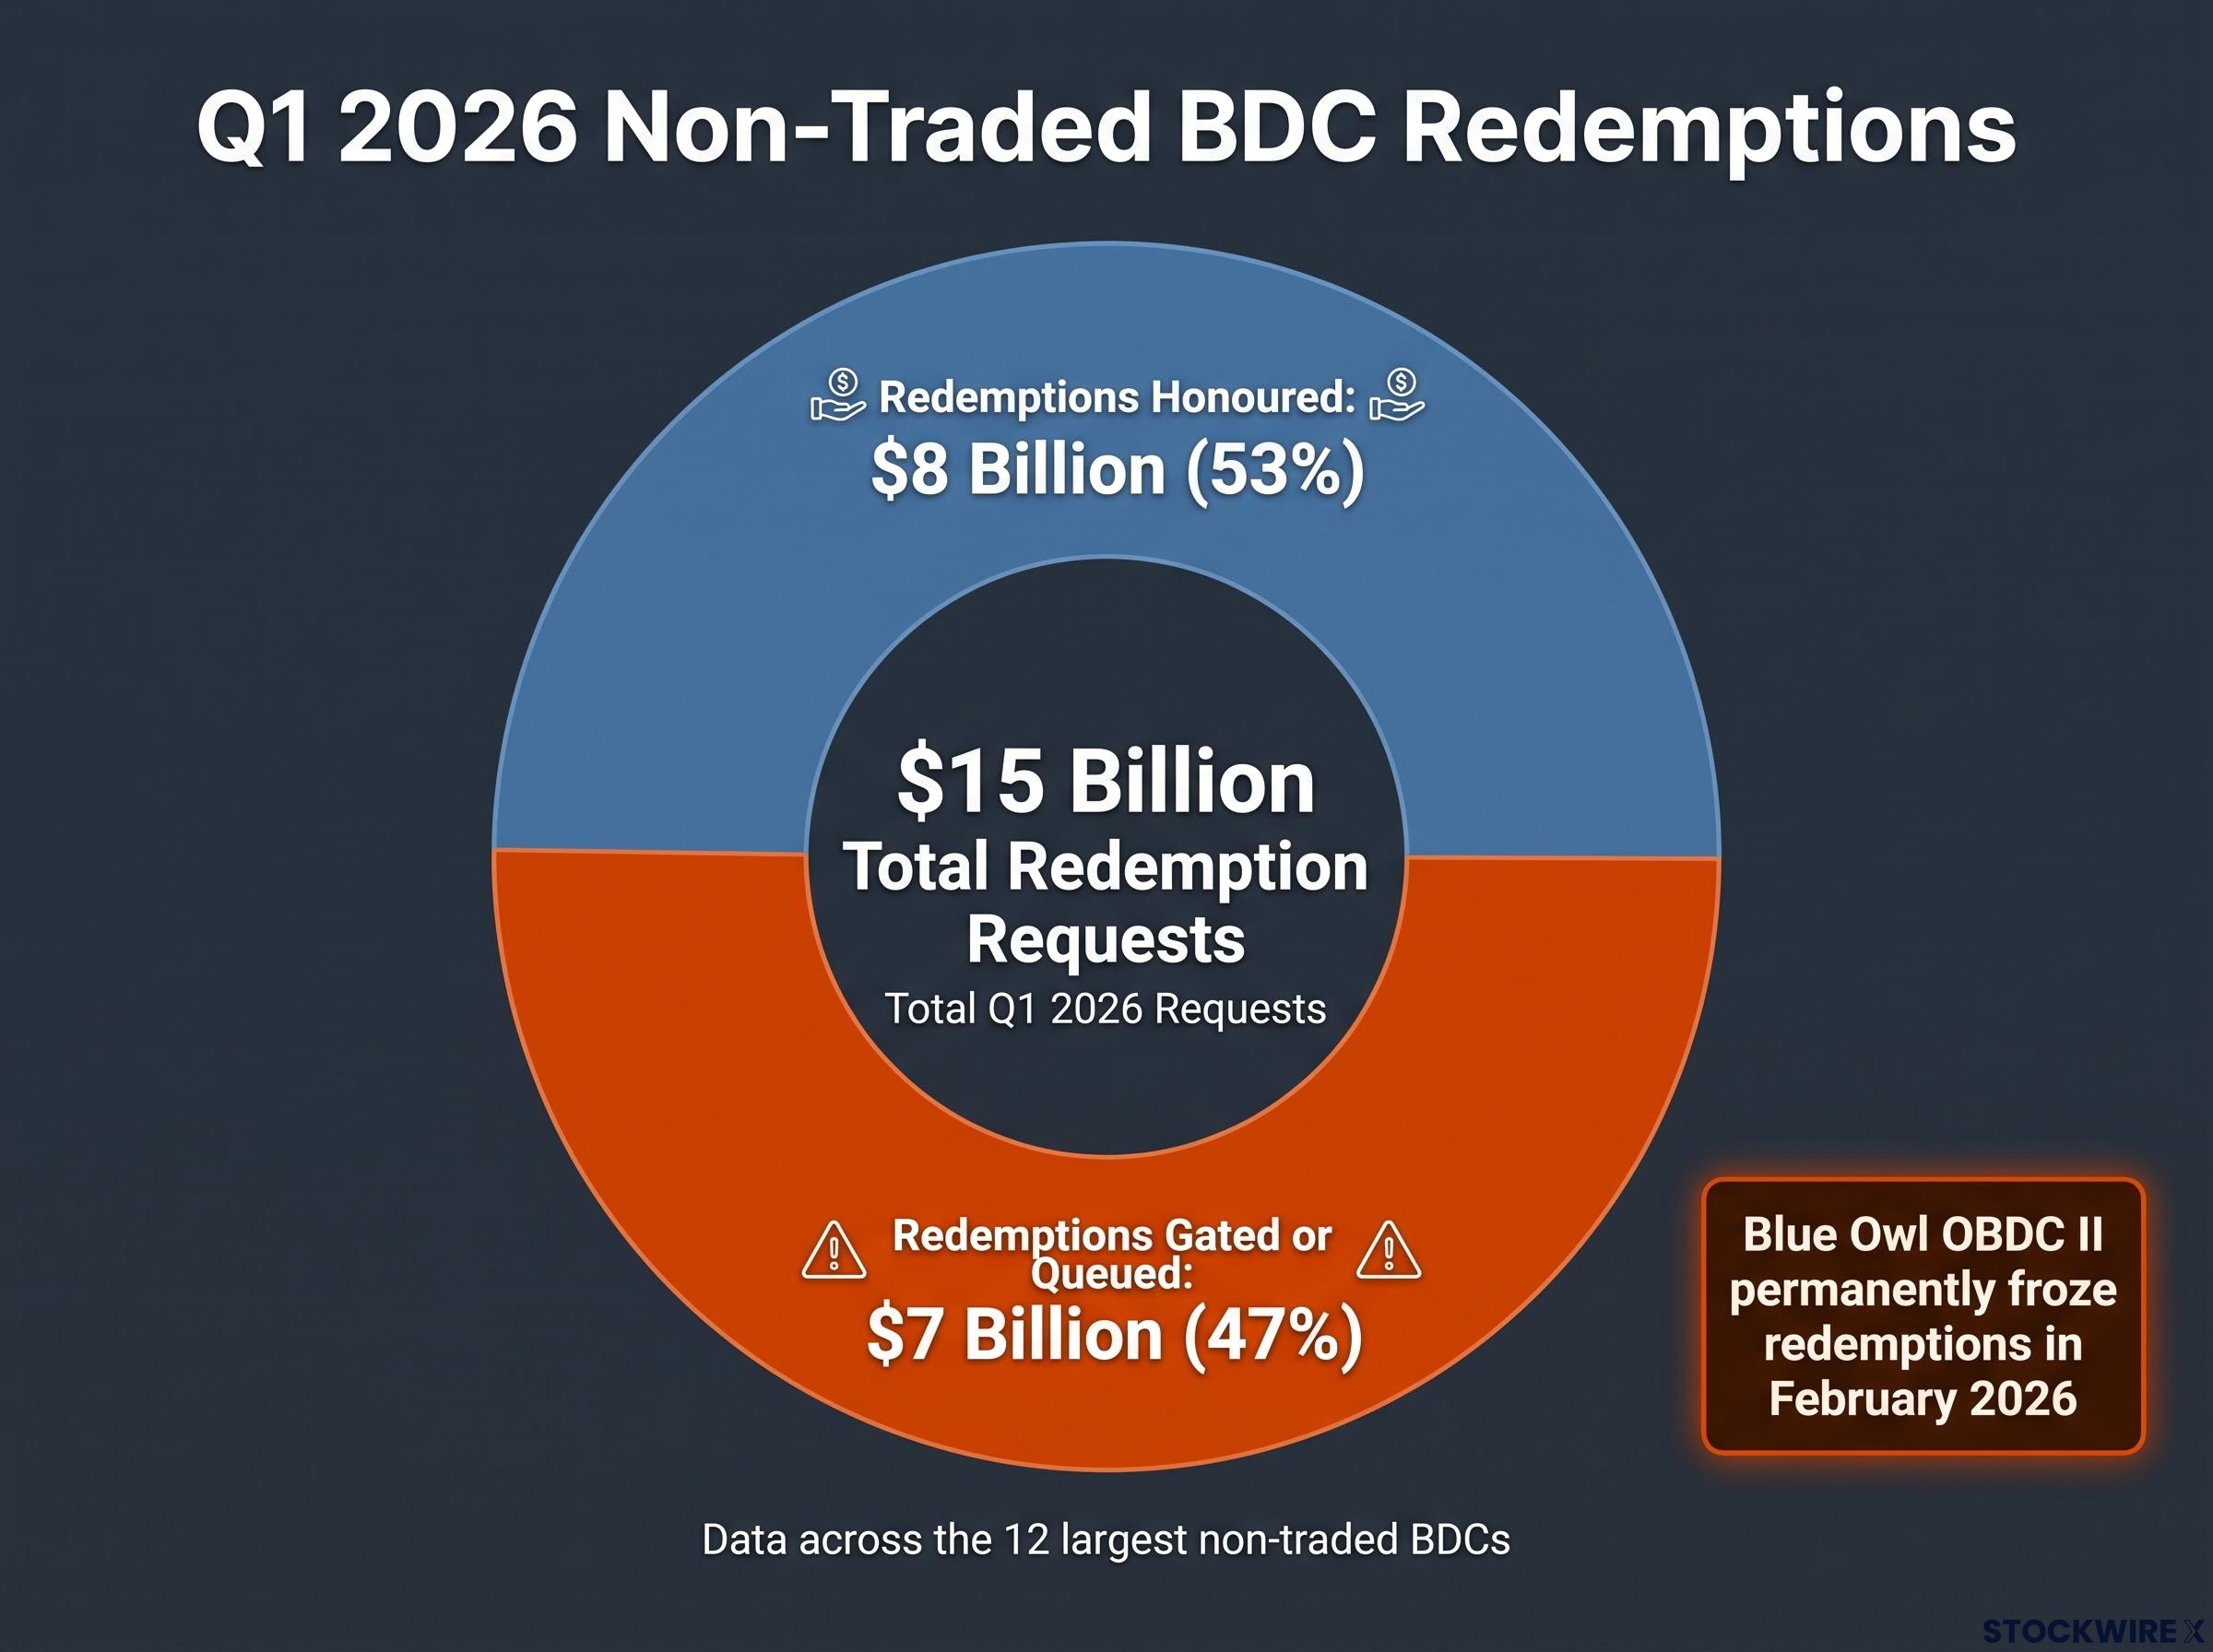
The stress is no longer theoretical. Blue Owl permanently froze redemptions on its flagship semi-liquid credit fund in February 2026 and began an orderly liquidation. Across the 12 largest non-traded Business Development Companies (BDCs), roughly $15 billion in redemption requests hit in Q1 2026; only 53% were honoured. Public BDCs, which hold similar assets but trade on exchanges where real buyers set real prices, now sit at discounts of 17-26% to their stated net asset values. These are not projections. They are reported figures.
Here is what this piece gives you: a clear map of the mechanism behind private credit risk, the observable signals that confirm it is already building, and what it could mean for the broader financial system and for anyone with exposure to these asset classes, whether direct or through a pension fund allocation they have never looked at closely.
What private credit actually is, and why its size matters
Private credit is lending done outside the traditional banking system. Non-bank lenders, including firms like Apollo and Brookfield, provide loans primarily to private equity-backed and middle-market companies. These are businesses too small or too leveraged for public bond markets, and increasingly, too attractive for private credit managers to leave to the banks.
The capital behind these loans comes from two distinct sources:
- Locked-up institutional capital from pension funds, endowments, sovereign wealth funds, and family offices committed to multi-year fund vehicles with no redemption rights during the investment period
- Semi-liquid retail products, including evergreen funds and non-traded BDCs, that offer quarterly redemption windows to high-net-worth and retail investors against portfolios of fundamentally illiquid loans
That second category now accounts for roughly $220 billion, approximately 20% of total private credit assets under management (AUM). Global private credit AUM sits at roughly $1.8-3 trillion in 2026, having expanded rapidly since post-2008 bank regulation created the opening non-bank lenders filled.
The Financial Stability Board (FSB), the European Central Bank (ECB), and major central banks now explicitly classify private credit as part of the shadow banking ecosystem.
The competitive displacement angle matters. Private credit managers are not operating in a separate lane from banks. They are competing directly for the same corporate borrowers, which shifts where the lending risk sits without reducing the total amount of it. The asset class is large enough, and connected enough to the traditional banking system, that it has moved well beyond the niche alternative allocation it was a decade ago.
When big ASX news breaks, our subscribers know first
The valuations are opinions until a buyer agrees
Private credit and private equity valuations work differently from public market prices. There is no daily market-clearing transaction. Instead, fund managers set portfolio values using internal models, typically on a quarterly basis. The number on your statement reflects a manager’s assessment of what the assets are worth, not what someone has agreed to pay for them.
The gap between those two things is now measurable. Public BDCs, which hold similar loan portfolios but trade on exchanges, currently price at discounts of 17-26% to their stated net asset values, with typical discounts in the 18-20% range. That is the widest gap since 2020. In the secondary market, where investors sell their stakes in private credit and private equity funds to other buyers, transactions frequently clear at double-digit discounts to stated NAV.
| Valuation Source | Implied Discount |
|---|---|
| Private fund quarterly marks | No discount (model-based, manager-set) |
| Public BDC market price | 17-26% discount to stated NAV |
| Secondary market transactions | Double-digit discounts to stated NAV |
Whalen’s stress-case judgment is that a large proportion of US private equity-owned companies are effectively unsaleable at the values currently recorded on fund books, an analyst’s view rather than a verified count. But the direction of the claim aligns with what observable pricing already shows: sophisticated, well-resourced market participants are paying materially less than what managers say these portfolios are worth.
When JPMorgan questions the marks
JPMorgan has marked down the collateral value of certain software loans it financed for private credit managers. That is not an abstract risk assessment. It is a major bank cutting the amount it will lend against specific assets because it no longer accepts the valuations those assets carry on fund statements.
The action matters beyond the individual loans involved. JPMorgan simultaneously competes with private credit managers for corporate borrowers and finances those same managers through credit lines. When a bank in that dual role starts questioning the marks, it forces implicit deleveraging in the private credit portfolios that depend on those facilities. For any investor receiving a quarterly NAV statement from a private credit vehicle, the JPMorgan markdown reframes what that number is: an opinion, not a price.
How lenders hide deterioration without technically defaulting
Private credit managers have reported minimal credit losses for most of the asset class’s history. That track record is now ending, but the way it ends is designed to stay quiet. Three mechanisms allow fund managers and borrowers to defer loss recognition without triggering a formal default:
- Amend-and-extend: Pushing a loan’s maturity date forward rather than forcing the borrower to repay or restructure. The loan stays current on paper even when the borrower cannot refinance or repay on the original timeline.
- PIK toggles: Payment-in-kind provisions that allow borrowers to skip cash interest payments by adding the unpaid amount to the loan principal. The fund reports interest income it has not actually received in cash.
- NAV loans: Fund managers borrow against their portfolio’s stated net asset value to generate liquidity for distributions or operations, effectively leveraging marks that may not reflect what a buyer would pay.
These tools delay recognition. They do not eliminate the underlying credit deterioration. A loan that has been amended twice and converted to PIK interest is not performing in any economically meaningful sense, but it may not appear in a default statistic.
Morgan Stanley projects that default rates in direct lending could rise toward 8%, compared with a historical average of 2-2.5%.
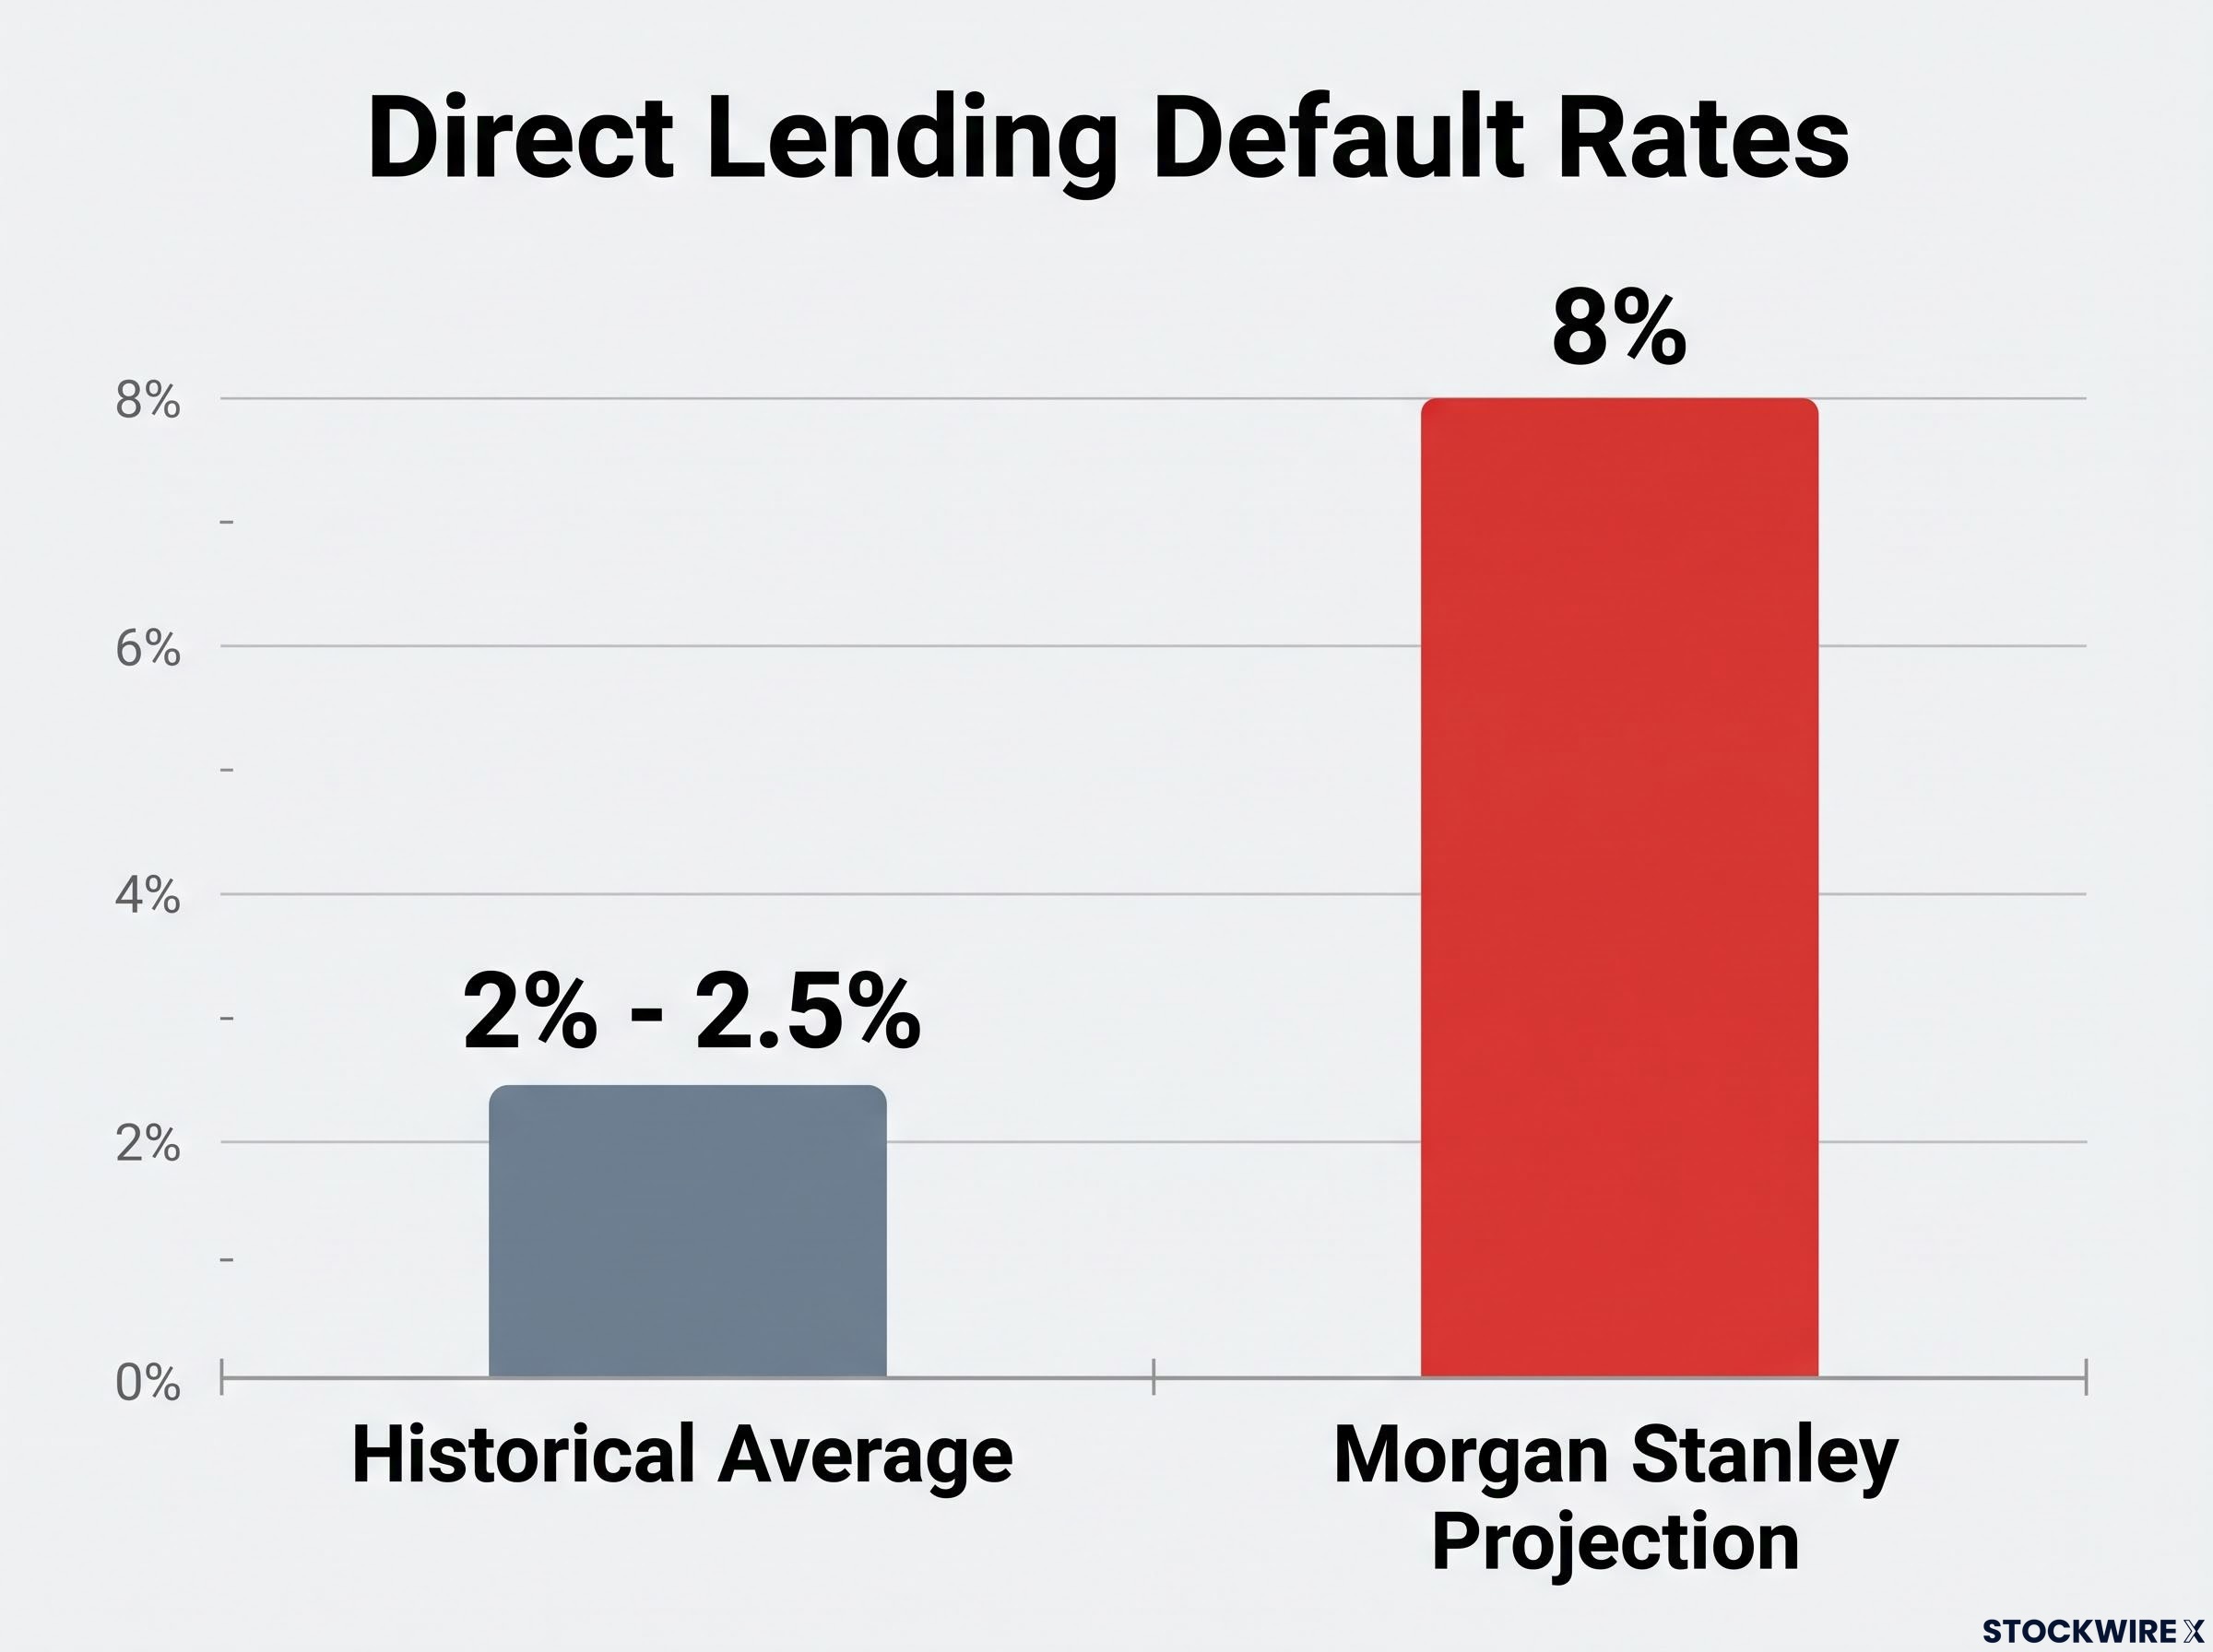
That projection likely understates the full picture. Moody’s and industry practitioners have documented amend-and-extend behaviour as widespread among private equity-backed borrowers, and CNBC has described the current environment as the ending of the “zero-loss fantasy” in private credit. The formal default statistics capture only the portion of deterioration that managers have chosen not to paper over. For an investor reading quarterly reports that show stable marks and minimal defaults, these numbers may be structurally unreliable as a guide to portfolio health.
Leveraged loan default rates already confirm the directional pressure: Fitch projected a 4.5-5.0% default rate for US leveraged loans across 2026, and Proskauer’s Private Credit Default Index reached 2.73% in Q1 2026 alone, figures that sit well above the historical averages private credit marketing materials typically cite.
The retail liquidity trap at the edge of private credit
Semi-liquid retail vehicles were built with an inherent contradiction. They hold portfolios of 3-7 year illiquid private loans but offer quarterly redemption windows to investors, typically capped at 5% of NAV per quarter. The product looks accessible. The underlying assets are not.
The Q1 2026 data shows what happens when real-world demand meets that structural mismatch.
| Metric | Figure | Implication |
|---|---|---|
| Total redemption requests | $15 billion across 12 largest non-traded BDCs | Demand far exceeded quarterly caps |
| Redemptions honoured | $8 billion (53%) | Nearly half of investors who wanted out could not get out |
| Redemptions gated or queued | $7 billion (47%) | Capital trapped in vehicles with declining asset quality |
Blue Owl’s OBDC II permanently froze redemptions in February 2026 and began an orderly liquidation via asset sales and distributions, the clearest single signal that the liquidity mismatch in these vehicles is structural, not temporary.
The roughly $220 billion sitting in semi-liquid retail structures represents approximately 20% of total private credit exposure. That is large enough to constitute a concentrated stress point, particularly because these vehicles reach a less sophisticated investor base than traditional institutional funds. For any investor in a non-traded BDC or evergreen private credit vehicle, the Q1 2026 data and the Blue Owl freeze are direct evidence that the redemption terms in the product documents are not the same as the ability to exit.
How private credit stress moves into the broader financial system
Private credit stress does not stay contained to private credit. The asset class is wired into the traditional banking system through multiple channels, and understanding those connections matters for investors whose exposure goes well beyond a single fund allocation.
Banks occupy a dual role. They compete with private credit managers for corporate lending business and simultaneously finance those same managers through subscription credit lines, warehouse lines, and NAV facilities. JPMorgan’s collateral markdowns are a live example of what happens when a bank on the financing side starts questioning the valuations: the leverage tightens, and the private credit manager faces implicit pressure to sell or restructure.
Cross-border contagion extends the systemic picture beyond US institutions: the ECB has separately mapped approximately €425 billion in private credit exposure across European insurers, banks, and pension funds, and its severe-shock modelling shows that second-round equity portfolio revaluations could exceed the initial direct credit losses.
Three channels worth watching
The specific pathways through which private credit deterioration could feed into the broader economy break down into three categories:
- Bank exposure channel: Losses on credit lines extended to private credit managers affect bank capital adequacy and could tighten broader lending appetite. You would observe this as banks reporting higher provisions against their private credit facilities or pulling back from new origination.
- Wealth channel: When large semi-liquid vehicles gate withdrawals or mark down sharply, high-net-worth investors may respond by de-risking across their entire portfolios, creating selling pressure in public equity and bond markets. You would observe this as correlated outflows from public market funds following private credit gate announcements.
- Real-economy channel: “Zombie” borrowers kept alive by extend-and-pretend lending misallocate capital and crowd out healthier borrowers, a dynamic that has parallels to Japan’s 1990s experience with non-performing loan forbearance. You would observe this as persistently weak productivity growth in sectors with high private equity penetration.
Regulators including the FSB and ECB assess private credit as unlikely to trigger a sudden collapse on its own. The locked-up capital structures and lower fund-level leverage reduce the acute run risk that made 2008 so severe. But both bodies explicitly flag private credit as a potential amplifier of a broader downturn. According to Oxford Economics, the current environment may represent the early stages of a rolling crisis in private credit. This is not 2008, but the interconnection with bank balance sheets and growing retail exposure means you should not use “not 2008” as a reason to dismiss the risk.
What the slow burn means for investors holding private market exposure today
The most plausible path forward is not a dramatic overnight collapse. It is rising defaults and restructurings concentrated in over-leveraged, rate-sensitive sectors; gradual NAV write-downs as managers slowly acknowledge deterioration they have been deferring; sub-par or flat net returns for 2020-2022 vintage private credit and private equity funds once true losses surface; and lower-than-expected distributions to limited partners as general partners rely on continuation vehicles and NAV loans to avoid selling at discounts.
Private capital’s effect on public markets runs deeper than credit stress alone: the same PE and VC ecosystem that created the lending pipeline now described as over-leveraged has simultaneously removed quality companies from public small-cap indices, leaving a residual pool of weaker businesses that compounds the structural concerns regulators are raising.
Three signals would indicate that the slow burn is accelerating:
- A wave of formal defaults in private equity-backed borrowers that breaks through the amend-and-extend containment, particularly in the software sector and among smaller, margin-constrained businesses
- Additional high-profile redemption gates or fund wind-downs beyond Blue Owl, suggesting the liquidity mismatch is widening rather than stabilising
- Further bank collateral markdowns or tightening of credit lines to private credit managers, which would force deleveraging across the system
The distinction between institutional closed-end structures and semi-liquid retail vehicles matters here. If you hold a position in a multi-year locked-up institutional fund, you face valuation risk and return risk, but not run risk. Your capital is committed and the manager has time to work through problems. If you hold a semi-liquid retail product, you face all three: the valuation may overstate what you own, the returns may disappoint, and the exit you were promised may not be available when you need it. The Q1 2026 data proved that second category is not hypothetical.
Stated valuations in private markets are opinions until tested by a transaction.
Morgan Stanley’s 8% default projection for direct lending, against a historical average of 2-2.5%, is the most clearly attributed figure for base-case deterioration. Public BDC discounts of 17-26% remain an ongoing, monitorable signal you can check against your own fund’s reported marks. The core message is not that private credit will collapse. It is that the liquidity and valuation terms you were offered when you invested may not hold under the conditions now materialising.
This article is for informational purposes only and should not be considered financial advice. Investors should conduct their own research and consult with financial professionals before making investment decisions.
Reading the signals before the quarterly statement does it for you
Private credit risk is real, measurable, and building in 2026. Its trajectory is slow-burn rather than sudden collapse, which gives investors time to act thoughtfully rather than react in panic. But the structural asymmetry running through this entire asset class cuts in one direction: the valuations, the liquidity terms, and the default reporting are all subject to manager discretion in ways that public market equivalents are not, and that discretion consistently favours deferral over transparency.
Probability-based risk assessment provides a useful calibration for how much portfolio weight this slow-burn thesis warrants: assigning actual likelihoods to scenarios rather than treating directional concerns as binary calls separates a disciplined monitoring posture from an overreaction that locks in unnecessary opportunity cost.
The clearest available real-time signals sit outside the quarterly statements that private credit managers control. Public BDC market prices tell you what buyers will actually pay for similar assets. Secondary market transaction data tells you what existing investors accept to exit. Bank collateral behaviour, as JPMorgan has already demonstrated, tells you whether the institutions financing private credit still trust the marks.
Those three inputs update faster, and more honestly, than any quarterly NAV report. If you hold private market exposure, they are worth watching before the next statement arrives.
Past performance does not guarantee future results. Financial projections referenced in this article are subject to market conditions and various risk factors.
—