A currency pair sits near a two-month low. Oil prices are climbing. The US dollar is firm. And yet the pair has barely moved. If you have ever stared at a chart on a day like that and wondered what you are missing, the answer is usually: nothing is missing. Everything is happening at once.
This piece uses a real episode in the USD/CAD exchange rate as a case study. The specific data releases referenced here, a US CPI print, a PPI report, a jobs number, have long since passed. The value is not in those numbers. It is in the analytical framework the episode reveals: the competing forces that drive this pair in every session, not just this one. Those forces work through three distinct channels: the oil-commodity channel, the Federal Reserve rate channel, and the geopolitical dual-channel.
Here is what you gain from working through this framework once: a reusable lens for decomposing any USD/CAD move into its contributing forces, rather than searching for a single cause. That is how professional FX analysts actually read this pair, and it is a skill you can apply the next time you open a chart.
Why USD/CAD barely moved when everything else did
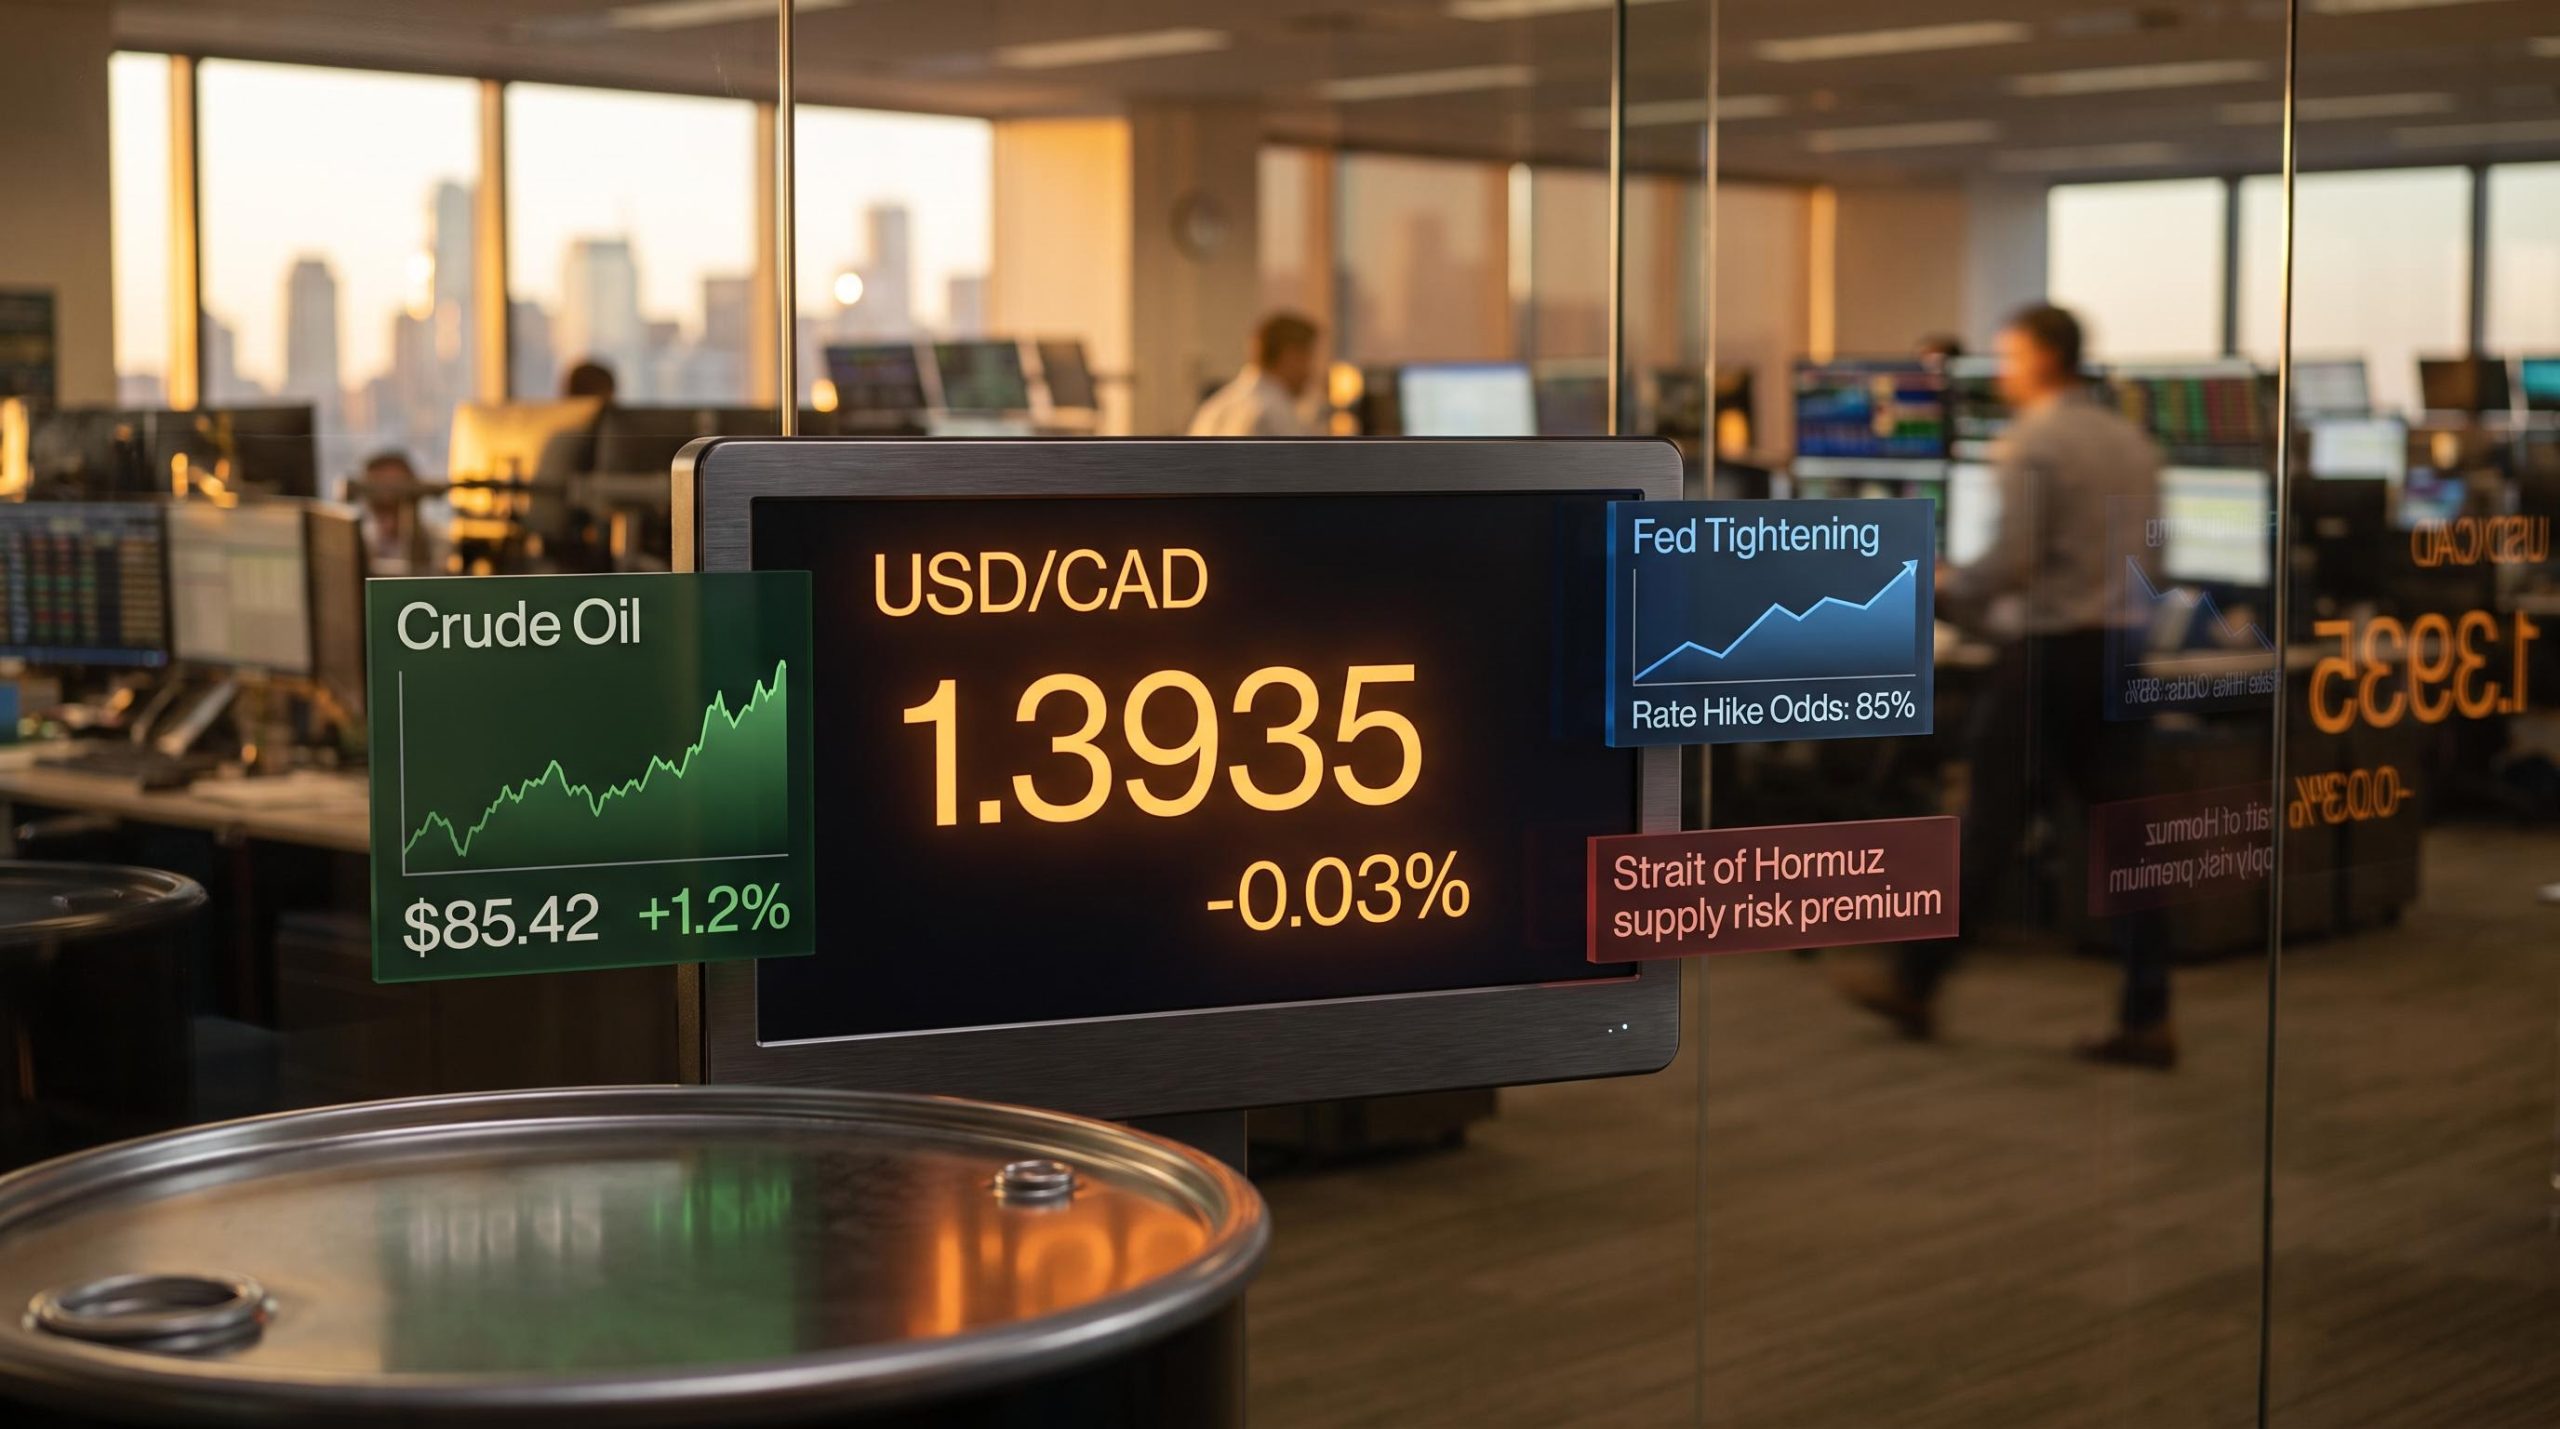
On the session in question, USD/CAD was quoted at around 1.3935, holding close to a two-month trough. The pair registered a decline of roughly 0.03% on the day, leaving it effectively unchanged. For all practical purposes, the pair was flat.
A flat session does not mean nothing happened. It means two forces of roughly equal strength were pulling in opposite directions, and neither won. The professional question on a day like this is never “why didn’t it move?” It is “what is holding it in place?”
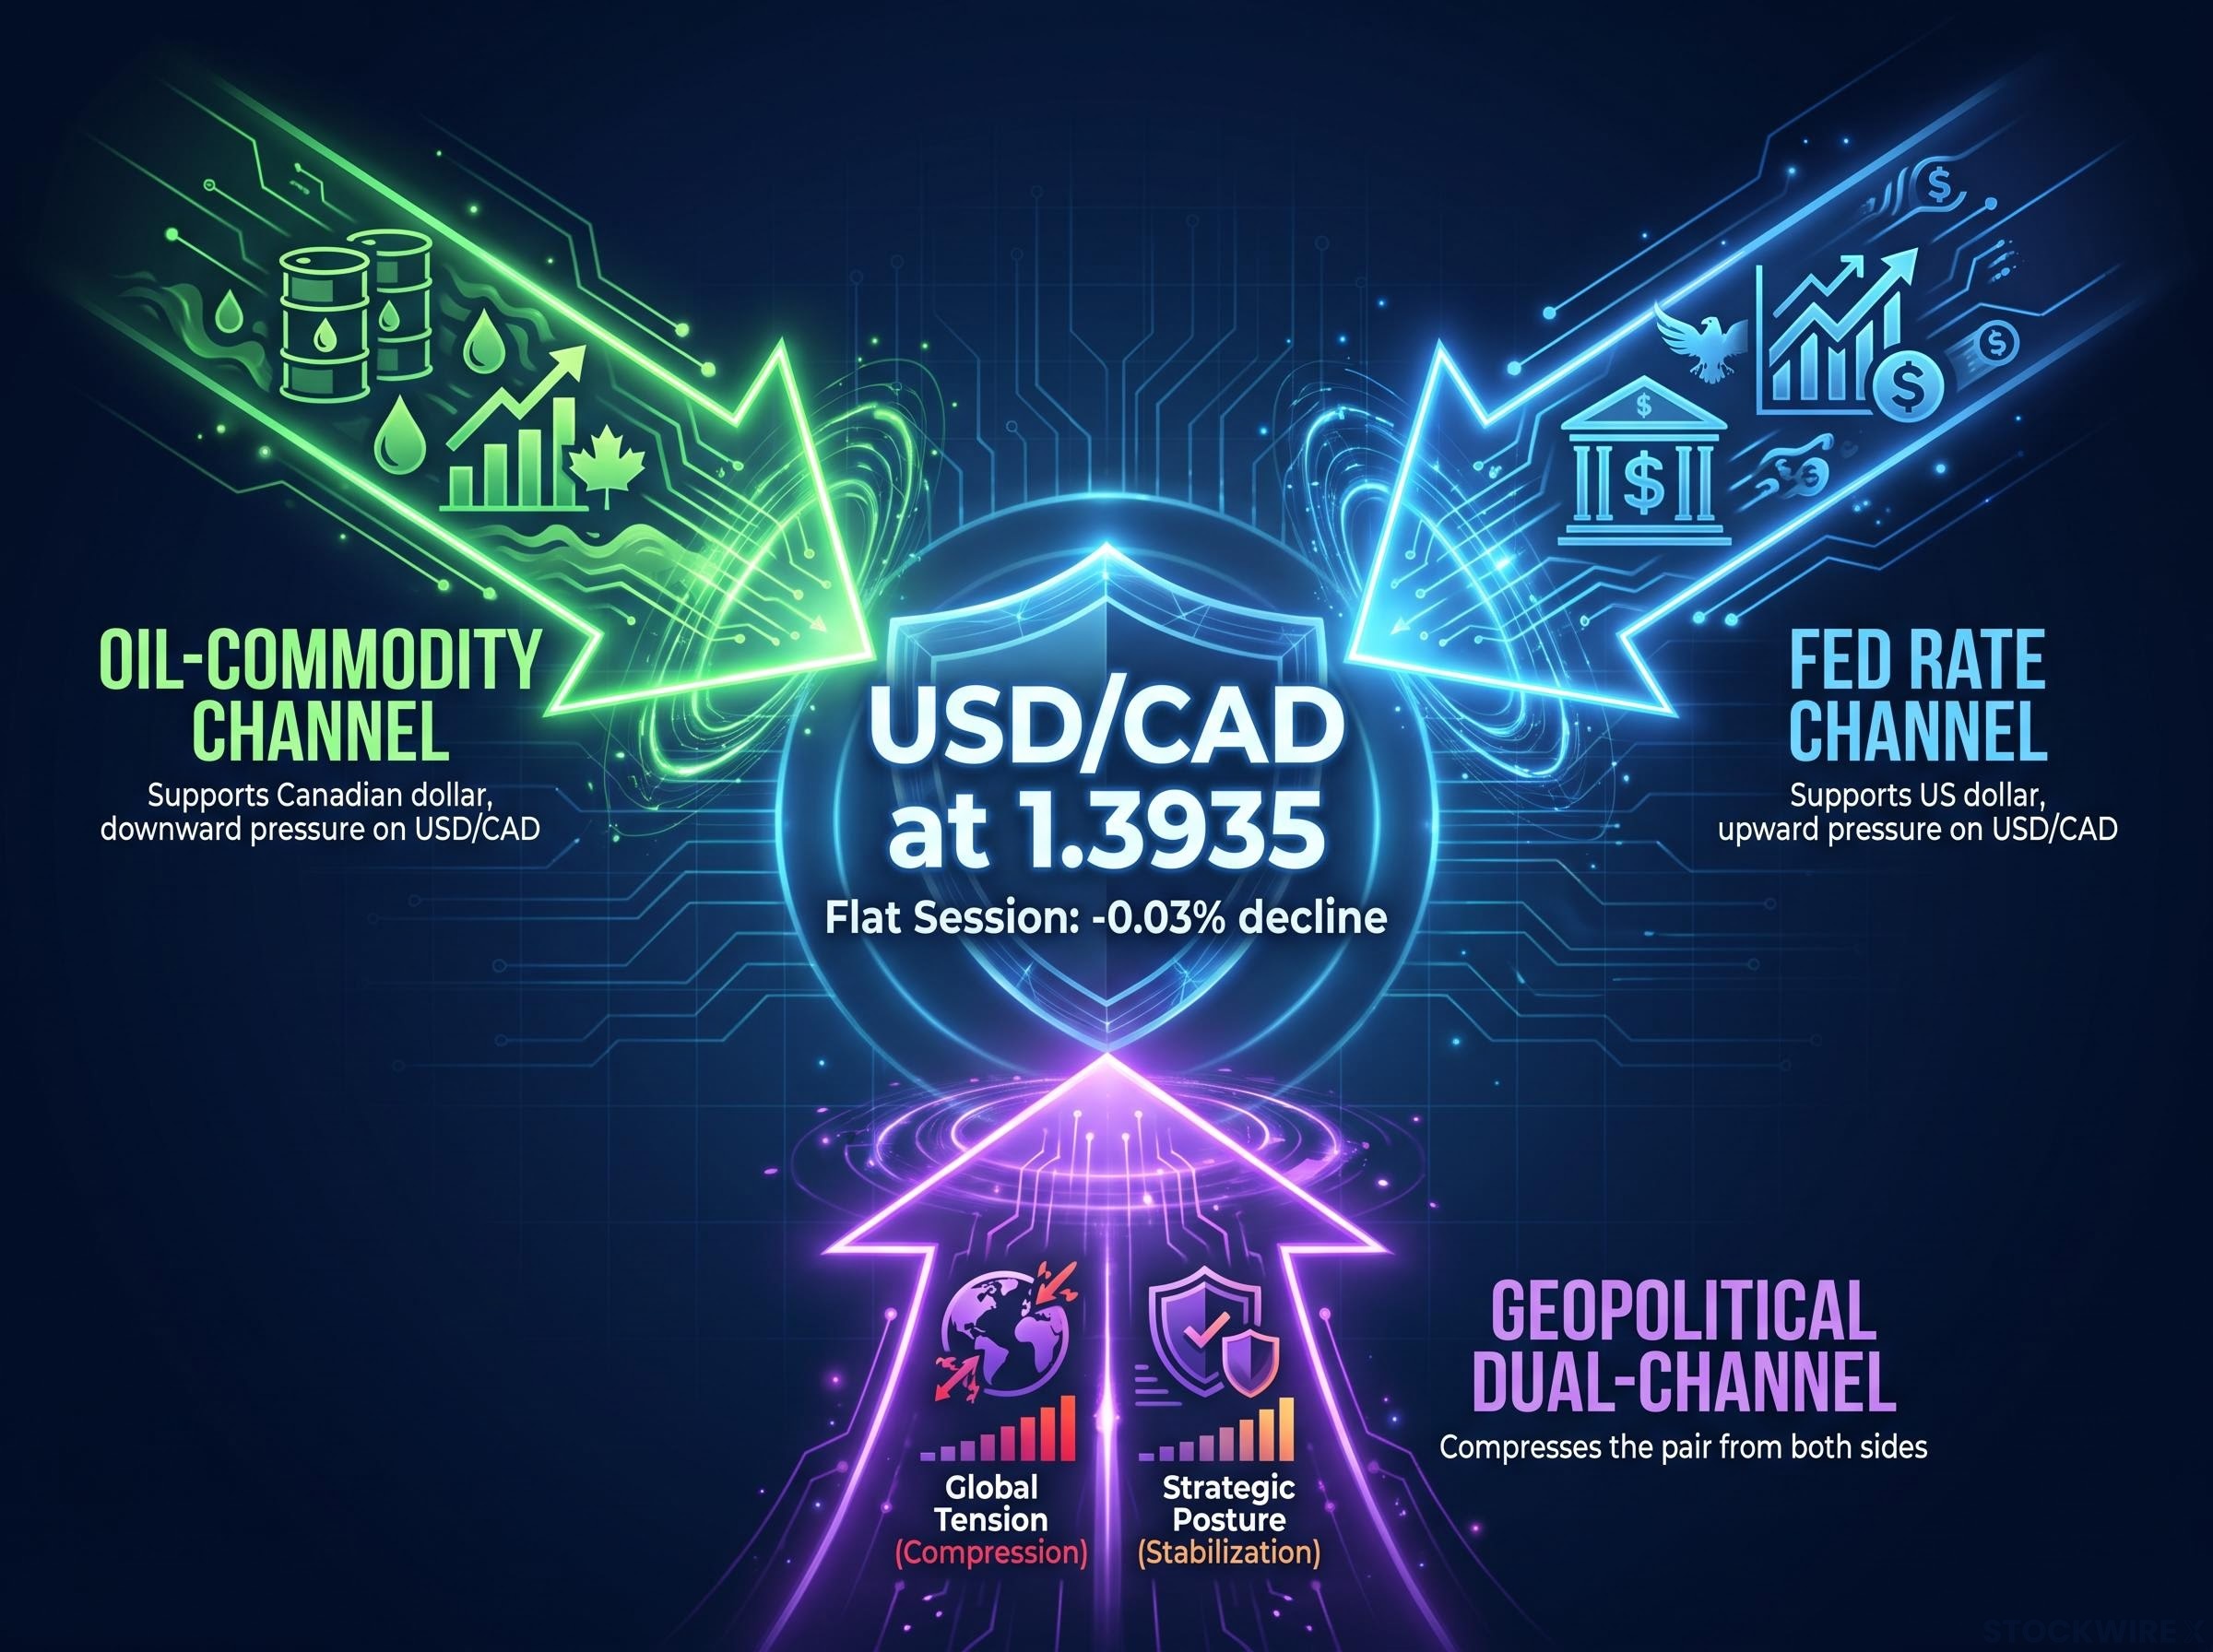
Three channels were doing the holding, each pushing the pair in a different direction:
- Oil-commodity channel: Higher oil prices were supporting the Canadian dollar, putting downward pressure on USD/CAD
- Fed rate channel: US interest-rate expectations were supporting the US dollar, putting upward pressure on USD/CAD
- Geopolitical dual-channel: Middle East tensions were simultaneously boosting oil (CAD-positive) and triggering safe-haven flows into USD (USD-positive), compressing the pair from both sides
When you see a currency pair sitting flat despite active macro forces all around it, the stillness itself is data. It tells you two structural forces are genuinely balanced, and understanding which forces are doing the holding is more useful than watching the daily tick.
When big ASX news breaks, our subscribers know first
Canada as a commodity currency: how oil prices move the dollar
Canada is a major crude oil exporter, and the Canadian dollar is widely treated as a commodity-linked currency. That means its value has a historically positive correlation to oil prices. When oil rises, CAD tends to strengthen. When oil falls, CAD tends to weaken.
The transmission chain is straightforward, and it helps to see it as a sequence:
- Oil prices rise on global markets
- Canada’s export revenues improve, strengthening the country’s trade balance
- Foreign buyers need more Canadian dollars to pay for those exports, increasing demand for CAD
- That increased demand pushes CAD higher, which means USD/CAD moves lower (each US dollar buys fewer Canadian dollars)
Bank of Canada research identifies world energy prices as one of the four primary long-run drivers of the CAD-USD exchange rate, alongside interest-rate differentials, relative inflation, and domestic economic data.
Bank of Canada research on CAD-USD drivers identifies world energy prices alongside interest-rate differentials, relative inflation, and domestic economic data as the four primary long-run forces shaping the exchange rate, a finding that gives the commodity channel its structural rather than episodic character.
In the episode under analysis, oil prices were elevated due to Middle East supply concerns. A strong Canadian jobs report released the preceding Friday added a domestic tailwind. The combination, commodity strength plus solid labour data, was keeping the Canadian dollar well supported.
For you, the practical implication is direct: oil price direction is one of the first inputs to check any time you are tracking USD/CAD. The commodity channel is structural and persistent, not episodic. If you grasp this single link, you will never interpret a Canadian dollar move without checking the crude price chart first.
TSX sector composition makes the commodity-currency link visible in equity form: with Financials, Materials, and Energy together representing roughly 66% of the Canadian index, the same oil-price moves that drive CAD through the commodity channel produce correlated swings in Canadian equity benchmarks, meaning USD/CAD direction and TSX performance are often reading from the same underlying script.
The Federal Reserve’s role as a floor under the US dollar
If the oil-commodity channel explains why CAD was strong, the rate-differential channel explains why USD was strong enough to offset it. These are not contradictory facts. They are two separate mechanisms operating through entirely different plumbing.
Rate differentials and yield-seeking capital flows
Interest-rate differentials, the gap between what the Federal Reserve and the Bank of Canada charge on short-term borrowing, serve as a structural anchor for USD/CAD. When US rates are higher or expected to go higher, global investors buy US bonds and money-market instruments to capture that yield. To do so, they must buy US dollars first. That demand supports the currency.
In this episode, the dynamic was striking. A weaker-than-expected US Nonfarm Payrolls report had landed the previous Friday. Normally, soft jobs data would weaken the dollar. It did not. Rate markets had not abandoned bets on a further Federal Reserve tightening move before the year closed, and that residual hawkish pricing was enough to offset the disappointing payrolls figure.
The lesson for you: Fed expectations can hold the dollar firm even when headline US data is soft. Watching rate pricing matters as much as watching the data itself.
The Fed language shift from the June 2026 FOMC meeting illustrates this dynamic precisely: core PCE holding at 3.4% year-over-year locked in hawkish guidance that drove the DXY back above 100, even as other macro signals remained mixed, demonstrating how rate-market repricing can dominate USD direction independently of any single data print.
Safe-haven demand as a separate support channel
The second source of USD support operates independently of interest rates. The US dollar is the world’s dominant reserve and invoicing currency. In periods of geopolitical or financial stress, global investors raise their allocations to USD assets as a form of insurance. This is commonly called the “risk-off” or safe-haven flow.
This channel was active during the episode. Middle East tensions were generating demand for US dollars that had nothing to do with yield or economic data. It was pure defensive positioning.
The distinction matters for your analysis:
- Rate-differential channel: investors buy USD because US yields are attractive relative to Canadian yields
- Safe-haven channel: investors buy USD because they want the security of the world’s reserve currency during uncertainty
Both were active simultaneously, and together they formed a firm floor under the US dollar, preventing USD/CAD from falling further even as oil-driven CAD strength pushed from the other side.
How Middle East tensions push both sides of the pair at once
Here is the counterintuitive part: the same geopolitical event can be simultaneously bullish for both currencies in a pair. Once you understand the dual-channel mechanism, the tug-of-war price action stops looking puzzling and starts looking logical.
Middle East geopolitical risk was transmitting to USD/CAD through two completely separate channels, pushing in opposite directions:
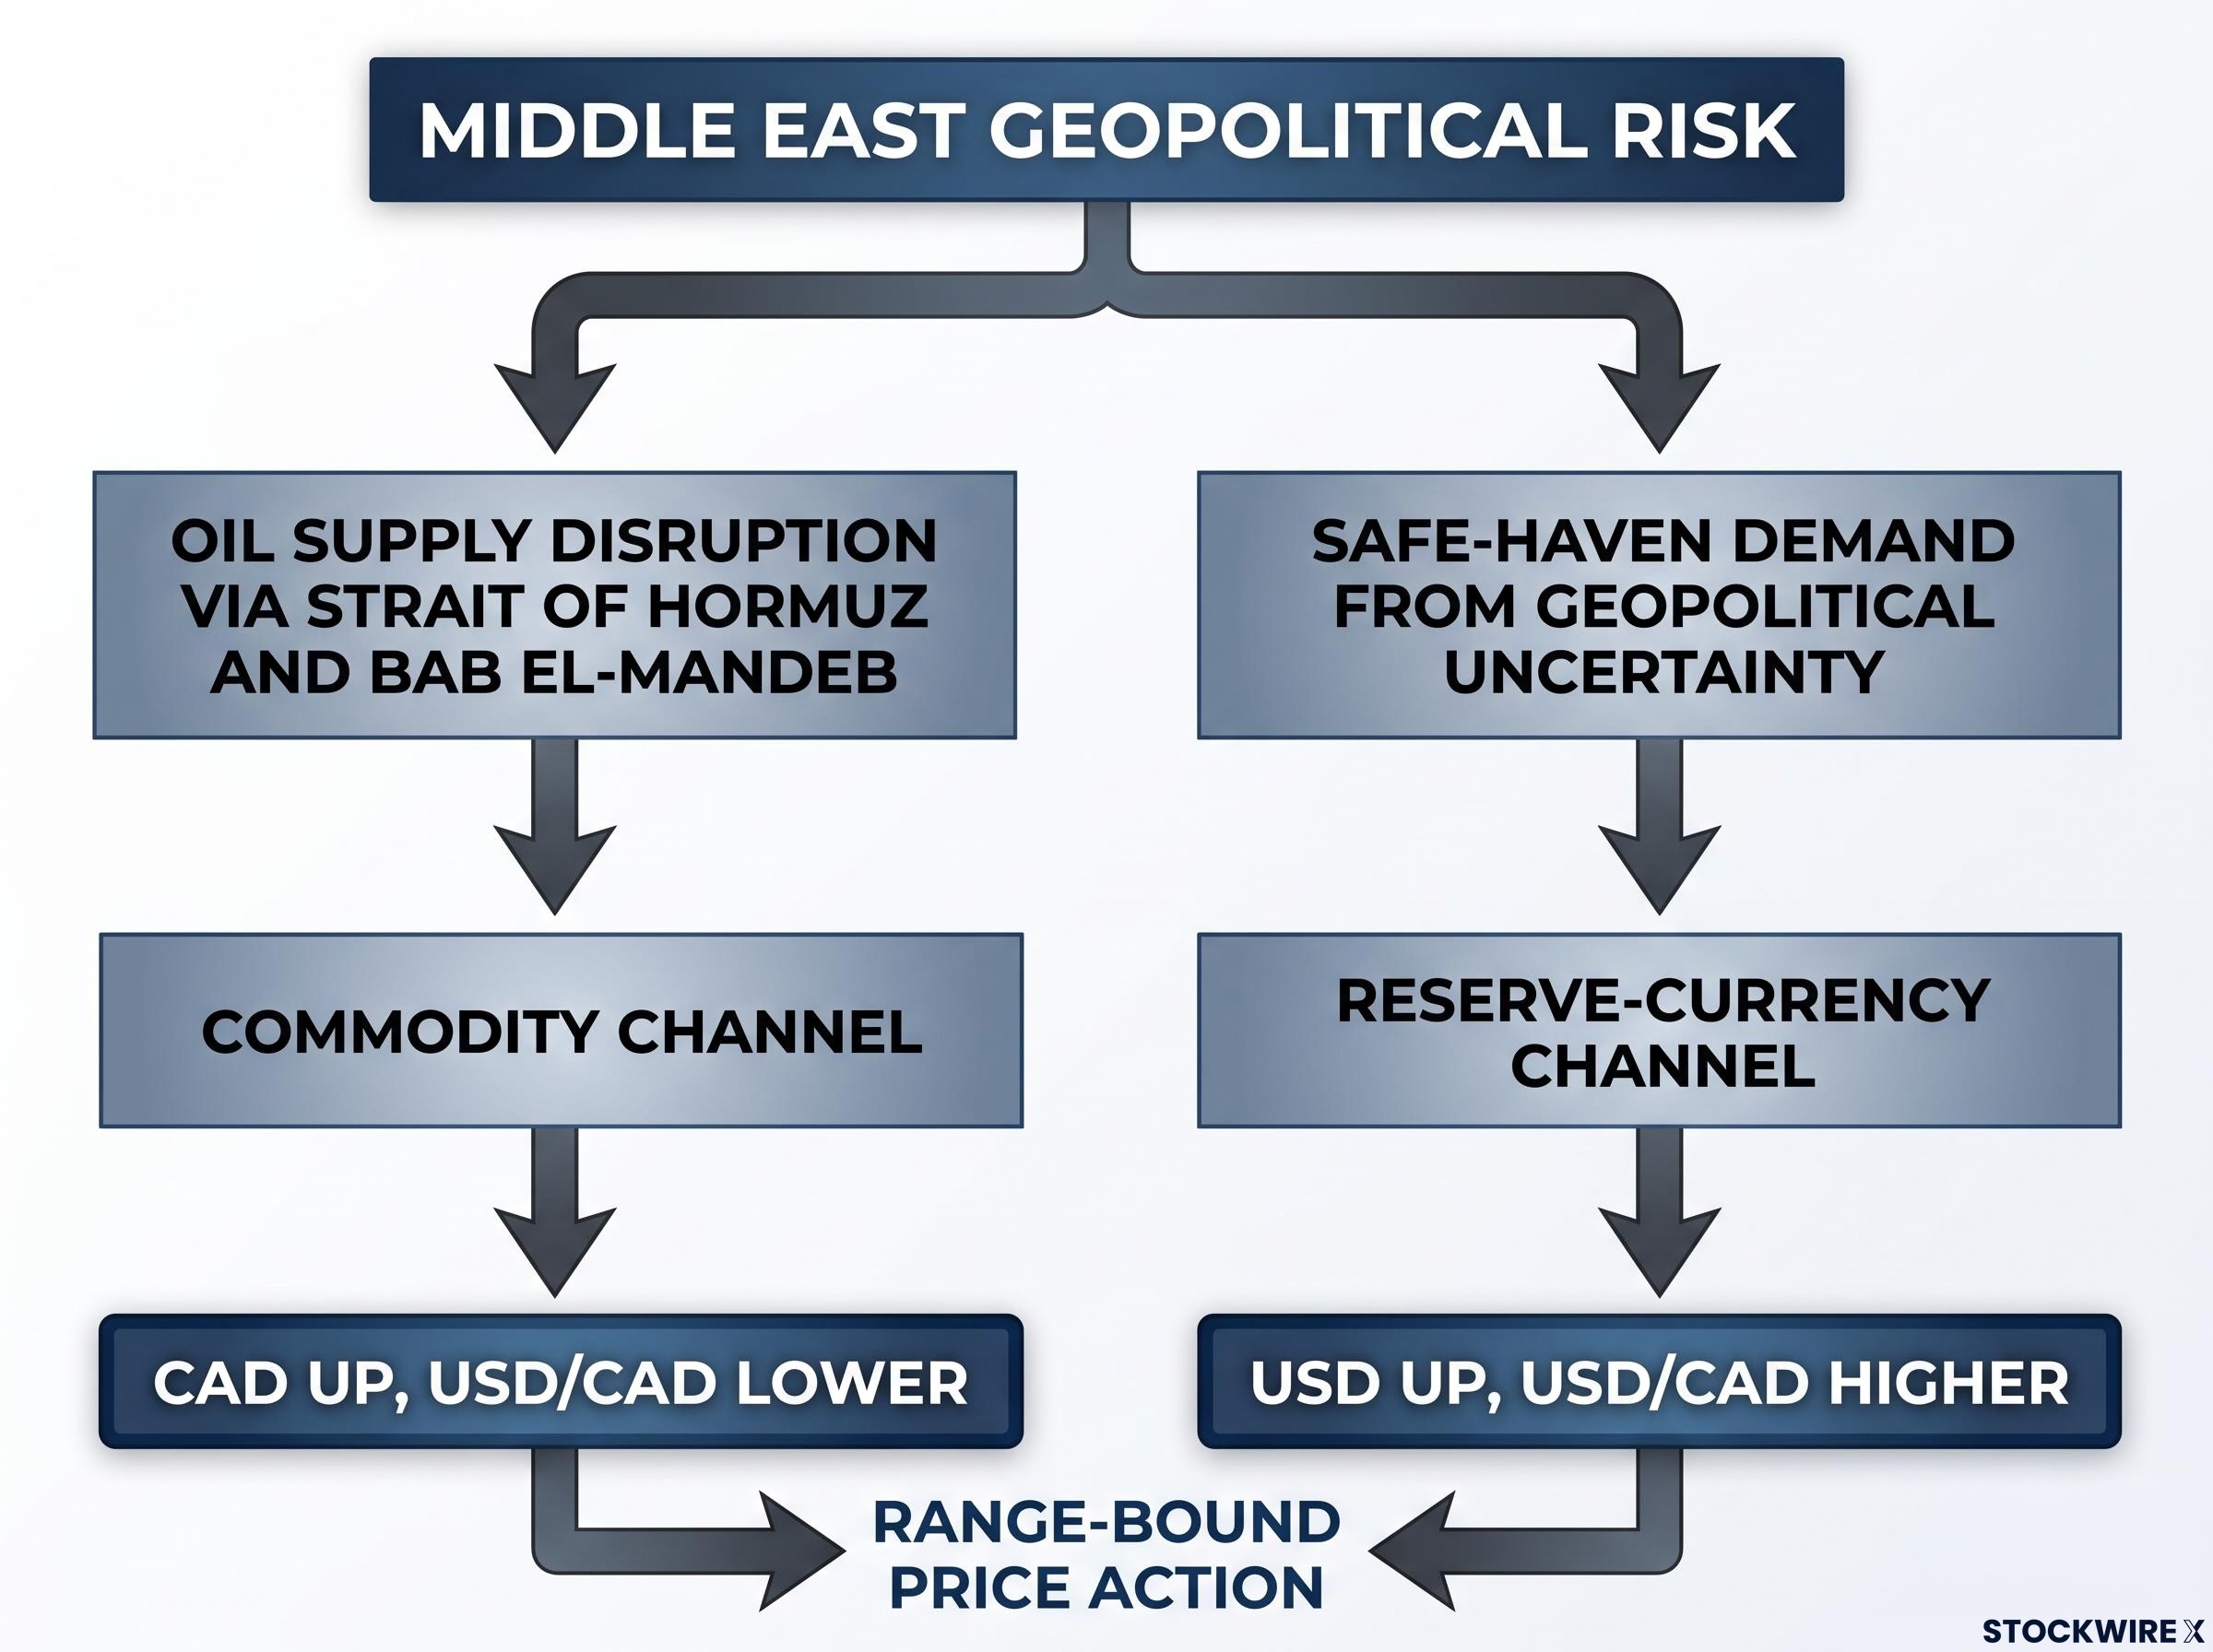
| Geopolitical Event | Channel Affected | Direction on USD/CAD |
|---|---|---|
| Oil supply disruption via Strait of Hormuz and Bab el-Mandeb | Commodity channel | CAD up, USD/CAD lower |
| Safe-haven demand from geopolitical uncertainty | Reserve-currency channel | USD up, USD/CAD higher |
The specific supply disruption context made this dual-channel effect durable, not fleeting. The US-Iran impasse had dimmed prospects for a swift resumption of flows through the Strait of Hormuz, while transit through the Bab el-Mandeb Strait continued to face meaningful interference.
Iranian authorities signalled that Tehran would not re-enter talks with US President Donald Trump’s administration during his current term, with Iranian media indicating that any renewed diplomatic engagement would be deferred until after his presidency ends on 20 January 2029. That removed the most obvious diplomatic off-ramp for easing the supply risk premium.
The result was a risk premium embedded in oil prices that was supporting CAD through the commodity channel, while the same geopolitical uncertainty was supporting USD through the safe-haven channel. When geopolitical events drive both sides of a pair through different channels, range-bound price action is the rational outcome. You should expect compression rather than a directional breakout until one channel clearly dominates the other.
Reading macro data releases through a currency lens
Understanding the channels is one skill. Reading scheduled data releases through those channels is another. The CPI and PPI releases referenced in this episode offer a useful worked example of how to think about any macro print and its currency impact.
The scenario matrix looks like this:
| Data Release | Hotter Than Expected | Softer Than Expected | USD/CAD Direction |
|---|---|---|---|
| CPI | USD-positive (higher Fed tightening probability) | USD-negative (lower tightening probability) | Higher if hot, lower if soft |
| PPI | USD-positive (leading indicator for consumer inflation) | USD-negative (easing inflation pipeline) | Higher if hot, lower if soft |
But the raw direction is only half the story. The magnitude and sometimes even the direction of the market reaction depends on the gap between what printed and what was already priced in. FX markets are forward-looking. They price in expectations in advance. A “hot” CPI print that the market already anticipated may produce almost no move, while a modestly “soft” print against hawkish positioning can produce a sharp reaction.
The three-step process that professional currency analysts use for any data release:
- Identify the consensus expectation before the print arrives. What does the market already think the number will be?
- Compare the actual print to consensus. The surprise, positive or negative, drives the initial reaction, not the absolute value of the number.
- Assess how existing positioning amplifies or dampens the surprise. If everyone was already positioned for a hawkish outcome and the data confirms it, the move may be small. If positioning was complacent, even a modest surprise can produce an outsised reaction.
The weak Nonfarm Payrolls episode illustrates this perfectly. A soft jobs print, which in isolation would be USD-negative, failed to weaken the dollar because hawkish rate expectations and safe-haven positioning had already absorbed the possibility of a weak number. The takeaway for you: before any data release, you need to know what the market is already pricing. Without that context, you cannot predict how the pair will react.
The collapse of the forward guidance regime under Fed Chair Kevin Warsh has made this surprise-versus-consensus dynamic significantly more volatile: without chair-level anchoring of rate expectations, each CPI or PPI print now carries greater pricing weight than it did when the Fed pre-communicated its reaction function, amplifying the magnitude of FX moves on data-release days.
A reusable framework for decomposing any currency pair move
Every section above has built toward this: a portable checklist you can apply the next time you open a USD/CAD chart. The five questions to ask of any move:
- Where is oil? Check the crude price chart first. The commodity channel is structural for CAD, and it operates in every session, not just during geopolitical events.
- What is the Fed-BoC rate differential? Compare current and expected policy rates. The wider the differential in favour of the US, the stronger the floor under the dollar.
- What is the global risk sentiment? Safe-haven flows into USD can support the dollar independently of yield or data. Check whether markets are in risk-on or risk-off mode.
- What macro data just printed, and how did it compare to consensus? The surprise matters more than the number itself. A “strong” print that was fully expected may produce no reaction.
- What was already priced in, and how does positioning shape the reaction? This is the layer that separates data-watchers from data-interpreters.
This episode illustrated a specific type of exchange rate environment: the “balance of forces” configuration, where no single factor dominates and the pair stays compressed. The opposite configuration, where one factor overwhelms the others, produces the directional breakouts you see on high-conviction days.
For longer-horizon analysis, Bank of Canada research highlights additional structural factors worth monitoring:
- Trade policy uncertainty between the US and Canada, which can move CAD independently of standard macro data
- Productivity differentials and fiscal policy trends
- Long-run inflation gaps between the two economies
These factors operate on a slower timescale than daily price action, but they shape the multi-month and multi-year trends that frame every short-term episode.
What this episode tells you about how currencies actually work
Exchange rates are not single-cause phenomena. They are the real-time output of multiple competing forces, and the most instructive episodes are often the ones where the pair barely moves. A flat session reveals the forces at work more clearly than a trending one, because it shows you the balance rather than the winner.
The specific data points in this episode, the oil price level, the CPI release, the Iran deadlock, will change. The channels through which they affect USD/CAD are stable and structural. Oil prices will continue to move CAD through the commodity channel. Fed-BoC rate differentials will continue to anchor USD through the yield channel. Geopolitical risk will continue to push both sides simultaneously through its dual-channel mechanism.
When a currency pair barely moves, the professional question is not “nothing happened.” It is “what is holding it in place?”
Monitor oil price direction, the Fed-BoC rate differential, the geopolitical risk premium in energy markets, and the surprise-versus-consensus dynamic at every major data release. Those four inputs, filtered through the five-question framework above, will give you a clearer read on USD/CAD than any single headline ever could.
For readers wanting to translate the geopolitical risk framework above into portfolio positioning, our dedicated guide to geopolitical investing strategy covers gold allocation targets, safe-haven asset selection, and rebalancing discipline across the 2025-2026 crisis cycle.
This article is for informational purposes only and should not be considered financial advice. Investors should conduct their own research and consult with financial professionals before making investment decisions.