
A company beats earnings expectations, the headline looks strong, and the stock drops anyway. If you have watched that happen and felt wrong-footed, you are not alone. The disconnect between reported profit and market reaction is one of the most common sources of confusion in earnings season.
Two companies can both post earnings-per-share (EPS) beats in the same quarter, and one gets rewarded while the other gets punished. The difference is not the profit number itself but whether that profit converted into real cash. Morgan Stanley’s research from the current earnings season quantifies the gap, and it is wider than most investors expect.
After reading this, you will know exactly which number to check after any earnings release, why it tells you something EPS alone cannot, and how to run three checks that separate cash-backed earnings from accounting-only results.
What EPS actually measures, and where it stops
You have been trained to treat EPS as the definitive measure of a company’s profitability. It is the number every headline leads with, the number analysts forecast, the number that determines whether a company “beat” or “missed.” That confidence is worth questioning.
EPS equals net income divided by shares outstanding. Net income, the numerator doing all the work, is an accounting figure governed by accrual rules, not a cash count. That means it includes items that never touched the company’s bank account. The following non-cash items all move EPS without moving actual money:
- Depreciation and amortisation (spreading the cost of assets over time)
- Stock-based compensation (paying employees in equity rather than cash)
- Goodwill impairments (writing down the value of past acquisitions)
- Revenue recognised before cash arrives (booking a sale when the contract is signed, not when the customer pays)
Two companies with identical EPS can have radically different cash realities depending on how aggressively each applies these accounting choices. One might be collecting cash faster than it books revenue. The other might be reporting profit while its bank balance shrinks.
The earnings expectations gap is the mechanism behind one of the most disorienting patterns in earnings season: a company posts record profits and the stock falls anyway, because markets price the delta between results and prior expectations, not whether the numbers are good in absolute terms.
When you look at an EPS figure, you are looking at an estimate shaped by accounting conventions, not a direct readout of the cash the business generated. That distinction is the foundation for everything that follows.
When big ASX news breaks, our subscribers know first
How free cash flow reconnects earnings to reality
Free cash flow (FCF) exists specifically to solve the problem EPS creates. Its formula strips away the accounting layer and asks a simpler question: how much cash did the business actually generate after spending what it needed to keep operating?
Free Cash Flow = Operating Cash Flow minus Capital Expenditures
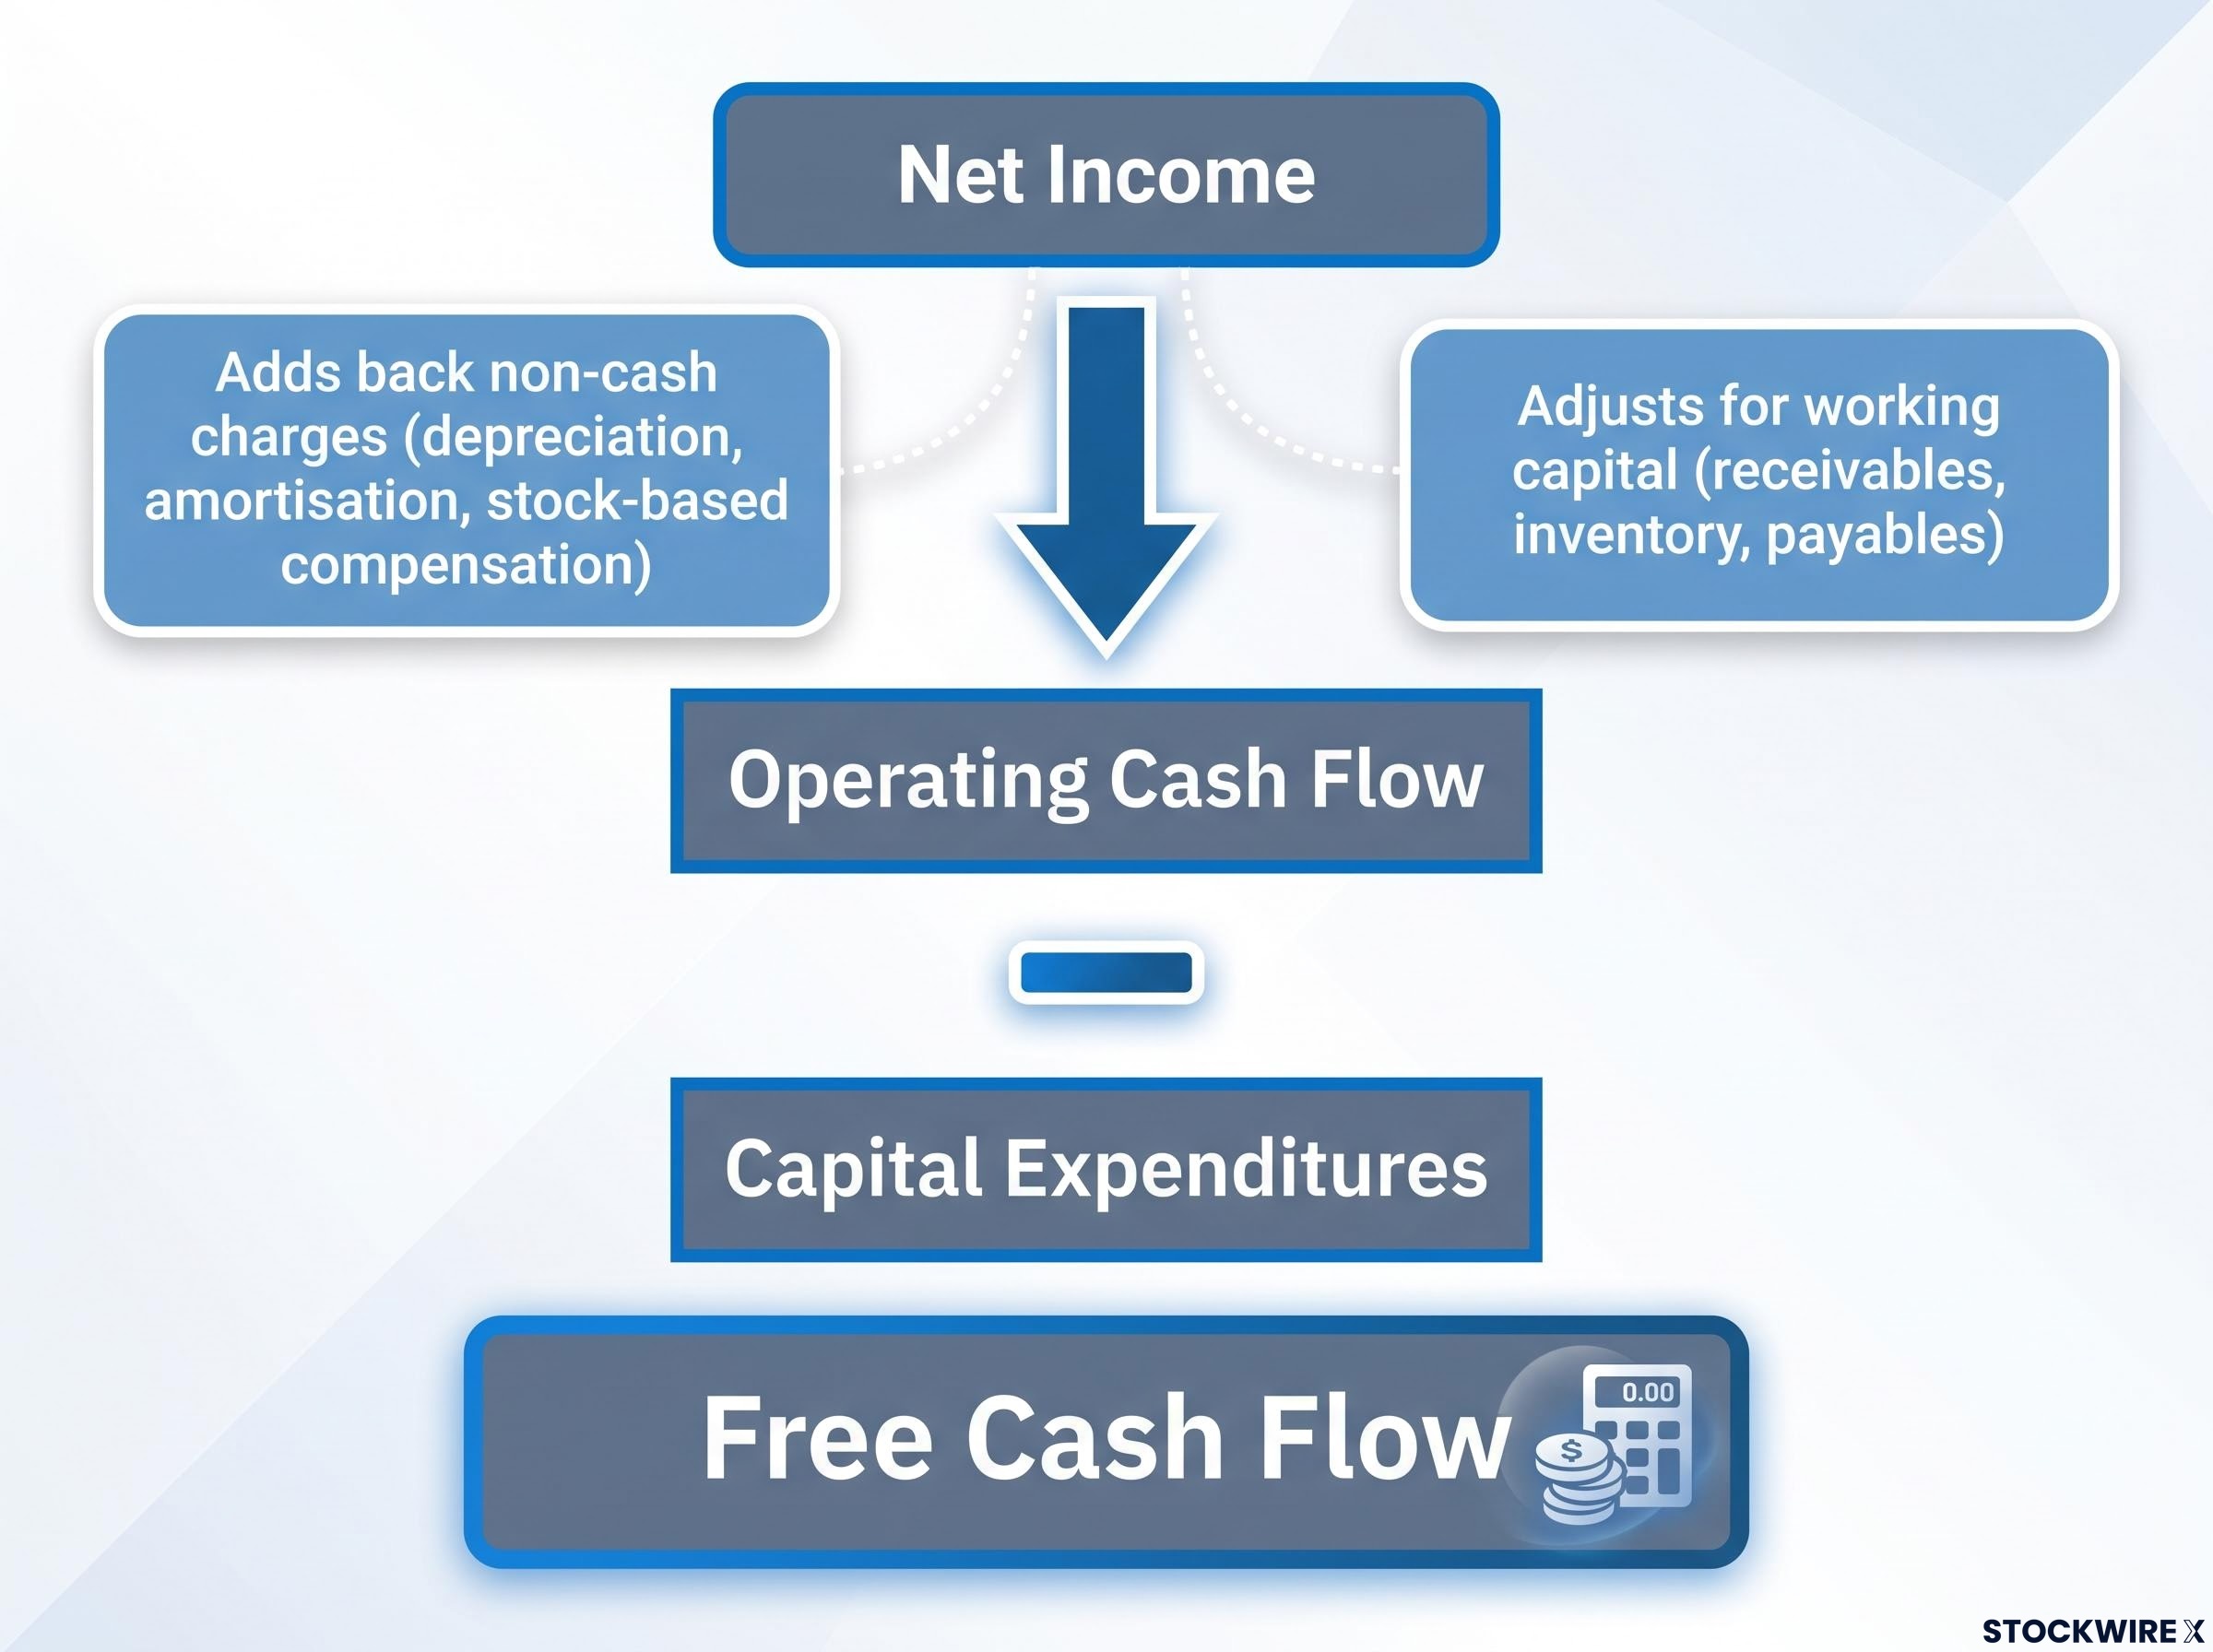
Each component does specific work. Understanding why they are there, not just what they are, is what makes this metric useful to you.
What operating cash flow actually adjusts for
Operating cash flow starts from net income, the same number EPS uses, but then reverses the accounting adjustments that made EPS unreliable as a cash measure. It adds back non-cash charges like depreciation and stock-based compensation. Then it adjusts for working capital changes: movements in receivables, inventory, and payables.
This working capital layer is where the real signal sits. If a company’s receivables are growing faster than its revenue, that tells you it is booking sales but not collecting the cash. If inventory is piling up, the business is spending cash on products it has not sold yet. Operating cash flow captures both of these dynamics. EPS captures neither.
Why CapEx belongs in the calculation
Capital expenditures, the cash a company spends on equipment, facilities, and infrastructure, never show up as an EPS drag in the quarter they occur. Accounting rules spread that cost over years through depreciation. But the cash leaves the business immediately.
A company burning large amounts of CapEx to maintain operations is consuming cash that never appears in the EPS calculation. What remains after subtracting CapEx from operating cash flow is the cash genuinely available to repay debt, pay dividends, buy back shares, or reinvest. That is what ultimately funds your returns as a shareholder. Stock valuation rests on the present value of future cash flows, not future accounting earnings. FCF captures those flows directly; EPS only approximates them.
Discounted cash flow valuation discounts projected future free cash flows at a required return hurdle, making FCF the central input to any rigorous stock price estimate — which is why the FCF yield check in this framework connects directly to the intrinsic value calculation long-term investors use to judge whether a stock is cheap or expensive.
What Morgan Stanley’s data reveals about the market’s current judgment
The conceptual case for FCF over EPS is well established. What makes it actionable right now is that the market is quantifiably pricing the difference during the current earnings season.
Morgan Stanley strategists, led by Michael Wilson, examined S&P 500 companies based on their 2026 EPS and FCF estimate revisions as of 10 August 2026. They split companies into two groups. Both groups beat on earnings. The question was whether those earnings were backed by cash.
When analysts revised both EPS and FCF estimates upward, those stocks gained 1.6% relative to peers following their results. Where EPS revisions moved higher but FCF projections were cut, the picture reversed, with those stocks trailing by 0.2% on a relative basis.
That produces an approximate 1.8-percentage-point performance gap between stocks whose earnings converted to cash and stocks whose earnings did not.
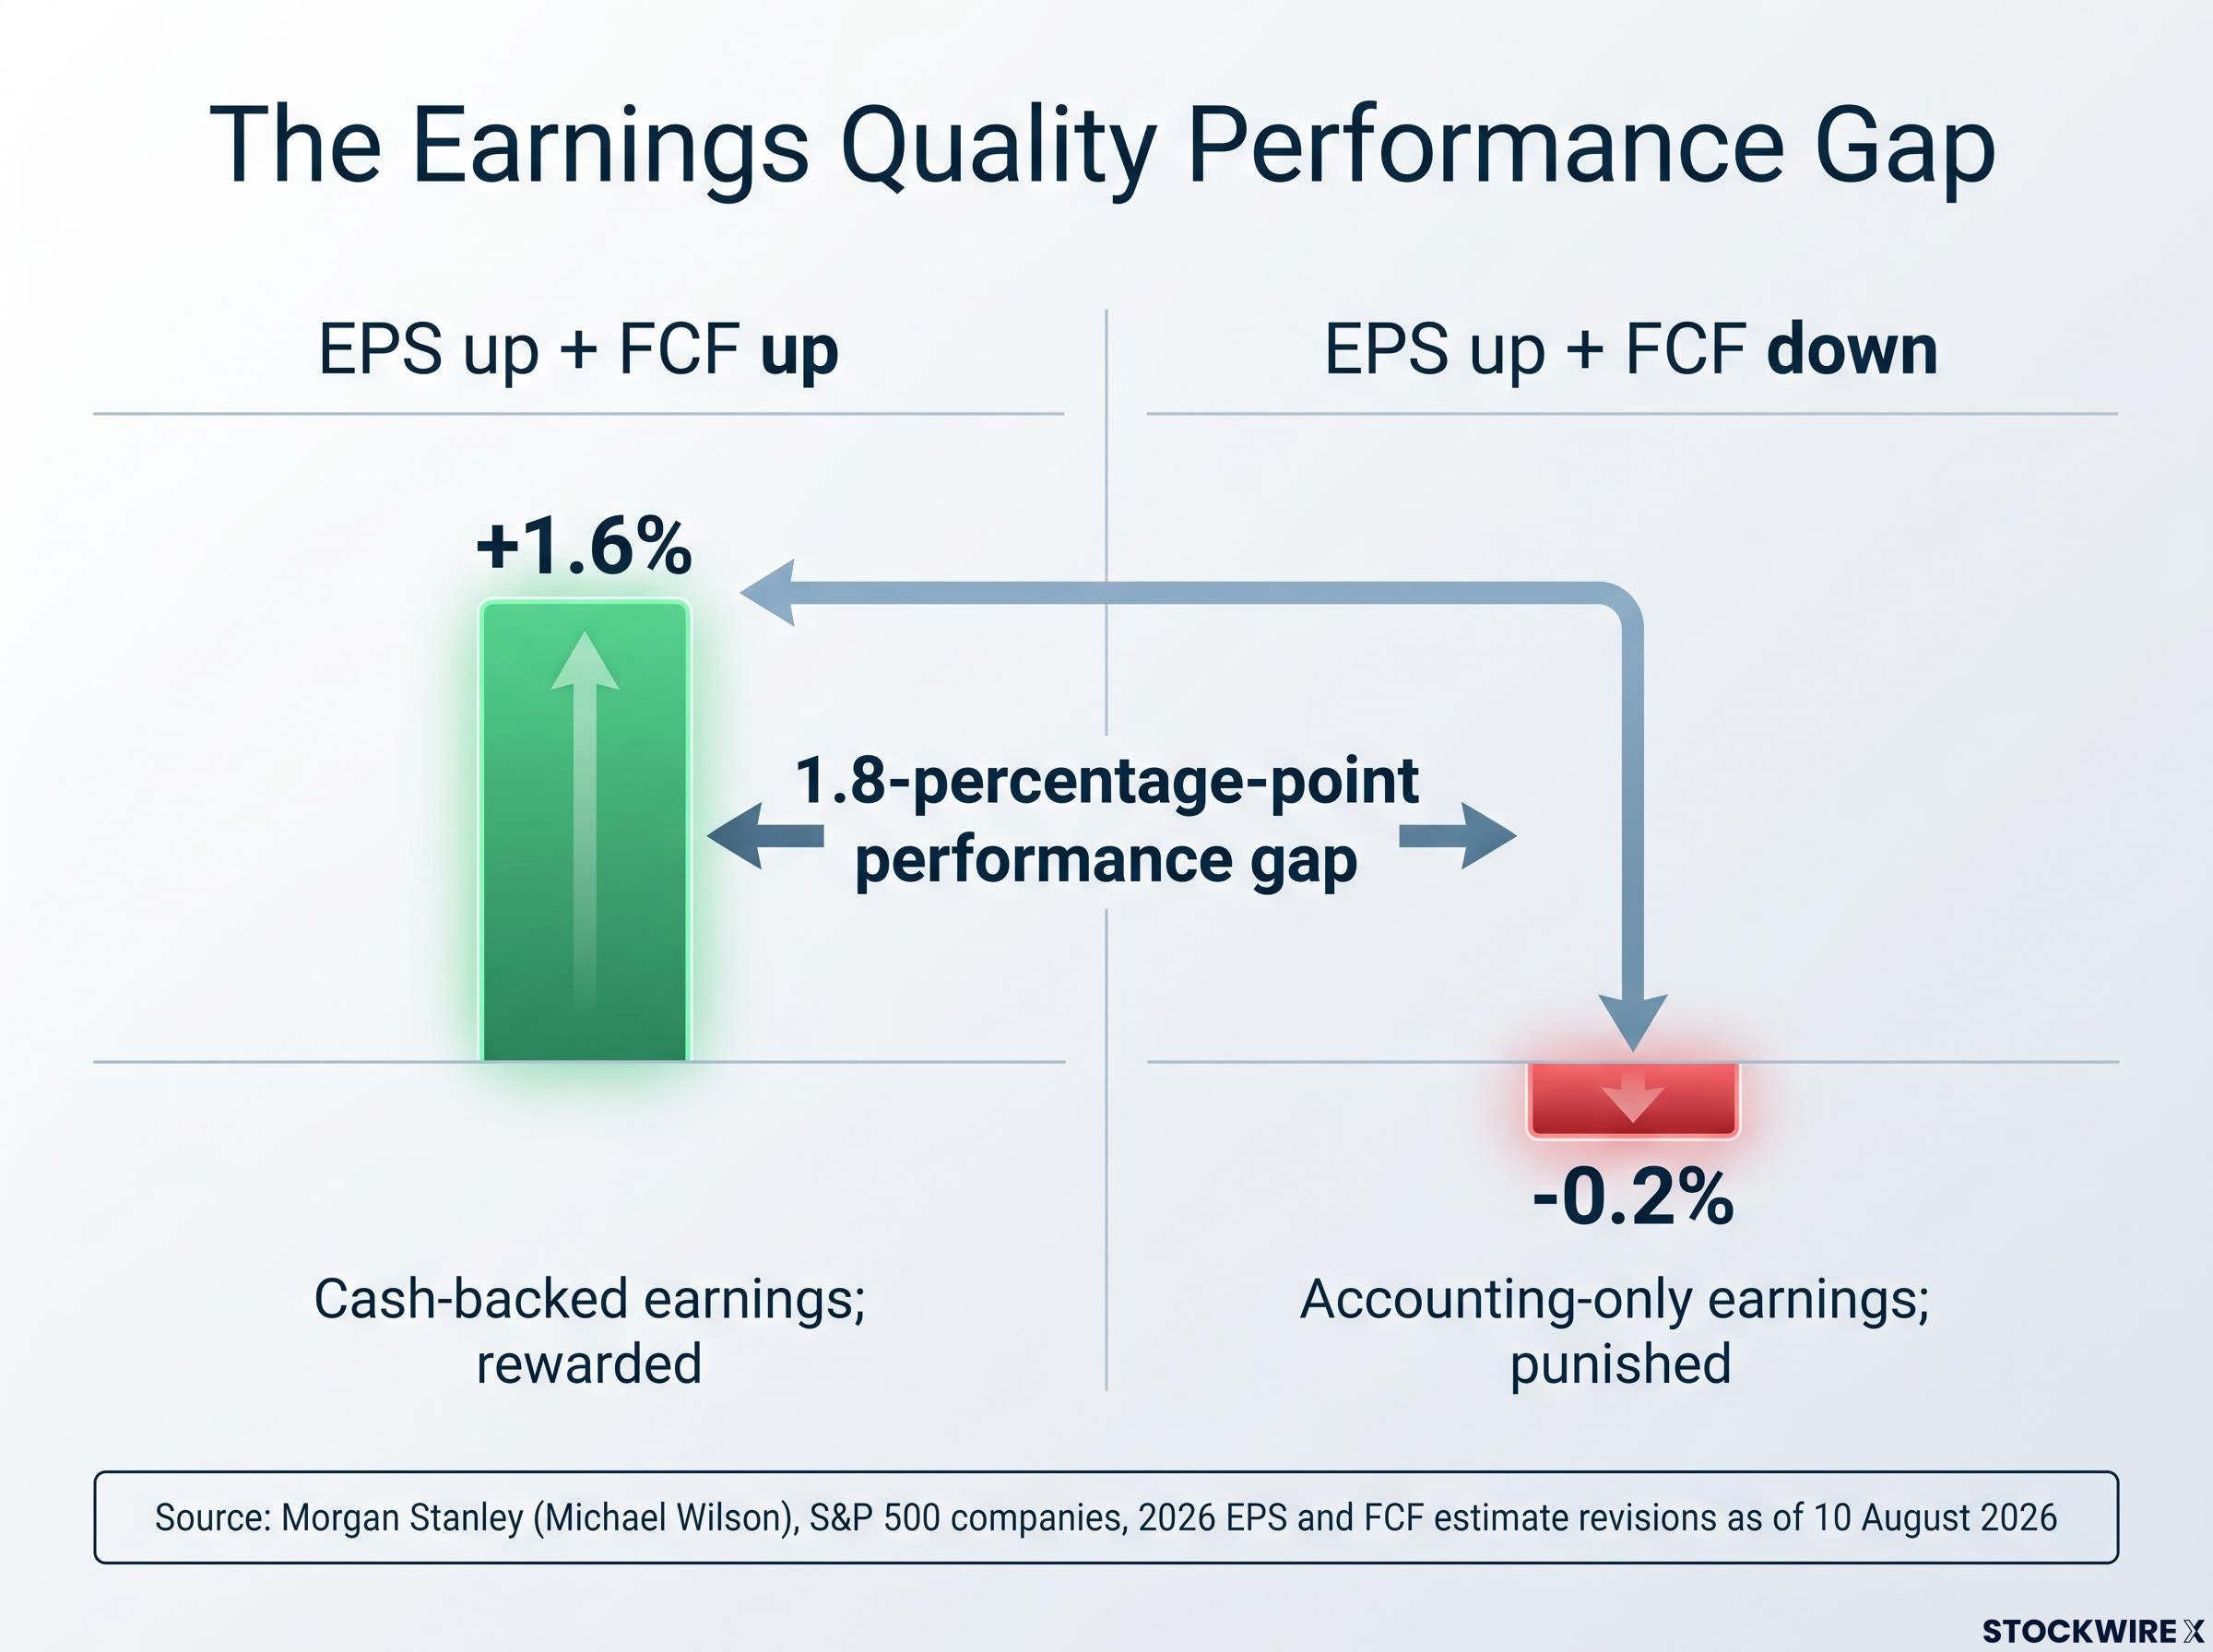
“Reported profits are not enough; the market is paying up only when those profits look cash-real, not accounting-optical.”
| Attribute | EPS up + FCF up | EPS up + FCF down |
|---|---|---|
| EPS revision direction | Upward | Upward |
| FCF revision direction | Upward | Downward |
| Relative performance | +1.6% | -0.2% |
| Market interpretation | Cash-backed earnings; rewarded | Accounting-only earnings; punished |
For you as a stock picker, this data means the market is already running an earnings-quality filter in real time. Any investor who ignores FCF estimate revisions after an earnings release is working with an incomplete picture of how the market will respond, even when the company technically “beats.”
Three checks any investor can run after an earnings release
You do not need institutional research or proprietary data to apply this framework. Three checks, all using publicly available information, build a complete earnings-quality picture. They work as a sequence, not a menu.
- Cash Conversion Ratio: Is the profit backed by cash?
- Formula: Operating Cash Flow divided by Net Income.
- Ratios consistently near or above 1.0 indicate well-backed earnings.
- A downward trend, for example from 1.1 to 0.6 over several years, signals slipping earnings quality, often due to aggressive revenue recognition, weaker collections, or rising capitalised costs.
- FCF Yield: Are you paying a fair price for the cash the business generates?
- Formula: Free Cash Flow divided by Market Capitalisation.
- A high P/E combined with a low FCF yield often means you are paying for earnings that do not convert into much cash.
- A moderate P/E combined with a solid FCF yield indicates more room for sustainable dividends, buybacks, and reinvestment without new financing.
- Dual-direction estimate revision check: What are analysts really saying?
- EPS up plus FCF up is the pattern the market rewards.
- EPS up plus FCF down is the quality warning pattern, precisely the signal Morgan Stanley’s research quantified as producing a 1.8-percentage-point performance gap.
After running those three checks, open the cash flow statement and scan for these four warning signs:
| Warning sign | What it looks like | What it signals |
|---|---|---|
| Cash from operations vs. net income | Widening gap where cash lags earnings | Reported profits are outrunning actual cash collection |
| Rising CapEx with flat or declining FCF | Growing capital spending without growing free cash | The business needs ever-greater investment to sustain reported earnings |
| Rapid receivables or inventory growth | Both growing faster than sales | Earnings are being propped up by looser credit or unsold stock |
| FCF below dividends plus buybacks | Shareholder returns exceed cash generation | Returns are funded by debt or asset sales, not the business itself |
Any earnings release can be evaluated in 15 minutes using these publicly disclosed numbers. The stock that looks like a beat on the surface may reveal a very different story when the cash flow statement is opened.
A rigorous earnings report analysis goes beyond confirming an EPS beat, checking revenue source, GAAP-to-non-GAAP gaps, margin direction, and forward guidance alongside the cash flow statement to determine whether a reported quarter reflects genuine business momentum or manufactured results.
Why higher rates make cash conversion more important than it used to be
This is not a new concept being discovered. It is a durable principle that was masked for a decade.
In the years following 2008, interest rates sat near zero and capital was cheap. Investors routinely tolerated weak cash conversion because the penalty for poor cash discipline was small. A company burning through cash to grow could always refinance at low cost. Growth visible in EPS but invisible in FCF was accepted, even celebrated, across broad swathes of the market.
That tolerance has evaporated. With higher rates and a tighter cost of capital persisting through 2026, the economics have shifted:
- Low-rate era: Weak cash conversion tolerated. Companies could fund growth gaps with cheap external financing. The market rewarded headline EPS growth regardless of cash backing.
- Current higher-rate environment: Companies whose growth is EPS-visible but cash-invisible face a structural disadvantage. They need external financing for what they cannot fund internally, and that financing is now expensive.
Companies with strong, improving FCF enjoy compounding flexibility: self-funded investment, balance sheet strength, and shareholder returns that do not depend on credit markets staying accommodating. That flexibility is worth more when capital is expensive, which is exactly why the market is attaching a quality premium to cash-backed earnings right now.
“Treat free cash flow and cash conversion as first-class metrics alongside EPS. Any earnings story that does not eventually show up as more cash per share should now be treated with scepticism.”
For you, the rate environment means the quality premium the market is attaching to cash-backed earnings is not a temporary factor rotation. It is a rational repricing that is likely to persist as long as capital remains expensive.
What the cash premium changes about how you screen stocks this earnings season
EPS tells you what the accountant computed. FCF tells you what the business actually generated. Both matter, but only one ultimately funds your returns.
The next time an earnings release lands in your feed, here is the sequence that puts this framework to work:
- Check both revision directions. Look at whether analysts revised EPS estimates up or down, and then do the same for FCF estimates. EPS up plus FCF up is the pattern that earned a 1.6% relative outperformance in Morgan Stanley’s data. EPS up plus FCF down is the quality warning that produced a 0.2% underperformance, a 1.8-percentage-point gap between the two.
- Open the cash flow statement. Scan for the four warning signs: widening gap between cash from operations and net income, rising CapEx with flat FCF, rapid receivables or inventory growth, and shareholder returns exceeding cash generation.
- Compute FCF yield as a valuation check. Divide free cash flow by market capitalisation. If the P/E looks attractive but the FCF yield is thin, the earnings you are paying for may not convert into the cash returns you expect.
Strong FCF alone is not a buy signal, and weak FCF alone is not automatically a reason to sell. This is a filter that improves your decision quality, not a mechanical rule. But the cost of ignoring it, a 1.8-percentage-point performance gap in the current earnings season, is now quantified. Applying it requires no proprietary data, only a cash flow statement and the discipline to check two estimate revision directions rather than one.
Cash-based stock screening applied at the portfolio construction level extends the earnings-quality framework into a pre-filtered investment universe; Morgan Stanley’s Russell 1000 screen ranks companies by cash-to-enterprise-value and projected FCF growth precisely because traditional P/E ratios have lost their discriminating power at current valuations.
This article is for informational purposes only and should not be considered financial advice. Investors should conduct their own research and consult with financial professionals before making investment decisions. Past performance does not guarantee future results.