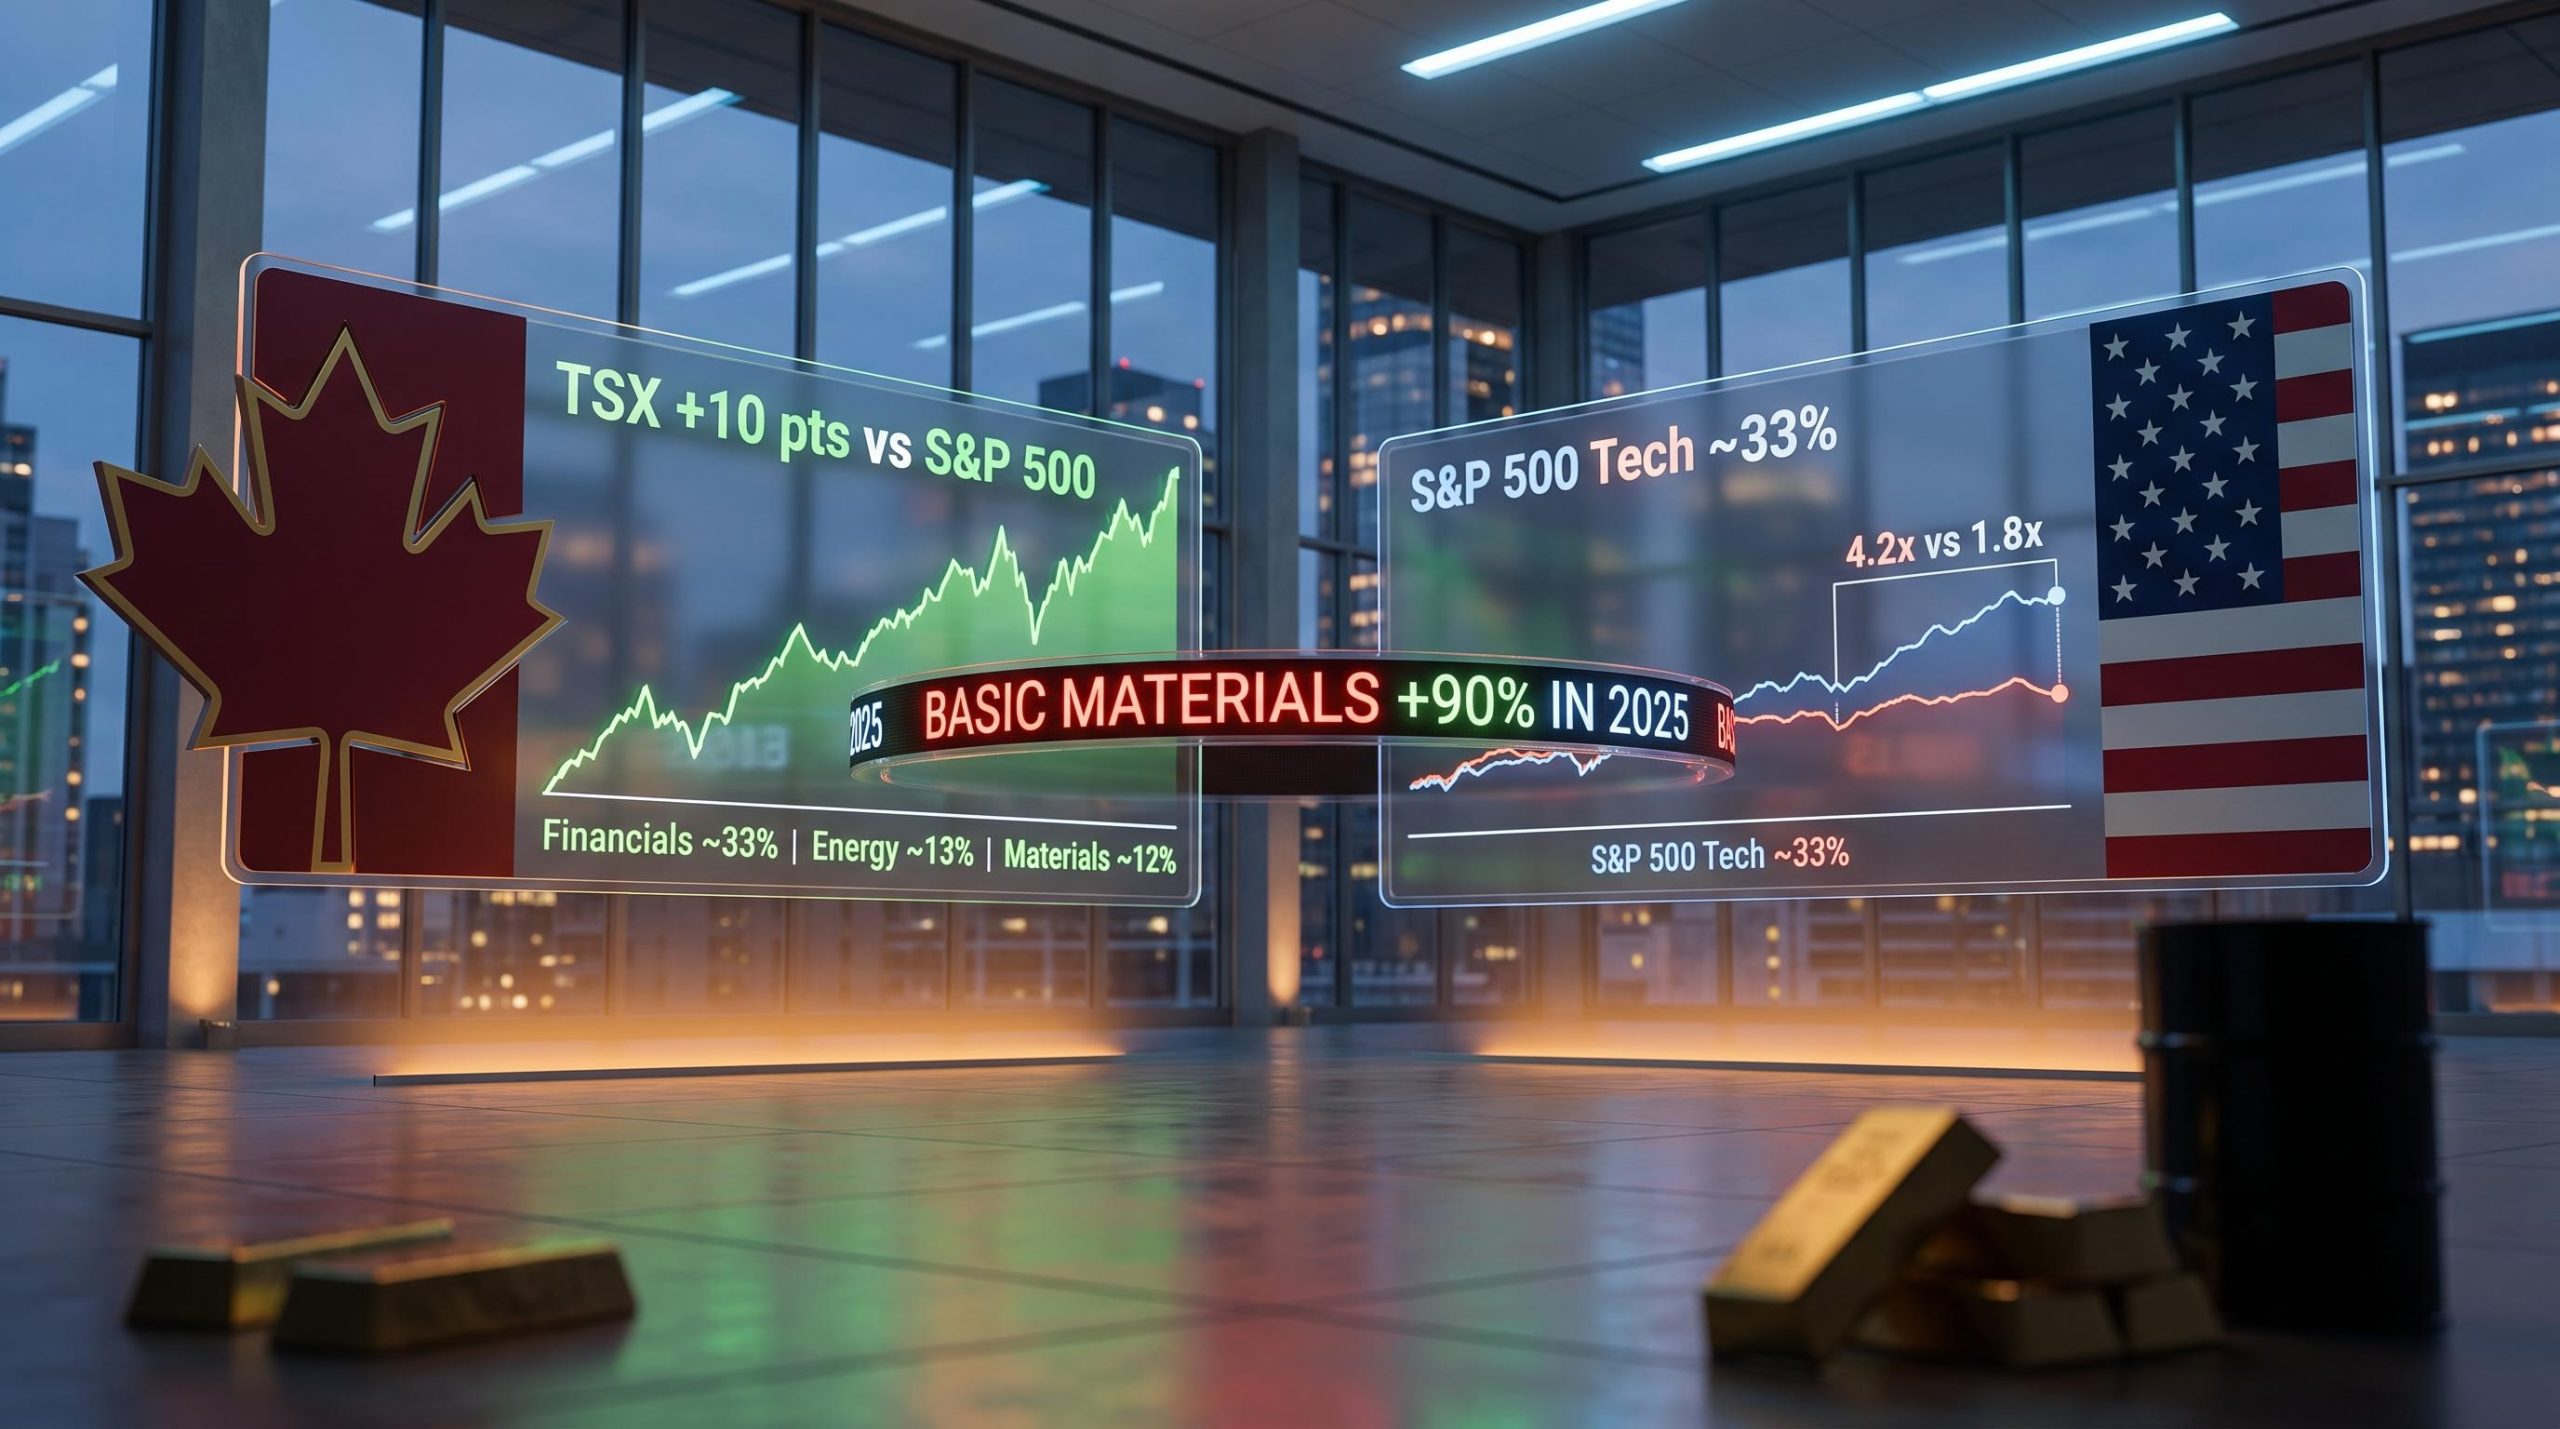
Canada is not a tech story, an innovation story, or a growth story. It is a banks, gold, and energy story. And for the past two years, that has been exactly what the market rewarded.
The S&P/TSX Composite has outperformed the S&P 500 by a meaningful margin over the recent cycle, inverting a long period where US equities dominated global comparisons. The reasons trace back to sector composition, valuation, and a macro environment that turned temporarily hostile to US mega-cap growth stocks. Understanding why this happened matters more than the raw scorecard.
Here is the framework for reading the Canadian vs US stocks comparison not as a national contest but as a sector and valuation story, and for deciding what, if anything, it should change in your own allocation.
Two very different machines under the hood
Comparing the S&P/TSX Composite to the S&P 500 is not comparing two versions of the same instrument. The TSX Composite accounts for roughly 70% of the total equity market capitalisation traded on the Toronto Stock Exchange. The S&P 500 covers approximately 80% of US market capitalisation. Both are broad benchmarks, but what sits inside them could not be more different.
The geographic label is a sector proxy. Owning Canada means owning banks, commodities, and dividends. Owning the US means owning growth, technology, and global platform companies.
US index concentration has reached historic extremes, with five mega-cap stocks controlling approximately 23% of the broad market benchmark and driving the majority of both Q1 2026 losses and April’s subsequent recovery, a dynamic that makes the S&P 500’s tech-heavy tilt both its greatest strength and its most significant structural vulnerability.
| Attribute | S&P/TSX Composite (Canada) | S&P 500 (US) |
|---|---|---|
| Dominant sectors | Financials, materials, energy | Technology, health care, consumer discretionary |
| Tech weight | Small | Very large; mega-cap tech dominates |
| Style tilt | Value, higher dividends | Growth, mega-cap technology |
| Dividend profile | Higher yield; income-heavy total return | Lower yield; capital appreciation-driven |
Where the weight actually sits
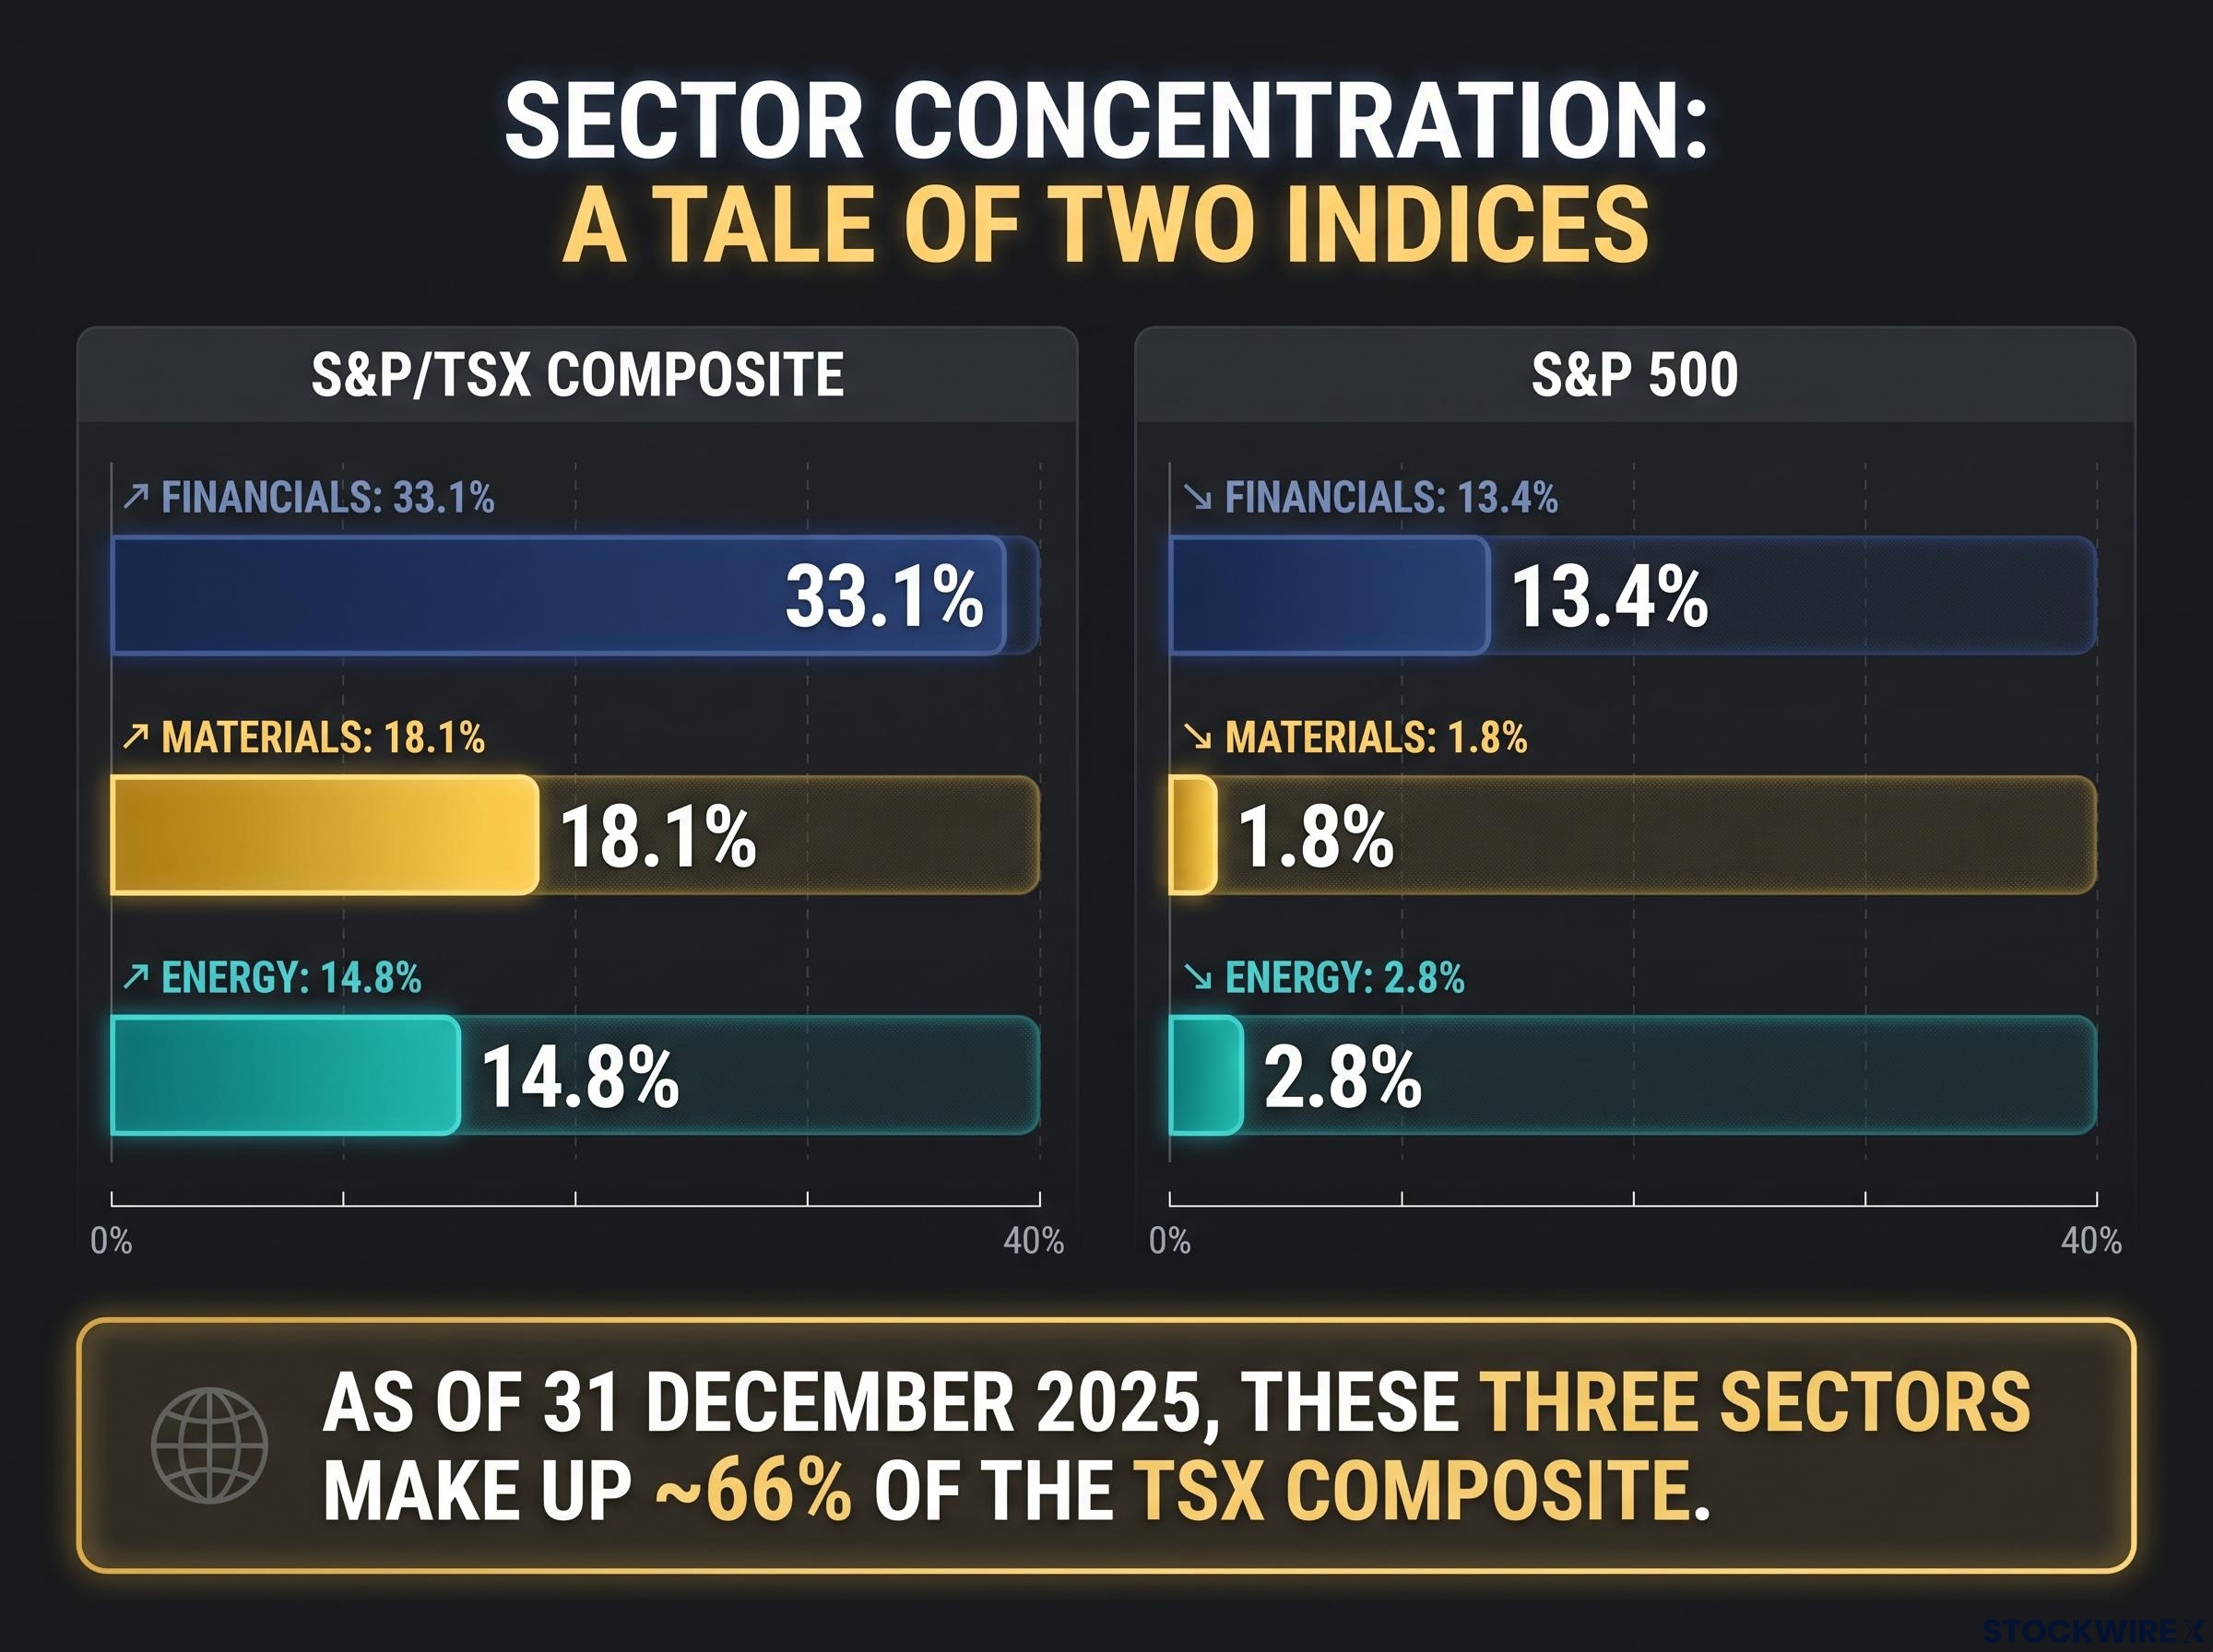
As of 31 December 2025, the sector concentration gap between these two indices is stark.
TSX Composite top three sector weights:
- Financials: approximately 33.1%
- Materials: approximately 18.1%
- Energy: approximately 14.8%
S&P 500 equivalent weights:
- Financials: approximately 13.4%
- Materials: approximately 1.8%
- Energy: approximately 2.8%
Every time you buy a broad Canadian index fund, you are making an implicit bet on commodities, banks, and dividends, whether you realise it or not. The TSX leans value and income; the S&P 500 leans growth and mega-cap technology. That structural gap is the starting point for everything that follows.
When big ASX news breaks, our subscribers know first
What drove Canada’s recent run
The TSX Composite returned approximately 26-32% (in Canadian dollars) in 2025, depending on the data source and exact measurement period. The S&P 500 returned approximately 17-18% over the same window. That gap, roughly 10-12 percentage points, represents one of the widest instances of Canadian outperformance in a rising market in decades.
Four drivers explain the gap, in approximate order of contribution:
- Materials and gold strength: The Basic Materials sector rose over 90% in 2025 and contributed more than one-third of the TSX’s total return, despite representing only approximately 12% of the index at the start of the year (the weight had shifted to approximately 18.1% by year end). The S&P 500, with less than 2% materials weight, captured almost none of this tailwind.
- Bank and financial sector stability: Canadian banks, operating within a heavily regulated oligopoly of six major institutions, delivered resilient earnings and dividends. The financials sector forms roughly one-third of the TSX, so its contribution to index-level returns is outsised.
- Cheaper starting valuations: The TSX entered the period trading at meaningfully lower price-to-earnings multiples than the S&P 500, with estimates placing the gap at the high teens for Canada versus the mid-20s or higher for the US. Lower starting valuations provided less downside from multiple compression and more room for re-rating.
- Cooling US tech sentiment: Higher and stickier interest rates hit long-duration growth stocks harder than dividend-paying, asset-heavy companies. The TSX’s minimal tech exposure, a disadvantage during the earlier tech-led bull run, became a relative advantage.
Commentary from 2025 market reviews pointed to financials, gold miners, and Shopify as the primary contributors to positive TSX performance that year. This reflects analyst commentary and has not been independently verified across all data sources.
Each driver connects directly to the structural composition covered above. The TSX’s outperformance was a commodity and income story, which means it was also a story that depended entirely on conditions that do not hold in every cycle. These were cyclical tailwinds, not structural improvements to Canada’s competitive position.
The longer view: what a decade of data actually shows
A one-to-two-year streak is a data point, not a trend. Over most multi-decade windows, US equities have compounded faster than Canadian equities by a meaningful margin.
| Metric | S&P/TSX Composite | S&P 500 |
|---|---|---|
| 10-year annualised return (estimated range) | Approximately 7-10% | Approximately 12-15% |
| Approximate 2025 return | 26-32% (CAD) | 17-18% |
| Style tilt | Value, income | Growth, technology |
Illustrative long-run estimates from available sources place the 10-year compound annual growth rate (CAGR) at approximately 7.1% for the TSX versus 12.8% for the S&P 500 with dividends reinvested. A separate analysis placed 2008-2023 annualised returns at 10.1% for the TSX versus 16.1% for the S&P 500. These figures are drawn from unverified sources and should be treated as directional rather than definitive.
The directional conclusion is consistent: most of the S&P 500’s advantage came from a handful of mega-cap technology and platform companies that delivered extraordinary earnings growth over the past decade. The TSX has beaten US stocks in consecutive years only once this century, according to available commentary.
2025 was an exception enabled by specific conditions, not a reversal of a structural pattern. An investor who shifted heavily into Canadian equities based on recent headlines would likely be giving up compounding power unless the macro conditions driving TSX outperformance persist for an unusually extended period.
Long-run compounding is the context that makes the one-to-two-year relative performance comparison most misleading: when diversified equities have delivered approximately 7% real annual returns across every sufficiently long historical period, the cost of abandoning a well-structured allocation based on a recent headline is measured in decades of foregone wealth, not just a short-term misstep.
Why geography is really a sector bet in disguise
The most useful way to think about the Canada-versus-US decision is not “which country wins” but “which sectors am I actually holding.”
When you buy a broad TSX index fund, you are buying:
- Banks (roughly one-third of the index)
- Gold and base metals miners
- Oil and gas producers and pipelines
- Utilities, telecoms, and REITs
- A small slice of technology (primarily Shopify)
If you already hold a global energy fund and a financials ETF, you may already have indirect Canada-like exposure without realising it. Adding a broad TSX index fund on top could be doubling down on commodity and bank risk rather than diversifying.
The Canadian banking sector deserves specific attention here. Six major banks dominate a heavily regulated market, producing stable profits, dividends, and historically limited exposure to the banking crises that have periodically affected US and European institutions. That structure is a genuine differentiator, not just a sector weight.
The income argument for Canadian equities
The TSX has historically delivered a larger share of total return via dividends than the S&P 500. Banks, pipelines, telecoms, and real estate investment trusts (REITs, which are companies that own and operate income-producing property) are all significant dividend payers on the TSX.
For income-oriented or retirement-stage investors, that dividend stability can make Canadian equities a natural complement to growth-heavy US portfolios. Dividends from these sectors have historically been more stable than capital gains in volatile markets, which matters when you are drawing income rather than accumulating.
Currency, concentration, and the risks Canada carries
Every outperformance story has a structural cost. The same features that drove the TSX’s recent run are the features that carry the most risk.
The three principal risks of heavy Canadian equity exposure:
- Currency exposure: Cross-border investing introduces CAD/USD risk. Currency effects tend to oscillate over very long periods, but they can materially affect realised returns over shorter windows, amplifying or muting the underlying equity return depending on which direction the exchange rate moves.
- Sector concentration: Financials, Materials, and Energy together represent approximately 66% of the TSX Composite as of 31 December 2025. Two-thirds of the index sits in three cyclical or commodity-linked sectors.
- Limited technology participation: The same minimal tech weight that insulated the TSX from US tech volatility in 2025 also means Canadian investors miss out on innovation-driven compounding over longer cycles.
Financials, Materials, and Energy together represent approximately 66% of the TSX Composite. A bad year for commodities and bank earnings is not just a bad year for those sectors; it is a bad year for most of the Canadian index.
The same sector tilts that aided Canada in 2025 caused significant relative underperformance during the US tech-led bull markets of the prior decade. That 66% concentration figure should be priced into any decision to add exposure.
How to think about allocation between the two markets
The central principle is straightforward: do not reconfigure a portfolio based on one to three years of relative performance. That is performance chasing dressed up as strategic thinking.
Three allocation principles worth anchoring to:
- Avoid reconfiguring based on short-term relative performance. The macro conditions that drove TSX outperformance were specific and cyclical. They may persist, or they may not. Betting heavily on their continuation is a directional call, not a diversification strategy.
- Hold both markets to capture different cycle benefits. Investors who held only US stocks missed the commodity and bank surge. Investors who held only Canadian stocks missed a decade-plus of US tech compounding. Maintaining exposure to both reduces the risk of being entirely on the wrong side of a given cycle.
The principle of holding uncorrelated return streams across economic environments is the analytical foundation underneath the hold-both-markets argument: when Canada leads on commodities and income and the US leads on innovation and growth, a portfolio exposed to both captures different cycle tailwinds rather than doubling down on the same macro driver.
- Audit sector mix before adjusting geographic labels. Before changing your Canada-versus-US allocation, audit your total sector exposure across all holdings. You may find that the real concentration risk is not in geography at all but in how much of your portfolio is exposed to the same three or four sectors through different wrappers.
Questions to ask before rebalancing
Before making any Canada-versus-US allocation change, apply these three diagnostic questions to your own portfolio:
- Am I already exposed to commodities and financials through other holdings such as sector funds, commodity ETFs, or individual resource stocks?
- Does my portfolio generate enough dividend income for my current needs, or is the income gap something Canadian equities could specifically address?
- What is my actual time horizon for this allocation? If it is a decade or longer, the long-run return differential matters more than recent relative performance.
For Canadian investors who already carry a heavy home bias, recent outperformance is not a reason to skip US exposure. Long-term return data still strongly favour maintaining a substantial US allocation. For non-Canadian investors, the CAD/USD dimension adds a layer of complexity that matters more at shorter horizons.
What the outperformance reveals, and what it does not settle
The TSX’s outperformance in 2025 was real, meaningful, and cyclically driven. It confirmed what the structural composition of the two indices always implied: when commodities, banks, and income lead, Canada wins. When innovation, technology, and growth lead, the US wins.
The episode does not alter the long-run case for US equities, nor does it make Canadian equities structurally superior. Both remain valid components of a well-diversified portfolio, with different sector profiles and different return characteristics.
The most durable takeaway is not a verdict on which country wins. It is a diagnostic tool. The Canada-versus-US comparison is most useful when it prompts you to examine what sector exposures and income sources your portfolio actually contains, and whether those positions reflect an intentional view or an accidental one.
For investors who recognise the performance-chasing pattern in their own decision-making, our full explainer on performance-chasing behaviour examines the specific behavioural mechanisms that make recent outperformance feel like a structural signal, and the structural choices that interrupt that pattern before it costs compounding years.
This article is for informational purposes only and should not be considered financial advice. Investors should conduct their own research and consult with financial professionals before making investment decisions. Past performance does not guarantee future results.
—