
A stock you owned at 6x price-to-sales now trades at 2x price-to-sales. The business has not been acquired. It has not filed for bankruptcy. It has simply been abandoned by the market. The question is not whether the price is lower. The question is whether the business is broken or just repriced.
The distinction between a recoverable repricing and structural failure is the same logic that underpins stock market selloff classification at the sector level: irrational overreactions, temporary setbacks, and structural disruption each require a different analytical response and a different position-sizing posture.
High-growth stocks that collapse are some of the most mishandled situations in investing. Most investors either panic-sell at the bottom, average down without any framework, or hold indefinitely because they “believe in the story.” None of those are investment processes. What separates recoverable repricing from genuine structural failure is a repeatable methodology, one that builds uncomfortable pessimism before optimism is permitted and sizes the position so that being wrong does not destroy your portfolio while being right produces meaningful returns.
This guide gives you that methodology, step by step. The Trade Desk serves as a live working example throughout, but the framework applies to any fallen growth stock you encounter. You will walk through the first number to pull off the balance sheet, through scenario construction and segment diagnostics, all the way to the written exit rule you must set before any capital is deployed.
Start with the cash floor before you model anything else
Before you model a recovery or a decline, answer one question: how much of today’s share price is money already in the bank?
The calculation takes five minutes:
- Pull the latest balance sheet
- Compute net cash: cash plus cash equivalents plus short-term investments, minus total debt
- Divide net cash by the current market capitalisation to get the percentage
- Convert to a per-share figure and compare it to the current share price
When you do this for The Trade Desk, the result reframes the entire setup. At the time of analysis, the company’s cash position exceeded $1 billion while its market capitalisation stood at roughly $6 billion. The stock was trading below approximately $14 per share. At roughly 2x price-to-sales, versus the original 6x purchase price, the valuation compression has already absorbed an enormous amount of pessimism.
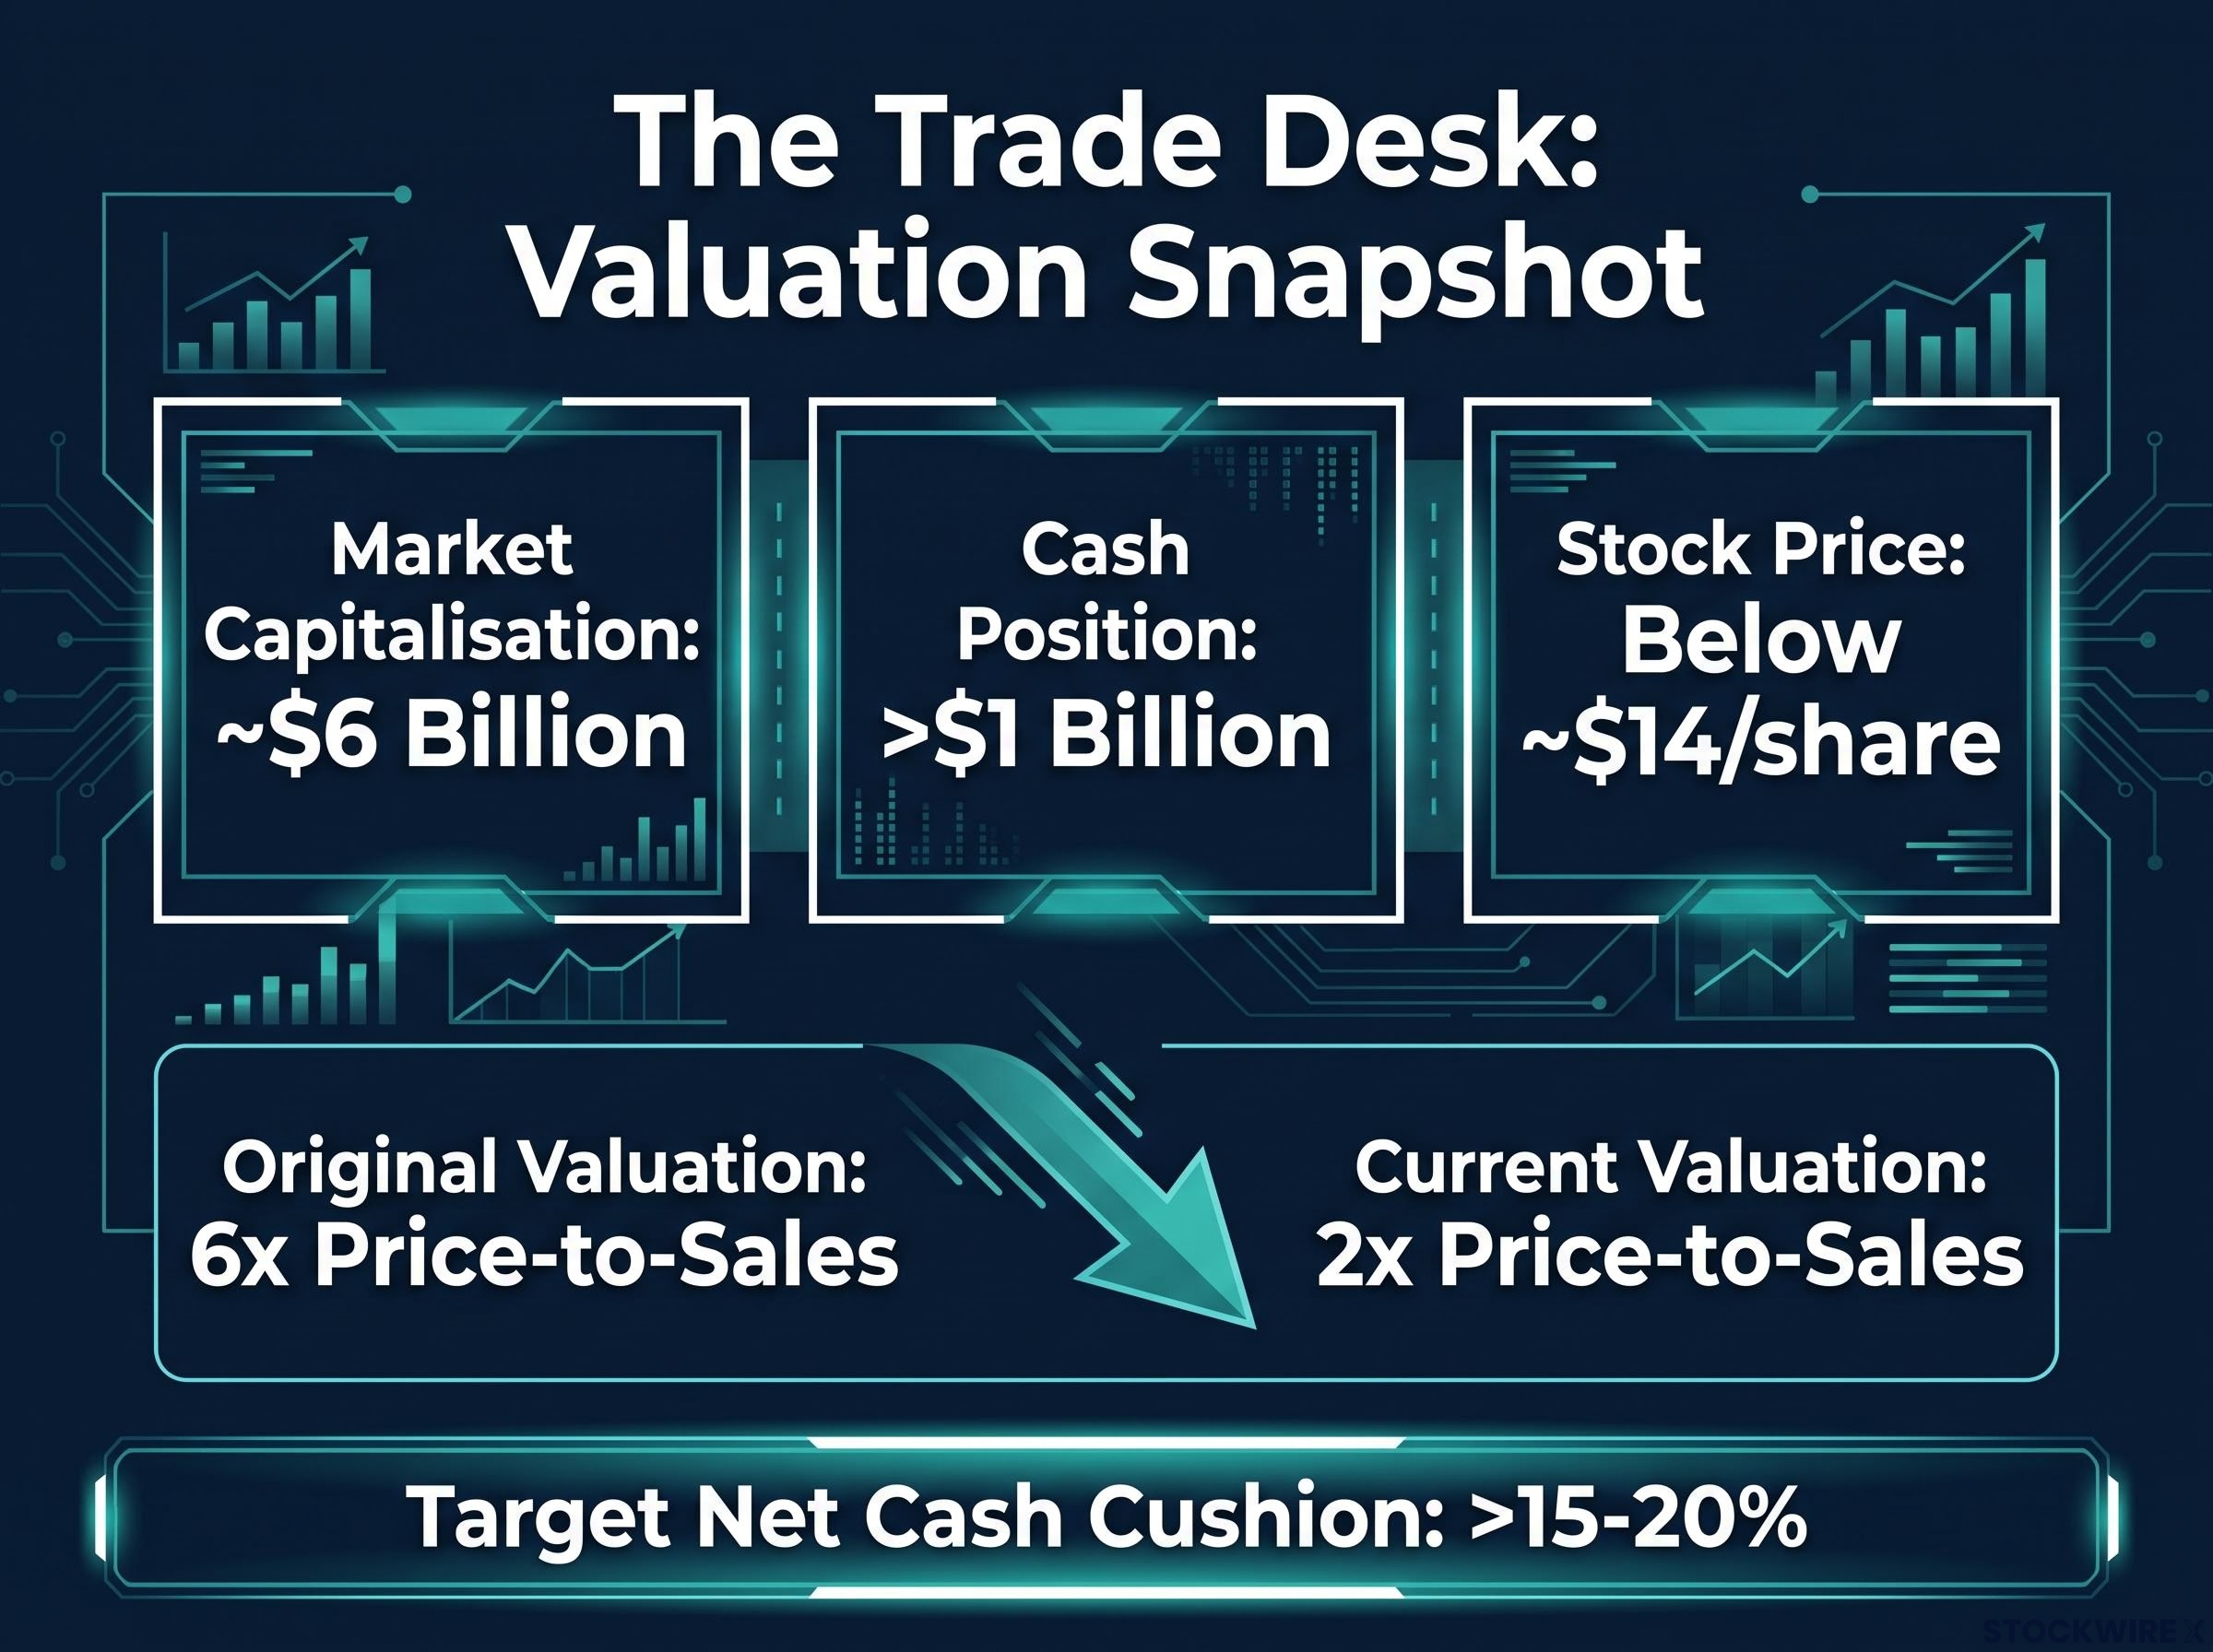
That cash-to-market-cap ratio tells you how much of today’s price is money sitting in the bank versus a bet on future performance. When a stock has fallen 60-80%, the distinction between market cap and enterprise value (market cap minus net cash, which is the portion of the price that actually depends on the business performing) is often enormous. Your exposure is to enterprise value, not market cap.
A net cash cushion above 15-20% of market cap reduces distress risk and earns deeper analytical attention.
If the cushion is there, the stock is worth your next hour of analysis. If it is not, and the company is burning cash, you are looking at a different category of risk entirely, one that requires survival-probability modelling rather than recovery-scenario construction.
When big ASX news breaks, our subscribers know first
Build the pessimistic scenario first, and make it genuinely uncomfortable
Here is where most investors go wrong: they build a bear case that is secretly optimistic. They assume revenue “only” grows at 5% instead of 20%, margins “only” recover to 25% instead of 35%, and they call that pessimistic. It is not. A genuinely pessimistic scenario should make you uncomfortable.
Build it first. If the result is unacceptable for your portfolio or your psychology, you need to discover that before excitement about the upside case develops, not after.
A genuinely pessimistic scenario requires four inputs, each set at levels that assume the business never recovers its growth trajectory:
| Input | Pessimistic Assumption | Trade Desk Example |
|---|---|---|
| Revenue growth | Flat or negative | Approximately -5% for the current year |
| Operating margin | Partial recovery only | Approximately 20% (well below the prior 30-40% target range) |
| 5-year EPS growth | Approximately zero | 0% diluted per-share earnings growth |
| Terminal P/E multiple | Low-teens, appropriate for no-growth | Approximately 13x earnings |
Under this scenario, The Trade Desk’s cash position provides a floor, but potential additional downside of 20-30% from a depressed price remains plausible. That is the point. You are not building a bear case to reassure yourself. You are building one to find out whether the worst outcome is survivable.
If the pessimistic result produces an annualised return that would be acceptable, or at least survivable, within your portfolio, you have identified a position worth further work. If the result would be catastrophic, you have just saved yourself before any excitement about recovery began. The sequence matters as much as the methodology.
What do valuation scenarios actually look like in practice?
Only after you have sat with the pessimistic case should you construct the optimistic scenario. And the reason the optimistic case can produce outsized returns from a fallen growth stock is a mechanism worth understanding from the inside out.
When a high-growth stock collapses, the market applies two punishments simultaneously: earnings estimates come down, and the multiple compresses from “growth compounder” to “broken business.” Recovery reverses both. Earnings per share grow again, and the market re-rates the multiple from a low-teens “no growth” level back toward a mid-to-high-twenties “credible compounder” level. These two forces compound together. That is the double engine.
Here is what both scenarios look like side by side:
| Input | Pessimistic | Optimistic |
|---|---|---|
| Revenue growth | -5% | ≥10% YoY within 12-18 months |
| Operating margin | ~20% | Recovery above pessimistic floor |
| 5-year EPS growth | 0% | Mid-teens CAGR |
| Terminal P/E multiple | 13x | 25-30x |
For The Trade Desk, the optimistic scenario requires revenue to reaccelerate to at least 10% year-over-year growth within a 12-18 month window, alongside margin improvement beyond the pessimistic floor. Under those conditions, the potential upside maps to several hundred percent from the depressed entry price. The contrast with a 13x terminal multiple is dramatic: a recovery to 25-30x applied to growing earnings produces a fundamentally different price target.
Now you have both numbers. The asymmetry test is what determines whether the setup is worth pursuing.
The core test is whether the bet skews heavily in your favour: substantial upside if correct, limited damage if wrong.
Downside of approximately -20% versus upside of several hundred percent represents a setup worth deploying capital into. Downside of -50% versus upside of +80% does not. The asymmetry ratio is more important than any individual input. Use it as the go/no-go gate for position entry. If the shape of the bet does not skew heavily in your favour, the stock may be cheap but it is not a good risk-reward trade.
How to read segment data to distinguish concentrated pain from structural failure
The headline says revenue missed and guidance was cut. That is one number. The diagnostic truth is buried underneath it, in the granular breakdown by customer type, channel, and geography. Your job is to determine whether the company is broadly broken or whether a small cluster of problems is making the whole look worse than it is.
Signals of concentrated weakness
These are the indicators that tell you the pain may be fixable:
- Strong long-tail customer growth: Accounts sitting outside The Trade Desk’s top 500 advertisers posted roughly 50% year-over-year revenue growth
- Healthy large-account base with narrow exceptions: Double-digit growth continued across most of the top 100 advertiser relationships, with meaningful pullbacks confined to a handful of the very largest spenders
- New channel growth: Both connected TV and audio delivered double-digit expansion, with audio recording its fourth straight quarter as the company’s fastest-growing channel
- Robust international performance: The combined EMEA and APAC segment expanded at close to 30% year-over-year, while revenues sourced from China more than doubled year-over-year
- High overall retention: The overall customer retention rate held near 95%, and a dedicated team focused on winning back lapsed clients was scaling at roughly 250% year-over-year
Signals of structural deterioration
These are the warning signs that would shift your weighting heavily toward the pessimistic scenario:
- Broad contraction: Customer loss and revenue decline across all segments and geographies simultaneously
- Margin deterioration: Falling gross margins that indicate pricing power is eroding, not just temporarily compressed
- Rising churn: Customers leaving at an accelerating rate, suggesting the product is losing competitive relevance
- Simultaneous legacy and new product weakness: When both established offerings and new initiatives are contracting, there is no healthy core to recover from
This pattern of strong long-tail growth, high retention, and robust international and channel performance alongside large-account stagnation is the signature of a concentrated problem, not a structural one. Recognising that pattern is what separates a recoverable situation from a value trap. If you see the second set of signals instead, the pessimistic scenario deserves the dominant weighting in your analysis, and position sizing should reflect that.
Structural disruption in enterprise software is the specific category of risk that segment diagnostics must rule out before classifying a revenue miss as concentrated and recoverable: when AI-native pricing models are undercutting incumbent platforms by 80-90%, the long-tail growth and retention metrics that look healthy today may be masking a pricing moat that has already eroded.
How to size a position when uncertainty is genuinely high
Position sizing for a fallen growth stock is not a single decision. It is a conditional agreement you make with yourself before you buy, one with three components that must all be defined in writing before any capital moves.
Setting the initial position size
The range is 2-4% of your portfolio. That is large enough that a successful recovery meaningfully impacts your returns, and small enough that a total loss is survivable. A 0.5% position is too small to matter even if you are right; it functions as a psychological placeholder rather than a real investment. A full-conviction position before the thesis is validated by real-world data is premature.
For The Trade Desk, the specific application involved lifting the allocation from a tracker position of roughly 0.01% up toward 3-4% of the total portfolio. That is a meaningful commitment, but it is not a conviction bet. It is a structured experiment at a size where the outcome matters either way.
Defining the milestone and exit rule
Pick a simple, quantitative test that would confirm the thesis is on track, and assign it a deadline. For most fallen growth stocks, revenue reacceleration is the cleanest anchor.
The milestone format is: metric, threshold, deadline. For The Trade Desk, the specific test is whether revenue growth can reach a minimum of 10% year-over-year somewhere within the next 12-18 months. That is specific, measurable, and time-bounded.
The exit rule must be written before you buy, not after. Write it down in exactly this format:
“If revenue does NOT reach 10% YoY growth by [Quarter, Year], I will exit the position entirely.”
This rule exists to protect you from a specific cognitive failure: endlessly extending timelines and finding new excuses to hold a broken thesis. That is the most common and most destructive behaviour in turnaround investing. If the milestone is met, do not automatically double down. Re-underwrite the thesis with new data before increasing size. If the milestone is missed, exit fully and redeploy capital without negotiating with the rule.
The written exit rule matters precisely because sell decision biases, including the disposition effect, recency bias, and herd behaviour, concentrate at the moment of exit and systematically cause investors to hold losers too long while exiting recoveries too early.
The tight leash framework converts a high-uncertainty bet into a structured, time-bounded experiment with a known failure condition. That structure is what makes it possible to hold a small position without gradually becoming emotionally anchored to a thesis the evidence no longer supports.
Sector and structural risks that cap how far conviction can go
Even when your company-level analysis is compelling, sector-level and structural risks exist independently. They cap your maximum allocation. A compelling thesis and a responsible allocation to that thesis are two distinct judgements.
Three structural factors limit how large your position should become:
- Cyclicality: Advertising and other discretionary categories can be hit severely in recessions. In prior downturns, advertising sector stocks have seen valuations move from roughly 7x earnings down through 5x and ultimately to as low as 3x earnings. That tells you the pessimistic terminal multiple of 13x used in the scenario model may still be too generous if the macro environment deteriorates.
- Customer concentration: A small number of very large clients changing behaviour can suppress performance regardless of broader fundamentals. Platform risk compounds this when big tech policy changes can materially affect economics.
- Acquisition cap on upside: Jeff Green has a prior history of building and selling an advertising business, which means a negotiated exit at a premium to the current depressed price, even if that price sits below intrinsic value, is a realistic outcome that could limit the returns available to shareholders even when the directional thesis proves correct.
Historical data on advertising spend contractions during recessions, including the 2008 financial crisis and the 2020 pandemic period, confirms that ad-sector valuations can compress far more severely than a baseline pessimistic scenario assumes, which is why the structural ceiling on advertising exposure in this framework is treated as a hard constraint rather than a soft guideline.
For return context, the broader equity market has historically returned approximately 5-10% annually, Meta approximately 20% annually, and Google and Amazon between 10-20% or higher depending on the period. A fallen growth stock recovery at 3-4% of portfolio needs to justify the concentration risk relative to these benchmarks.
These risks are a ceiling on position size, not a veto on the investment. Acknowledging them explicitly is what separates a disciplined allocation decision from an undisciplined one. Knowing that advertising stocks have compressed to 3x earnings in severe downturns is the specific risk that justifies keeping even a high-conviction advertising position capped relative to other growth opportunities in your portfolio.
A reusable eight-step process for the next fallen growth stock you encounter
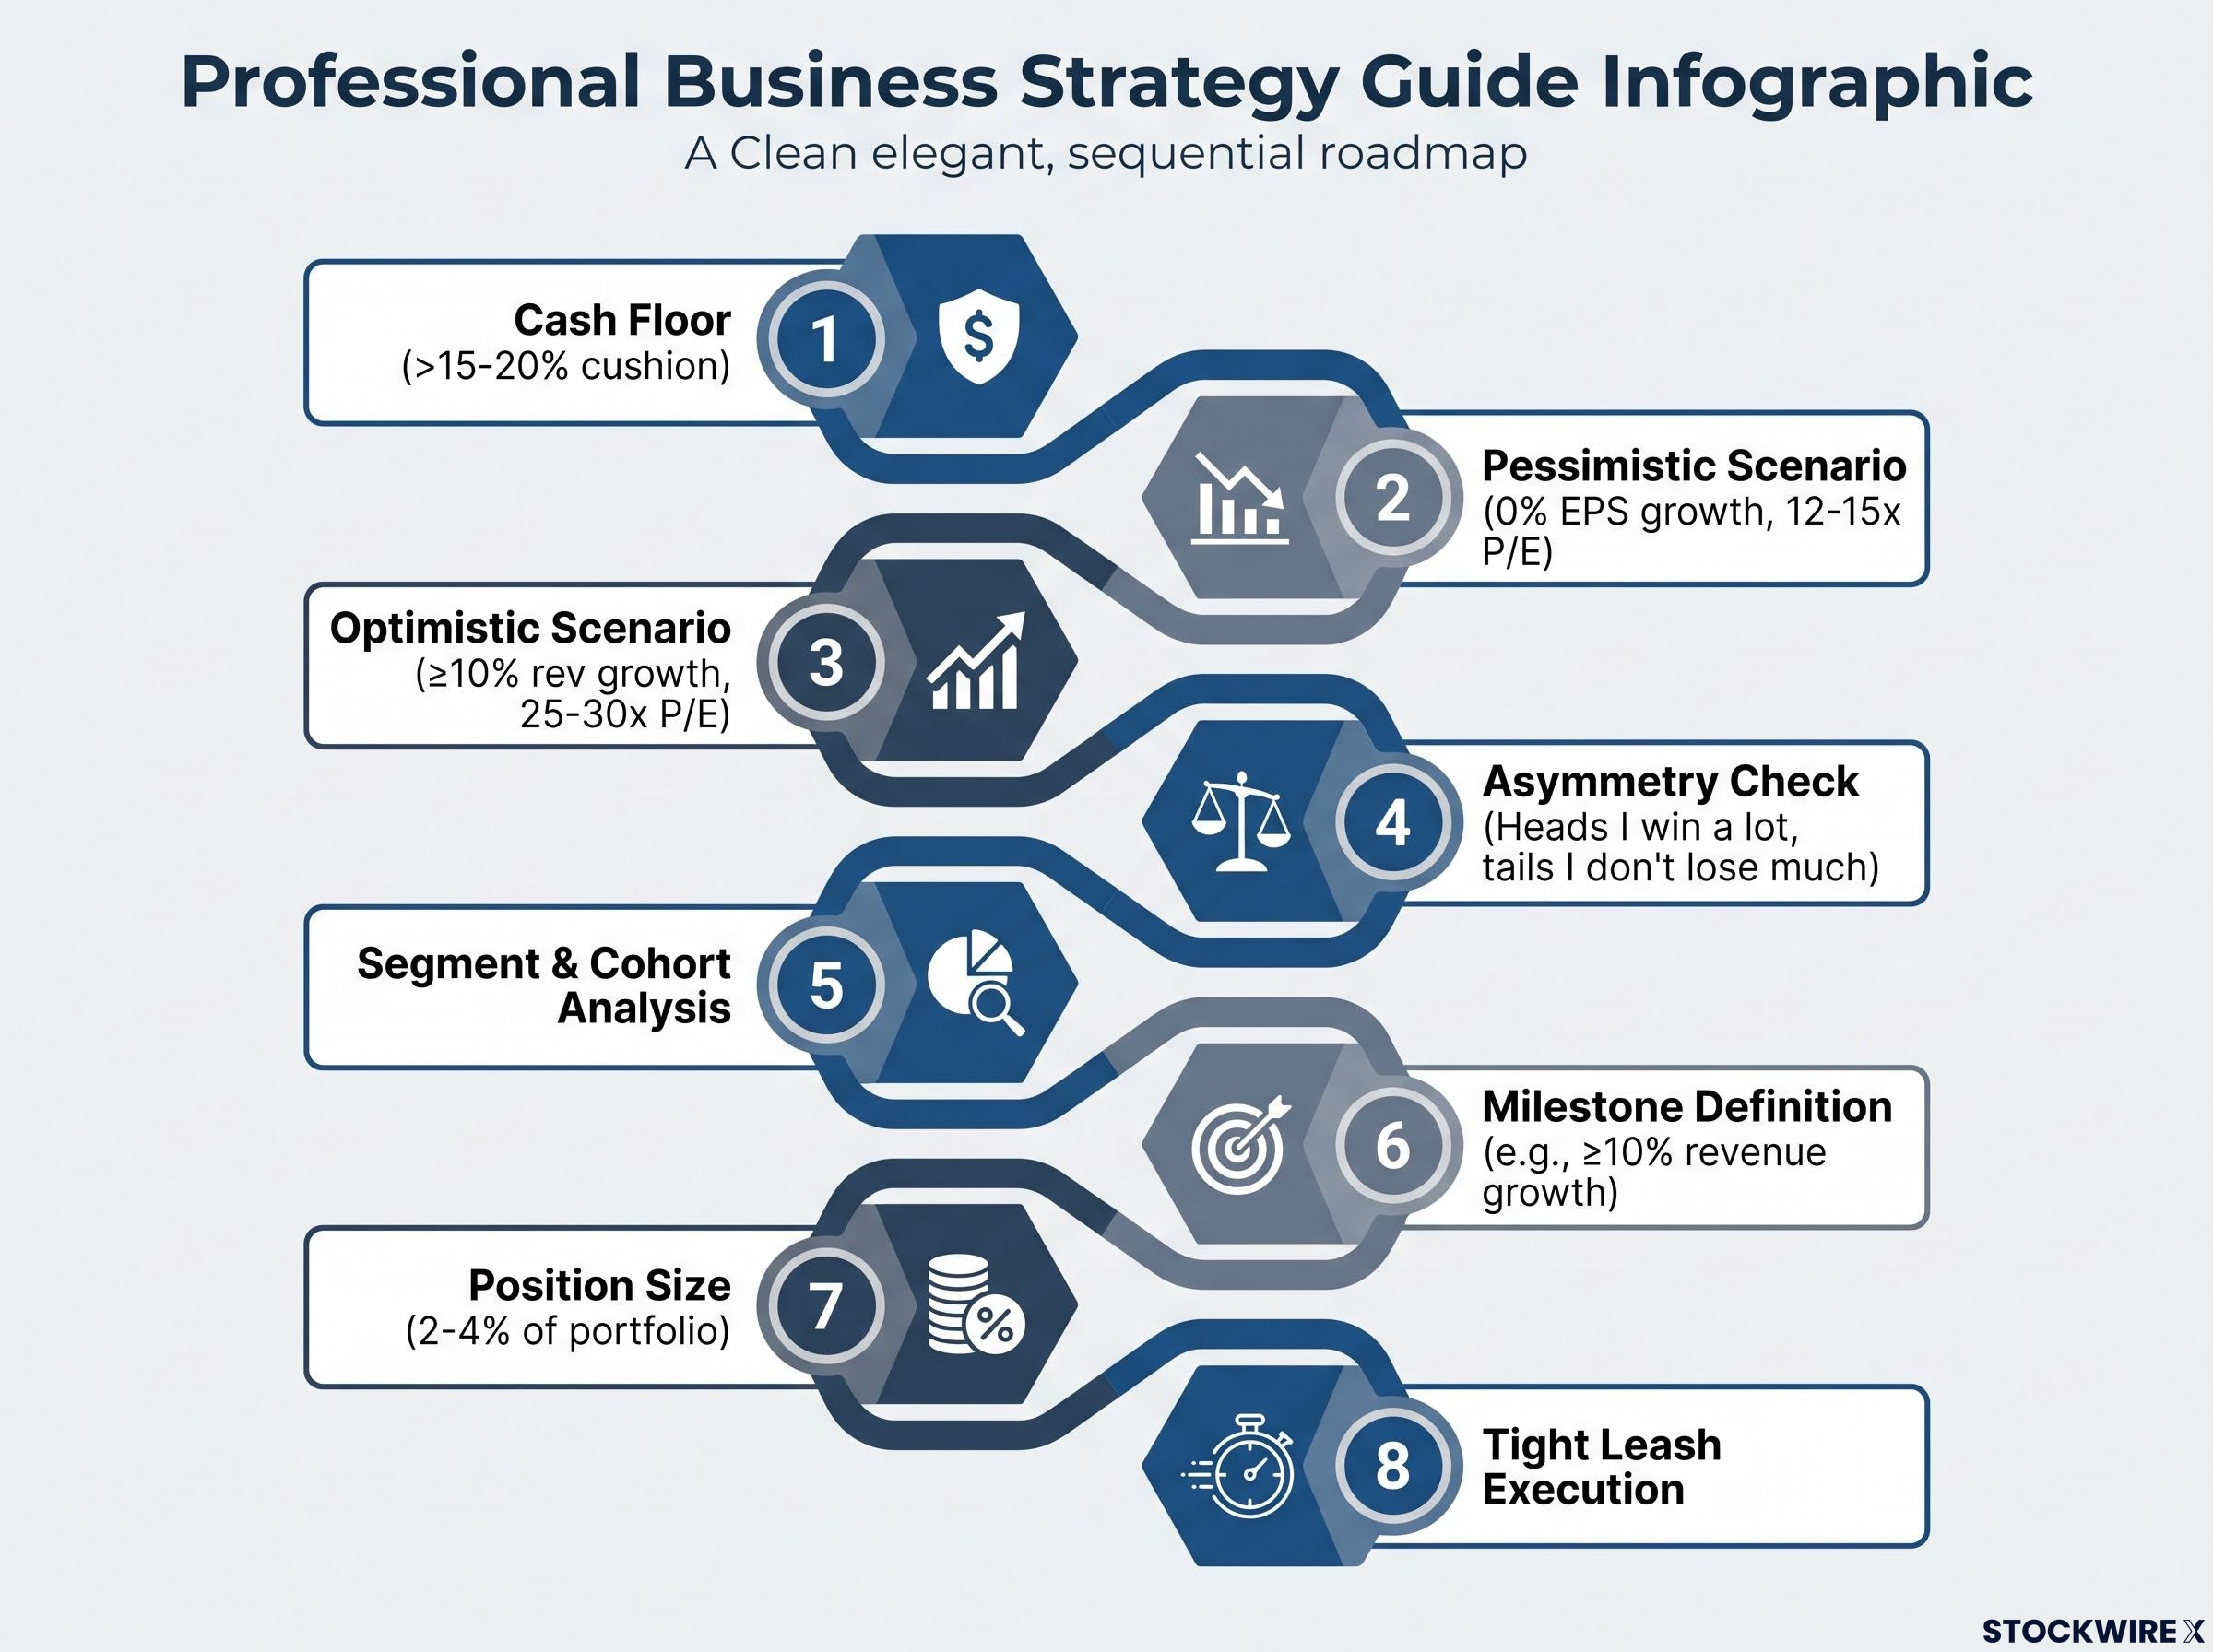
The framework you have just worked through with The Trade Desk is not specific to one stock. It is a portable process you can execute in a few hours once financials and disclosures are available. The sequencing is not optional. Each step constrains the inputs available to the next one.
The eight-step checklist
- Cash floor: Calculate net cash as a percentage of market cap and confirm the cushion exceeds 15-20% before proceeding to scenario construction
- Pessimistic scenario (build first): Model flat or negative revenue growth, partial margin recovery, approximately 0% EPS growth over five years, and a 12-15x terminal P/E; if the downside is unacceptable, stop here
- Optimistic scenario (anchored to evidence): Model revenue reacceleration to at least 10% growth, margin recovery toward historical levels, mid-teens EPS CAGR, and a 25-30x terminal P/E
- Asymmetry check: Confirm the setup passes the “heads I win a lot, tails I don’t lose much” test; if the downside and upside are roughly symmetric, the risk-reward does not justify entry
- Segment and cohort analysis: Determine whether revenue weakness is concentrated in a specific customer, channel, or geographic pocket, or whether it is broad and structural
- Milestone definition: Choose one to two simple metrics (e.g., ≥10% revenue growth) with explicit deadlines, and set them before entering the position
- Position size and sector cap: Size the initial position at 2-4% of portfolio and apply a sector-level ceiling based on cyclicality, customer concentration, and acquisition risk
- Tight leash execution: Document the thesis and failure conditions in writing before buying; exit fully if milestones are not met by the deadline; re-underwrite before increasing size if milestones are met
Having a written checklist with specific thresholds is not about eliminating your judgement. It is about ensuring your judgement is applied to the right questions in the right order, which is what distinguishes a recoverable mistake from a portfolio-damaging one.
Applying this framework the next time a high-flier falls
Fallen growth stocks are not inherently attractive or unattractive. They require a structured process that begins with the cash floor, builds genuinely uncomfortable pessimism before optimism is permitted, quantifies the asymmetry of the bet, and ends with a written exit rule that exists before any capital is deployed.
The framework enables one specific distinction that most investors never make rigorously: the difference between a stock that is cheap because the business is recovering underneath a damaged headline number, and a stock that is cheap because the market has correctly repriced a permanently impaired business. The segment diagnostics and milestone structure are how you make that call with data rather than hope.
The two failure modes this framework is designed to prevent are the ones that destroy the most capital in turnaround investing. Panicking out at the bottom locks in permanent losses when the business may be recoverable. Holding indefinitely without a defined thesis turns a temporary position into a permanent anchor on your portfolio. The tight leash sits between those extremes: meaningful enough to matter, bounded enough to protect you, and structured enough that you will know, on a specific date, whether the evidence supports staying or leaving.
Loss aversion is the specific bias that makes both failure modes so common: it causes investors to panic-sell at the bottom to stop the psychological pain, and it causes them to hold indefinitely because realising a large loss feels worse than holding an impaired position.
This article is for informational purposes only and should not be considered financial advice. Investors should conduct their own research and consult with financial professionals before making investment decisions. Past performance does not guarantee future results. Financial projections are subject to market conditions and various risk factors.