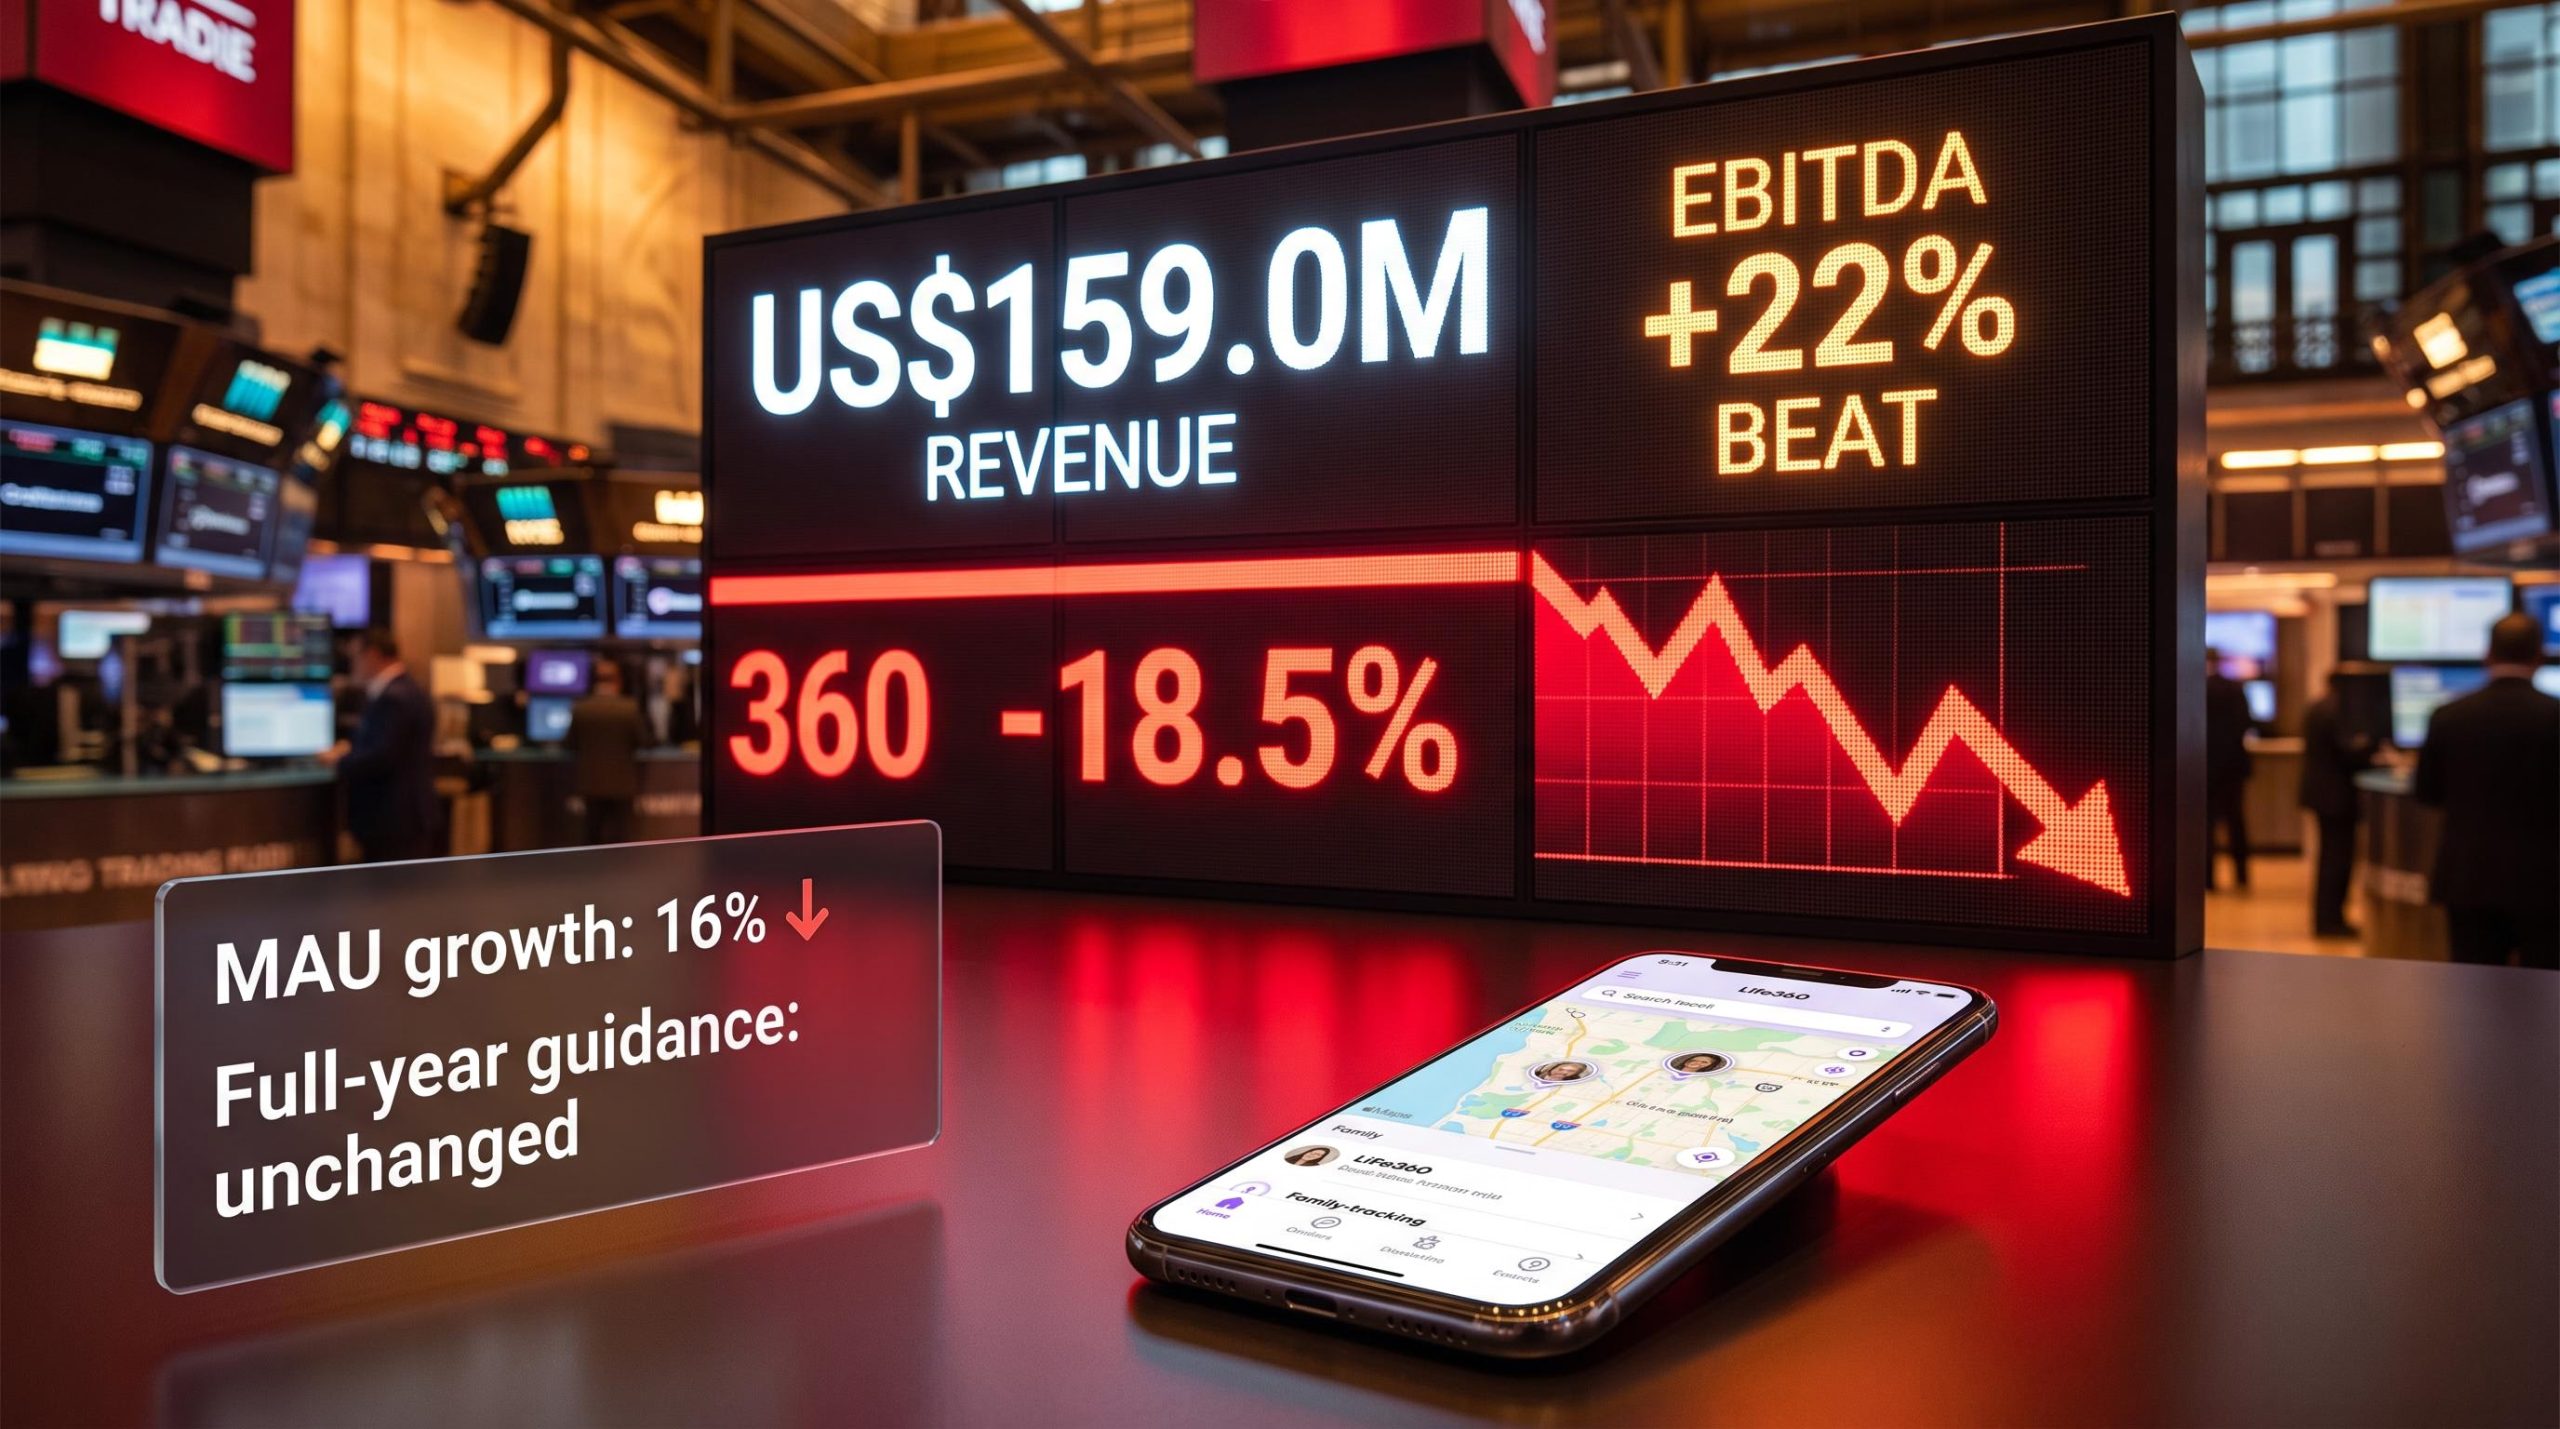
Life360 just reported its best quarterly revenue on record, beat analyst estimates on every major profit metric, and watched its share price fall nearly 19% in a single session. That is the kind of dissonance that demands an explanation.
The tension between the reported numbers and the market’s reaction is the story of 11 August 2026 on the ASX. Life360 has history with sharp post-earnings selloffs; the stock dropped 10.8% after its Q1 FY26 result in May, then recovered within three weeks. Whether this episode follows the same script depends on what investors see when they look past the headline beat.
Here is what the numbers actually show, what the market is reacting to instead, and the three specific signals that will determine whether this selloff sticks or reverses.
Record quarter, 18% share price drop: what the numbers actually say
On a surface read, Q2 FY26 was comfortably Life360’s strongest quarter. Group revenue expanded 38% year on year to reach US$159.0 million, coming in ahead of the US$156.5 million analyst consensus by around 2%. Subscription revenue, the company’s most durable income stream, advanced 31% to US$115.6 million. On the advertising side, revenue jumped 315% to a record US$22.0 million, roughly four times the prior-year figure.
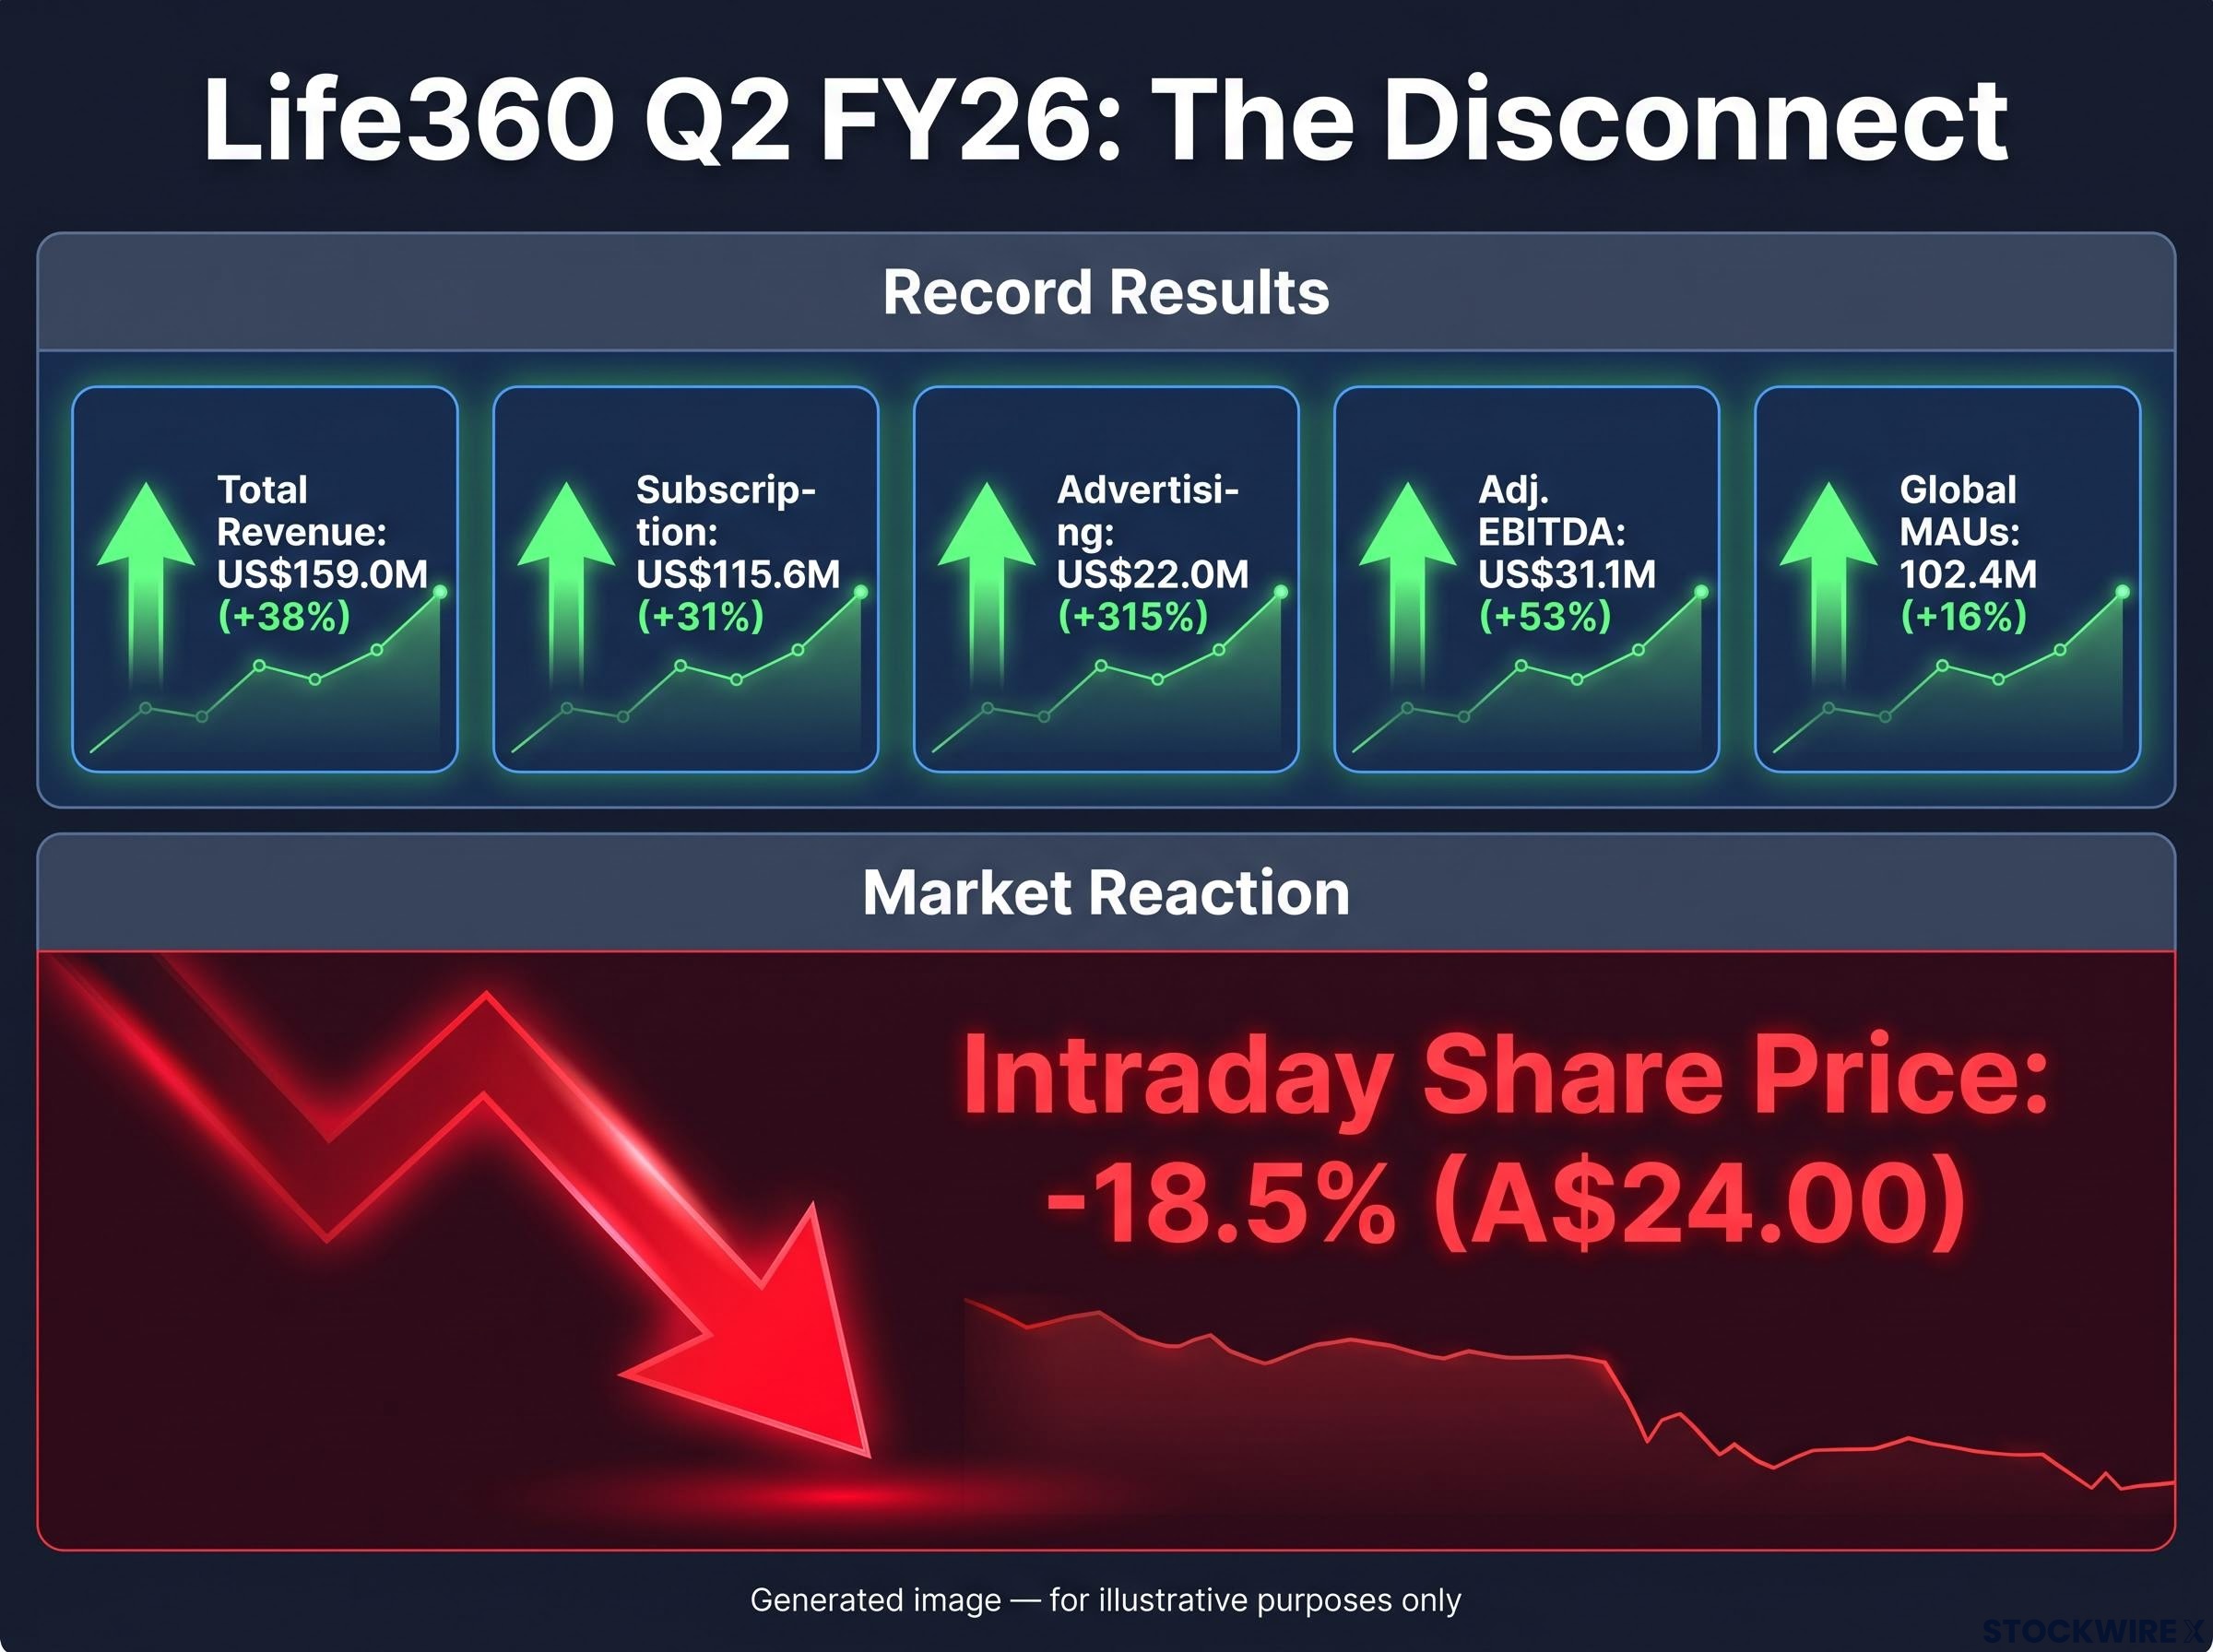
The profit beat was even more emphatic. Adjusted EBITDA (earnings before interest, tax, depreciation, and amortisation, a widely used measure of operating profitability) reached US$31.1 million, representing 53% growth year on year and landing approximately 22% ahead of the US$25.5 million consensus forecast.
Adjusted EBITDA beat: US$31.1 million reported vs. consensus of US$25.5 million, a 22% beat that represented Life360’s largest margin surprise this year.
The company’s adjusted EBITDA margin came in at 19.6%, which topped the 16.3% analyst estimate by 330 basis points. On the user side, global monthly active users (MAUs), the total number of people using the app each month, grew 16% year on year to 102.4 million.
One caveat matters immediately. Approximately 3 percentage points of the Q2 margin came from a non-recurring tariff-related benefit. Strip that out and the underlying margin beat narrows considerably. The company is executing well on its current business, but the headline margin number overstates what investors can reasonably expect to repeat next quarter.
Notwithstanding the beat across key metrics, Life360 shares dropped to an intraday low of A$24.00 (an 18.5% decline) and were trading at A$25.52, off 13.4%, at the time of reporting.
| Metric | Reported | Analyst estimate | Beat/Miss | YoY change |
|---|---|---|---|---|
| Total revenue | US$159.0M | US$156.5M | +2% beat | +38% |
| Subscription revenue | US$115.6M | N/A | N/A | +31% |
| Advertising revenue | US$22.0M | N/A | Record | +315% |
| Adjusted EBITDA | US$31.1M | US$25.5M | +22% beat | +53% |
| Adjusted EBITDA margin | 19.6% | 16.3% | +330bp beat | N/A |
When big ASX news breaks, our subscribers know first
The user growth problem hiding behind the revenue headline
The market is not pricing the quarter Life360 just delivered. It is pricing the next three years. And the metric that matters most to that forward view, MAU growth, is heading in the wrong direction.
MAU growth decelerated for the second consecutive quarter, falling from 17% in Q1 FY26 to 16% in Q2 FY26. The full-year target remains approximately 20%, which means the second half needs a material rebound just to close the gap. That is a steep ask when the trend is moving the other way.
The MAU growth divergence from paying circle growth was already visible in Q1 2026, when paying circles expanded 27% year on year while overall MAU growth came in at 17%, a gap that framed the monetisation question the market is still testing in Q2.
The Android issue and what it signals
Management acknowledged that a technical issue affecting registrations on Android devices weighed on MAU growth. This is not a new disclosure; the same issue was flagged earlier in 2026. The fact that it persists across multiple quarters raises a pointed question: is this genuinely a temporary technical drag, or is it masking structural deceleration as the user base matures?
On the earnings call, analysts pressed management for specific, modelable data to justify confidence in a second-half recovery. The response was qualitative only. Management pointed to:
- Early back-to-school season trends showing improved momentum
- Growing brand recognition in the US and newer international markets
- Upcoming product initiatives in the pets category
When a company growing at this pace cannot quantify why the next two quarters will be stronger, it signals that management itself lacks visibility. For investors, that uncertainty is more unsettling than any single metric. MAUs are the top-of-funnel driver for both subscription and advertising revenue. Any sustained deceleration here puts the entire growth thesis under pressure, regardless of how strong the current-quarter numbers look.
Why Life360 shares are priced to punish any sign of slowing growth
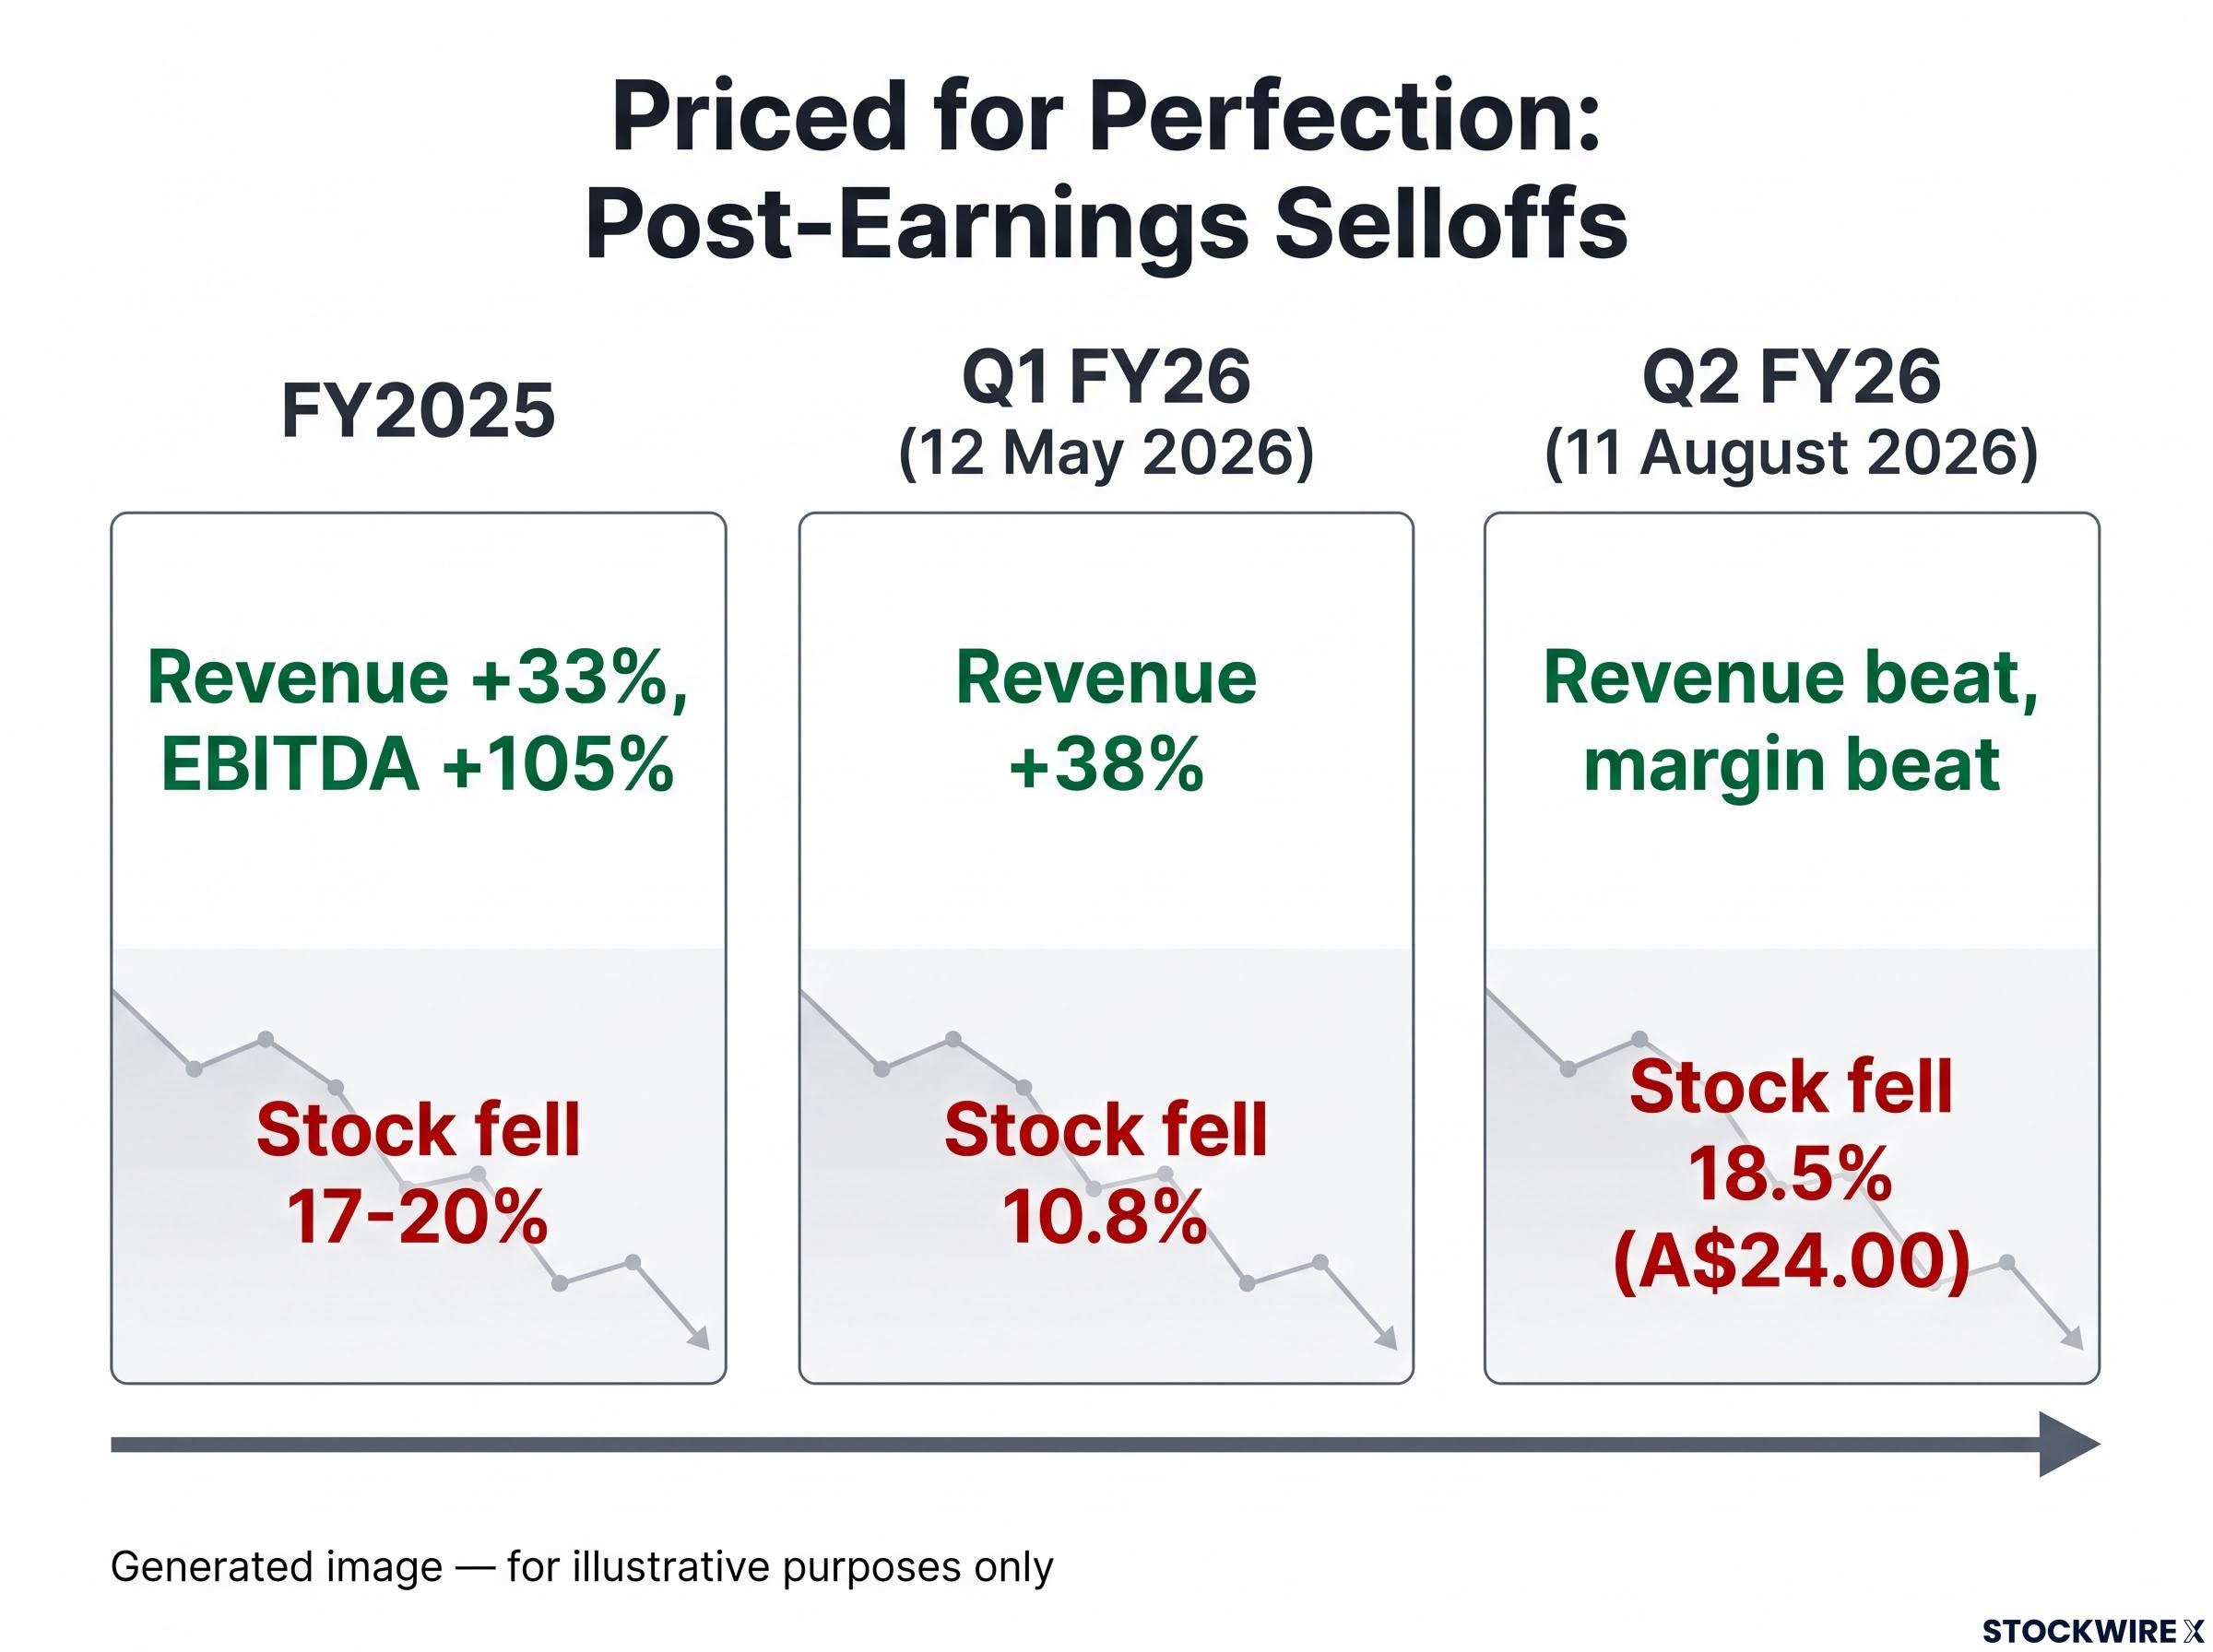
Today’s selloff is not an isolated event. It is the third time in less than twelve months that Life360 has delivered strong headline results and seen its share price fall sharply on concerns about forward indicators.
The dynamic at work is what investors call being “priced for perfection.” When a stock trades at a high growth multiple, the market is not rewarding what the company earned last quarter. It is pricing the expectation that revenue, users, and margins will all keep compounding at elevated rates. That means any deceleration in forward indicators, even a modest one, triggers multiple compression (a reduction in the price investors are willing to pay per dollar of future earnings), even when the reported numbers beat expectations.
The pattern is clear:
- FY2025 full-year result: Revenue up approximately 33% and adjusted EBITDA up approximately 105%, yet the stock fell roughly 17-20% on concerns about slowing growth and stretched valuation.
- Q1 FY26 (12 May 2026): Record revenue growth of 38% and a guidance upgrade; the stock still retreated 10.8% in the following session, with MAU growth of 17% falling short of expectations.
- Q2 FY26 (11 August 2026): Revenue beat, margin beat, and a record advertising quarter; shares fell as much as 18.5% intraday to A$24.00.
The FY25 profitability inflection was the result that established the current growth multiple: Life360 reported its first full-year net income in company history alongside 105% adjusted EBITDA growth, setting the elevated baseline against which every subsequent quarter is now measured.
The guidance dynamic compounds the concern. After two consecutive quarters of strong beats, management kept full-year revenue guidance at the previously communicated range of US$650 million to US$685 million, making no upward revision.
The guidance midpoint of approximately US$667.5 million trails the analyst consensus of US$671.8 million by around 1%, a shortfall that, for a high-multiple growth stock, reads as a de facto downgrade signal rather than a neutral hold.
The full-year adjusted EBITDA range was similarly held at US$130 million to US$140 million without revision. The non-upgrade tells you management is not confident enough in the second half to commit to a higher number, and at this valuation, that hesitation carries more weight than any single beat.
One important counterpoint: the stock recovered its post-Q1 FY26 decline within approximately three weeks. Whether this selloff follows the same timeline depends on what the next set of numbers shows.
What the earnings quality concerns actually mean for the growth story
The headline numbers are strong. The question the market is asking is whether those numbers are structurally durable, and on that front, three concerns connect into a single argument about profitability quality.
Revenue mix and the advertising question
Advertising revenue growing at 315% year on year is a remarkable number. But advertising income is inherently cyclical and sensitive to macroeconomic conditions. Investors typically assign it a lower earnings multiple than recurring subscription revenue. The fact that advertising carried an outsized share of the headline beat adds risk to the quality of the result.
Cost trajectory
In Q1 FY26, operating expenses grew approximately 46% year on year against 38% revenue growth, and gross margin slipped from 81% to 77% over the same period. Life360 is still in a heavy investment phase where costs are outpacing top-line scale.
The Q1 FY26 cost trajectory established the pattern now repeating in Q2: operating expenses grew 46% year on year against 38% revenue growth in the prior quarter, compressing adjusted EBITDA margins to approximately 12% and setting the baseline from which today’s 19.6% margin result is measured.
The forward margin picture reinforces the concern. Management guided to the following milestones:
- Q3 FY26 adjusted EBITDA margin is expected to come in at around 18%, reflecting sequential progress from Q2 but stripping out the one-off tariff tailwind
- Q4 FY26 adjusted EBITDA margin is targeted to surpass the 22% level the company posted in the prior corresponding period
- The full-year adjusted EBITDA margin is expected to land at around 20%, a figure that places substantial reliance on a Q4 step-up to close the gap
A full-year margin target that depends on a Q4 surge, layered on top of an opex trajectory running hotter than revenue growth, tells you the profitability case is not yet structurally proven. The headline numbers look impressive, but the margin path to get there is narrow and back-weighted, which increases execution risk if anything slips late in the year.
Three signals that will determine whether this selloff holds or reverses
Rather than reaching a verdict on a single session’s price action, three data points at the Q3 FY26 result will tell investors whether the current repricing is warranted or whether it followed the same pattern as prior selloffs that subsequently reversed.
- MAU re-acceleration. Management needs to demonstrate, with specific data rather than qualitative assurances, that the second-half recovery toward the 20% full-year MAU target is on track. Resolution of the Android registration issue is part of this; persistence of the problem for another quarter would materially undermine the growth narrative.
- A guidance upgrade. Another strong quarter accompanied by a raised top end of revenue guidance (above US$685 million) would confirm that management has genuine forward visibility. Unchanged guidance after a third consecutive beat would deepen the credibility gap.
- Margin recovery and cost discipline. Investors will want to see operating expense growth moderating toward revenue growth rates and gross margins recovering toward the prior 81% level, confirming that the investment phase is yielding durable scale rather than ongoing cost pressure.
Recovery precedent: Following the Q1 FY26 result on 12 May 2026, Life360 shares retraced their 10.8% post-earnings decline in fewer than three weeks. Whether Q2’s sharper selloff follows a similar trajectory depends on how these three signals develop.
If Q3 delivers MAU re-acceleration, a guidance upgrade, and gross margin improvement simultaneously, the current selloff will look in retrospect like a mispricing. If any one of those three fails to materialise, the multiple compression may deepen further.
A strong result, a rational market, and a high bar that keeps moving
Life360 is genuinely executing well. Record revenue of US$159.0 million, a 22% EBITDA beat, and 102.4 million monthly active users are not the financials of a company in trouble. But it is priced for a growth trajectory that requires near-flawless forward execution, and two consecutive quarters of MAU deceleration have introduced doubt about whether that trajectory is intact.
A stock falling 18% on record revenue is not irrational when the investor base is pricing the next three years, not the last three months. The recovery precedent from post-Q1 exists, but it relied on maintained growth credibility. Whether Q2’s selloff reverses on a similar timeline depends entirely on whether Q3 delivers the MAU re-acceleration, guidance upgrade, and margin improvement the market is now demanding.
At A$25.52 (down 13.4% at the time of reporting on 11 August 2026), the share price reflects a market that has heard the qualitative assurances and is waiting for quantitative proof.
For readers wanting broader context on how ASX software businesses are valued and why rate sensitivity amplifies post-earnings moves, our full explainer on ASX tech valuations covers gross margin structures, recurring revenue mechanics, and historical price-to-sales resets across the sector.
This article is for informational purposes only and should not be considered financial advice. Investors should conduct their own research and consult with financial professionals before making investment decisions. Past performance does not guarantee future results. Financial projections are subject to market conditions and various risk factors.