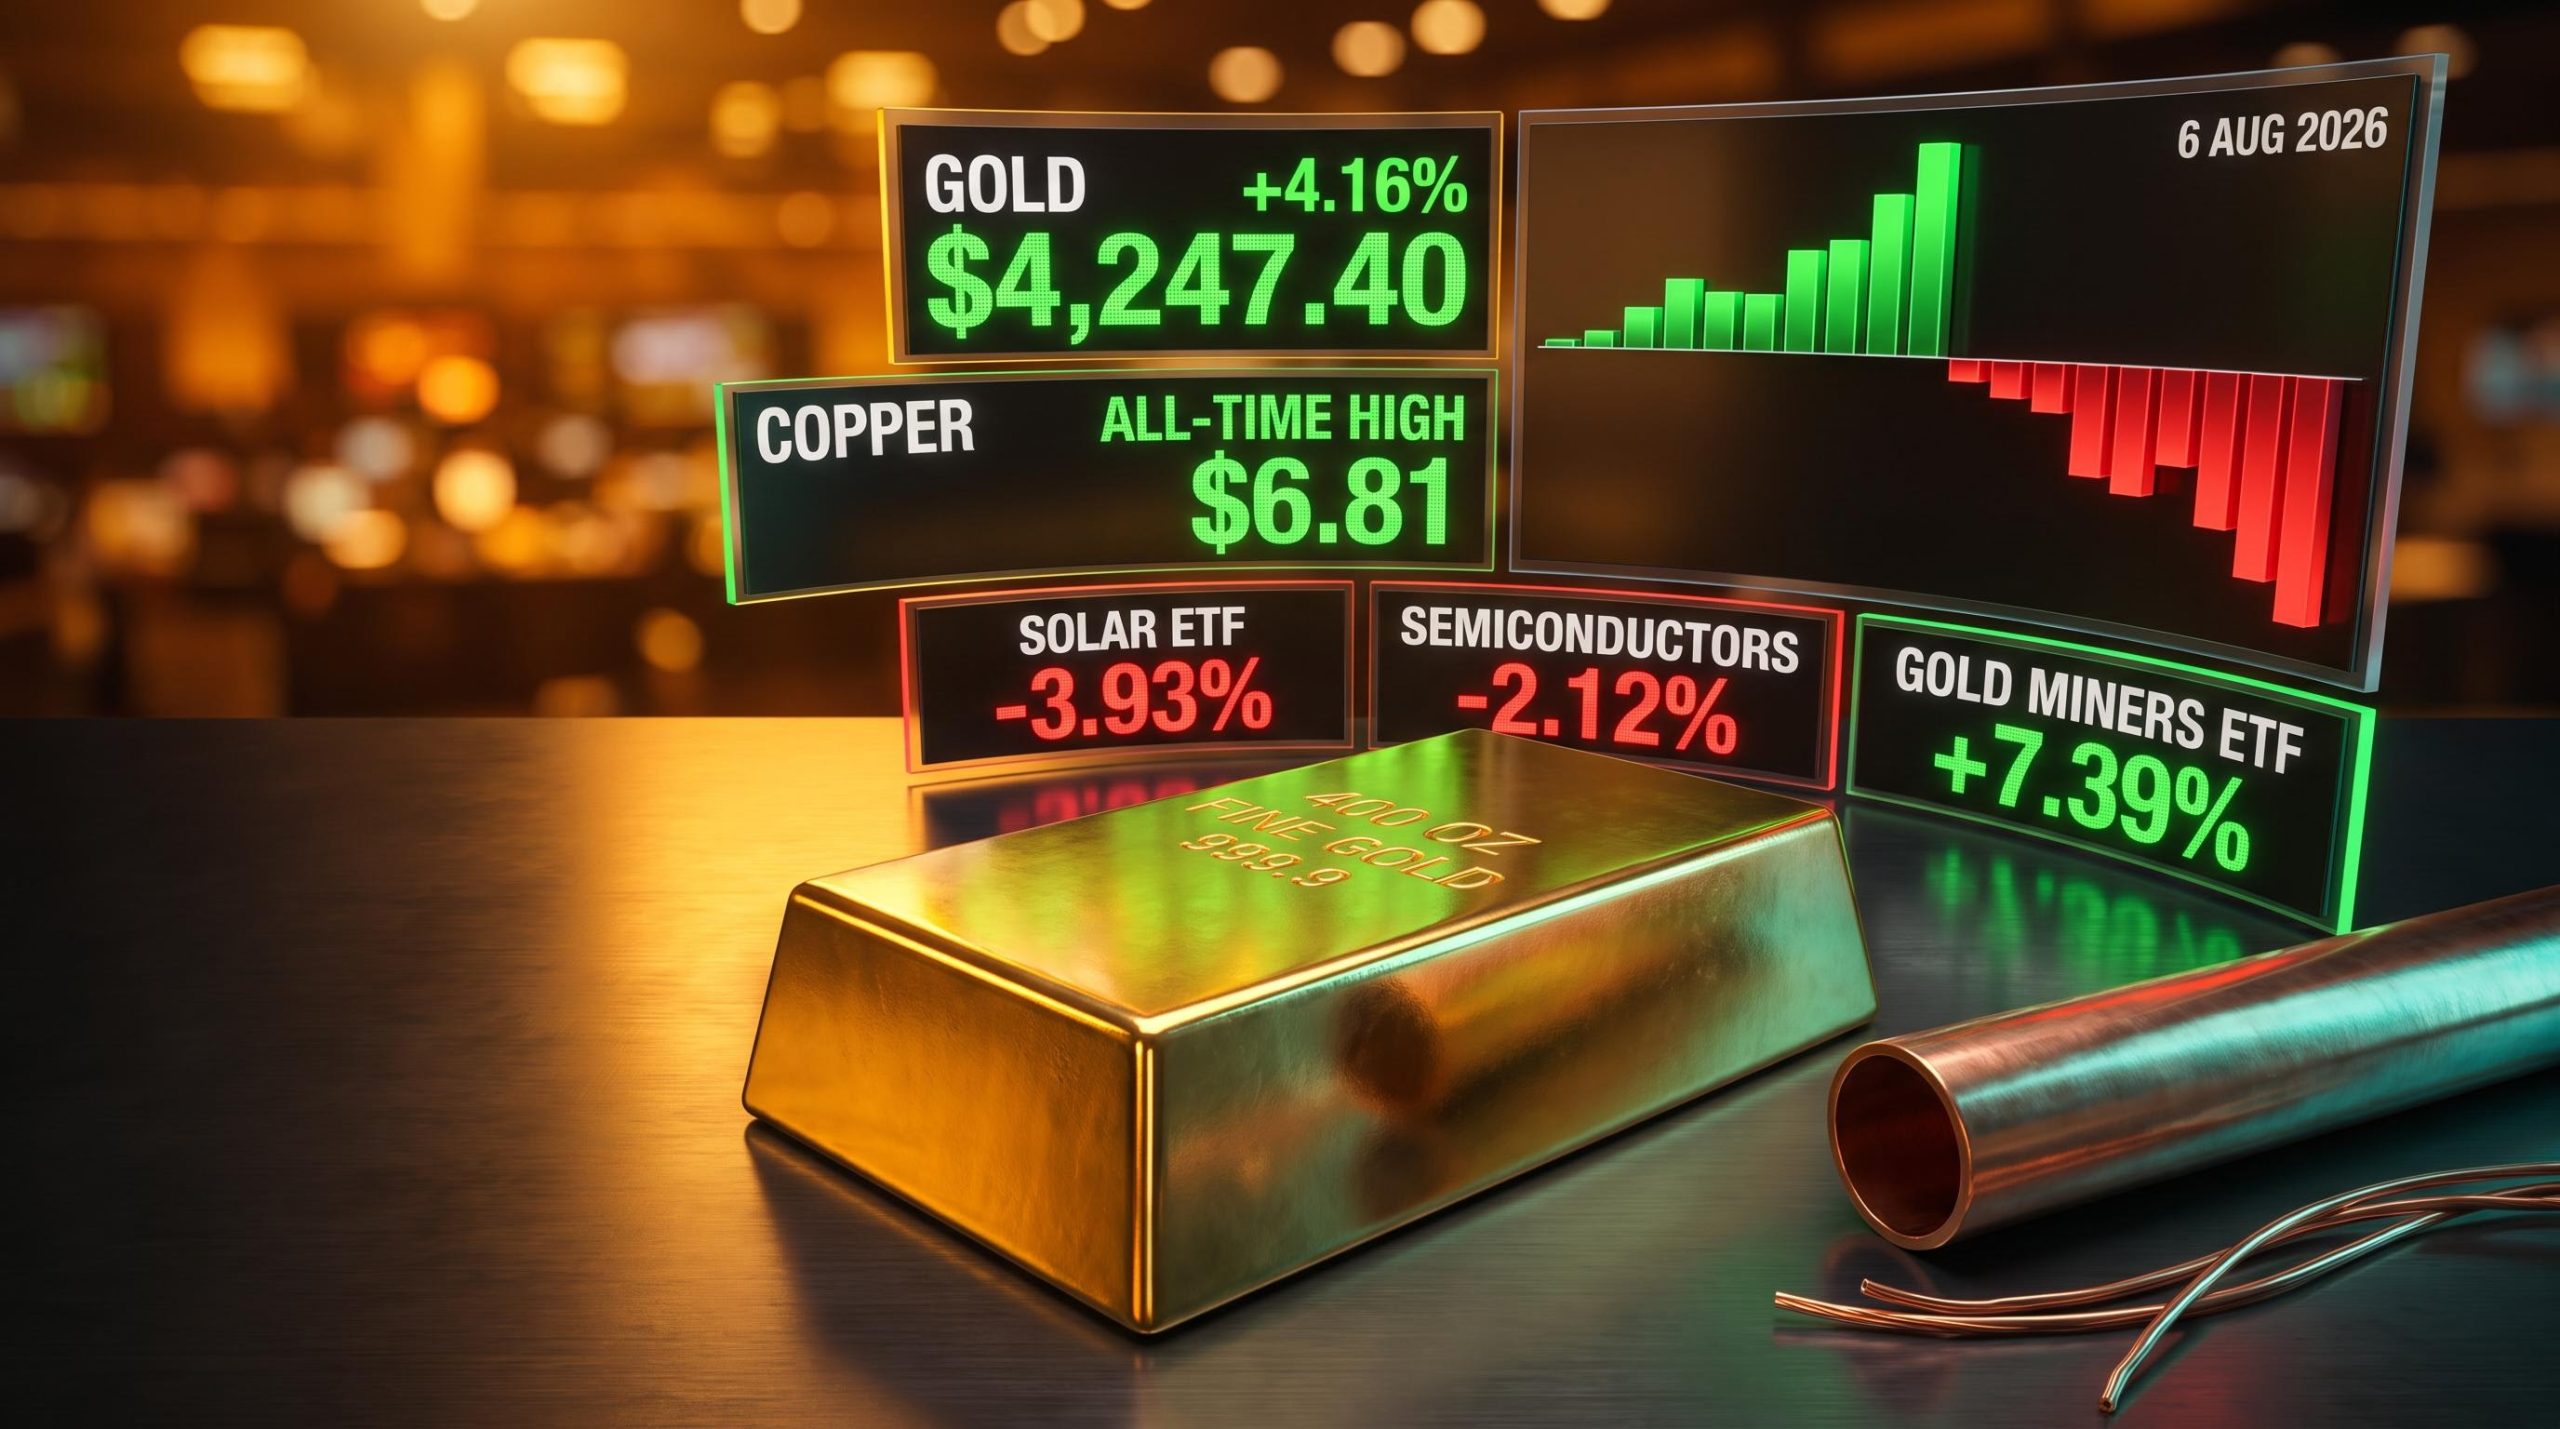
On 6 August 2026, gold posted a 4.16% advance to settle at US$4,247.40, its best single-session performance since 28 January 2026. Copper set an all-time high in the same session, reaching US$6.81 per pound intraday before closing near US$6.72. Oil barely moved.
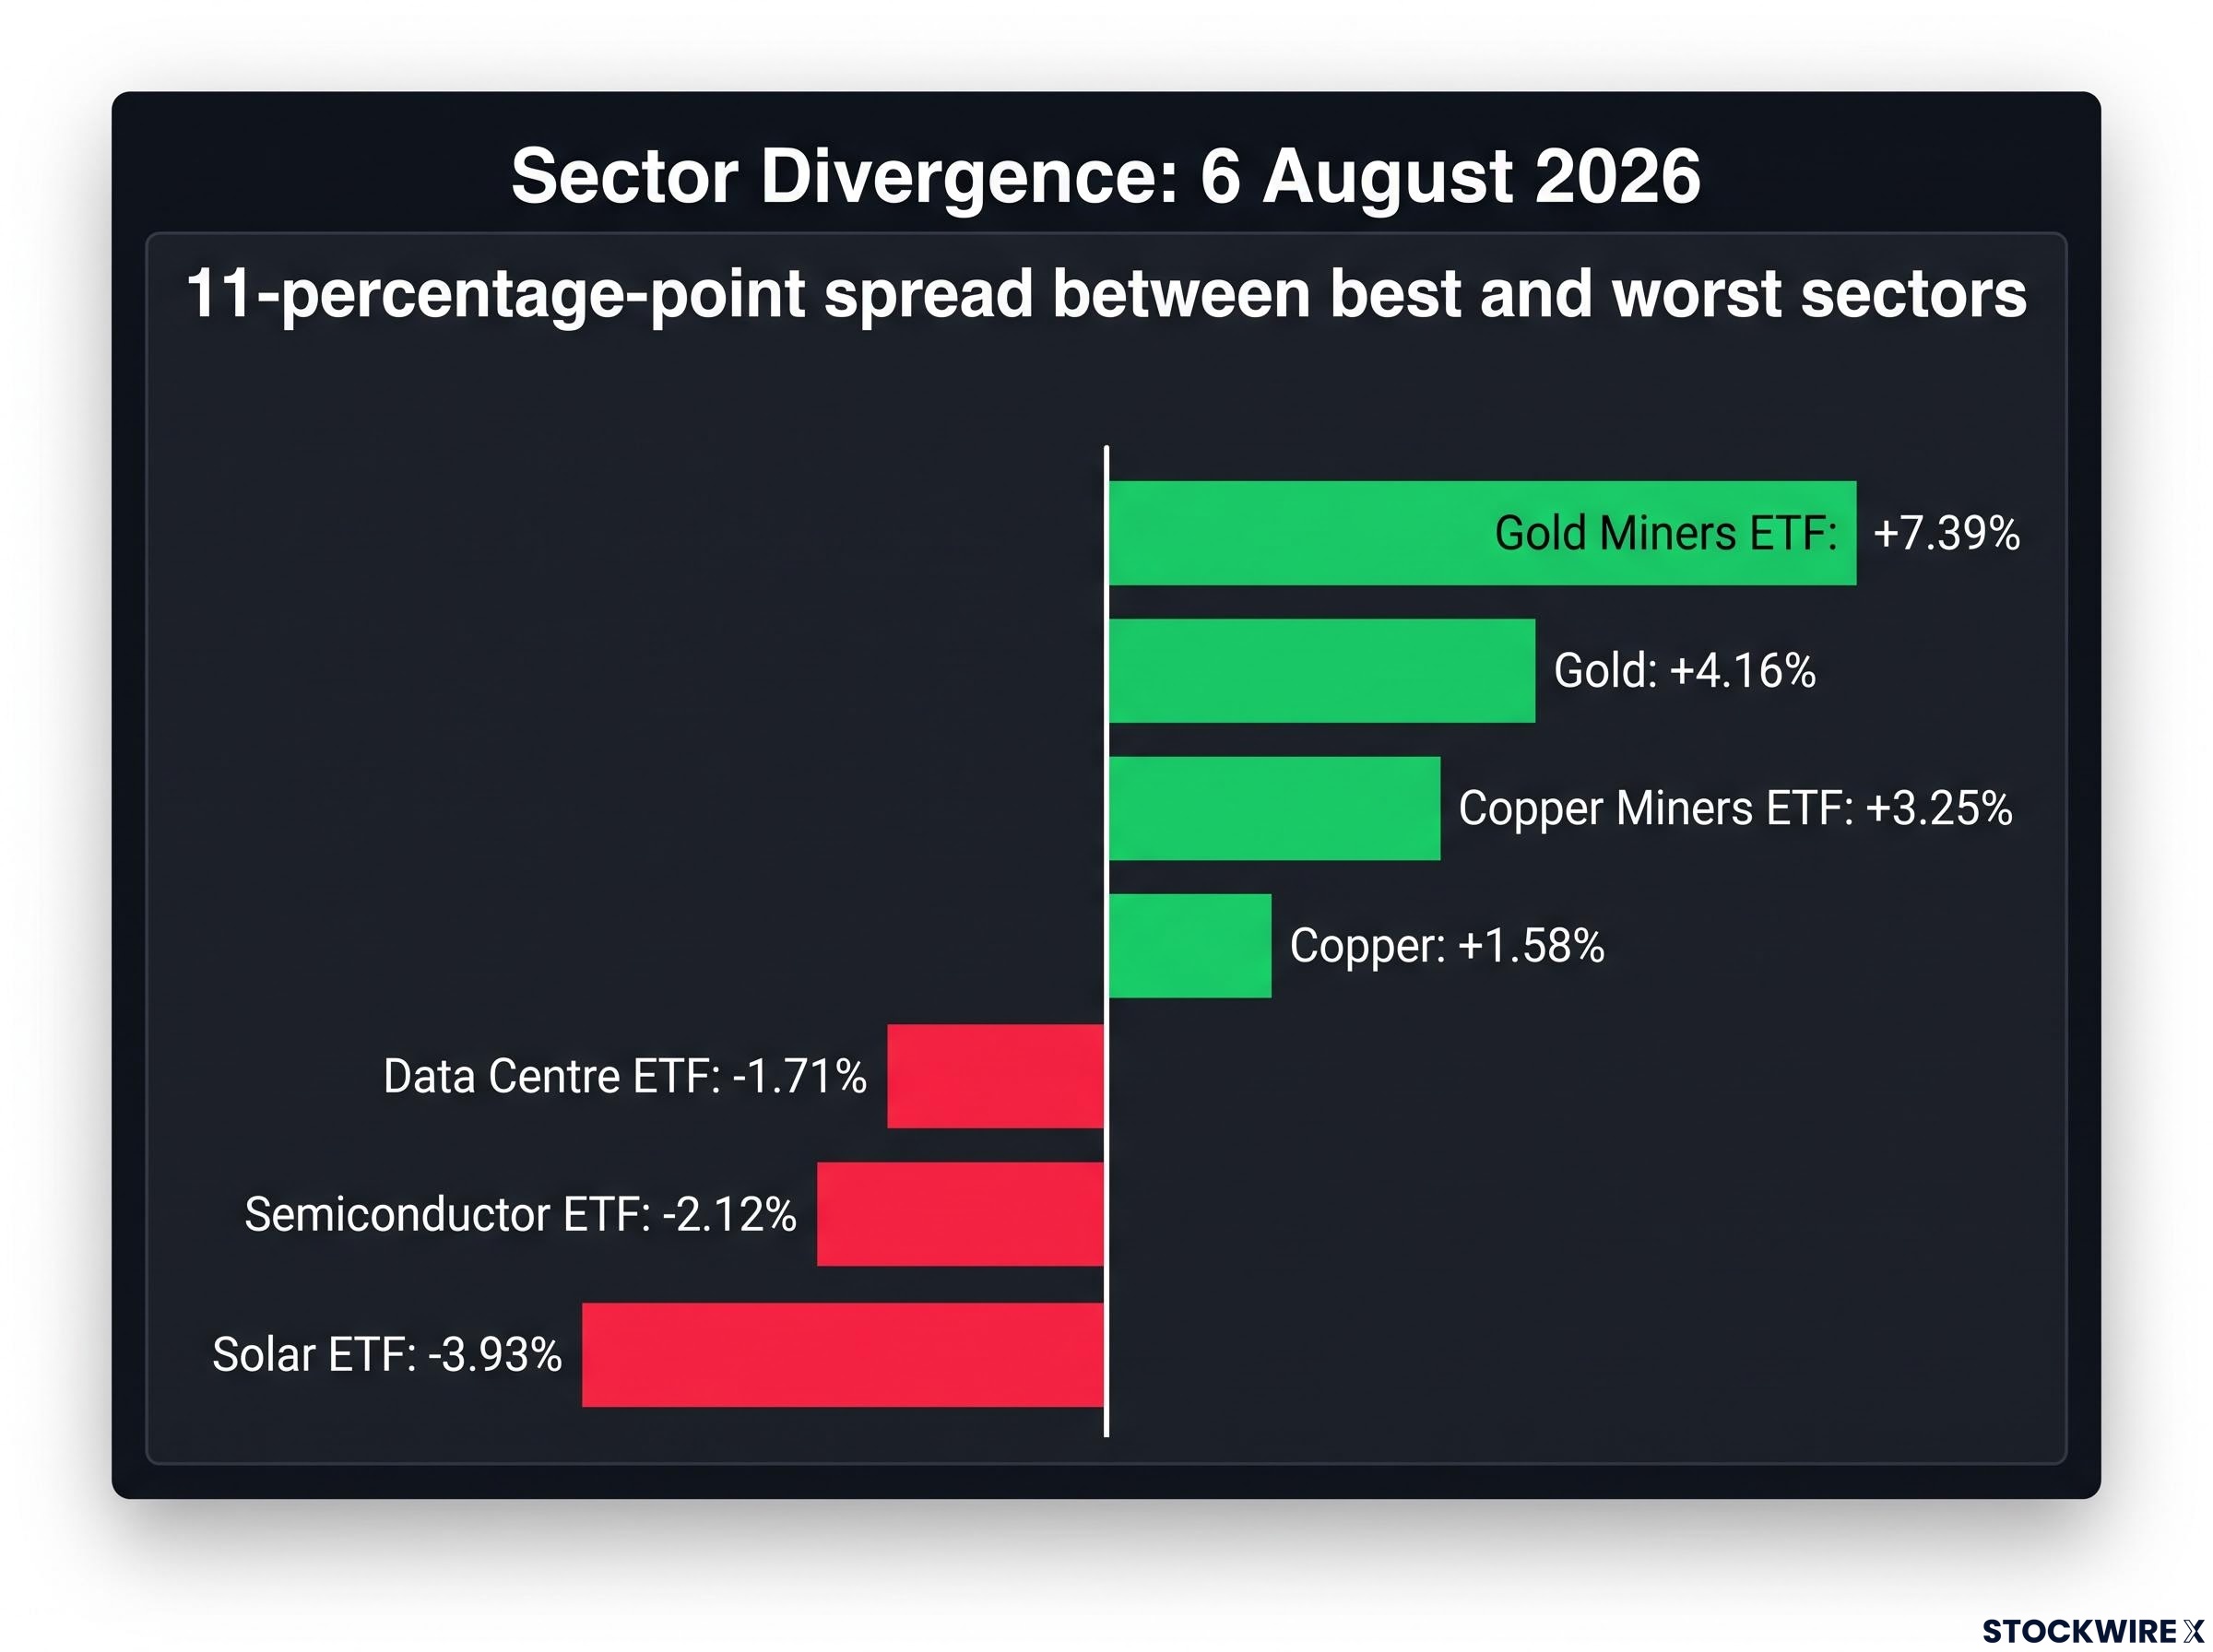
That combination is the story. This was not a broad commodity inflation trade or a generic risk-off session. Trade and industrial policy actions hit multiple sectors simultaneously on 6 August, repricing hard assets upward and policy-exposed growth equities downward within the same trading day. The split was sharp enough that the best-performing sector ETF finished more than 11 percentage points ahead of the worst.
Here is what the session’s data actually tells you about where capital rotated, which policy actions triggered the divergence, and how to read the difference between a one-day spike and a structural shift in commodity positioning.
Gold breaks $4,200 and copper sets an all-time high on the same session
The headline numbers landed across two metals, not one. The 4.16% surge carried gold to a closing price of US$4,247.40, a level not reached in over six weeks. Copper’s 1.58% advance pushed it to a record session high of US$6.81 per pound, surpassing the previous all-time high set on 2 June 2026.
Oil told the opposite story:
- Gold: +4.16%, close US$4,247.40, strongest single-day gain since 28 January 2026
- Copper: +1.58% close near US$6.72 per pound, record intraday high US$6.81
- WTI crude: –0.73% to US$75.22; Brent crude: +1.2% to US$79.62
The muted oil performance matters. If this had been a general inflation or energy shock, crude would have participated. Instead, gold and copper surged while oil barely registered. That distinction tells you the driver was specific: trade and policy events, not a macro repricing of energy or broad commodity supply.
When big ASX news breaks, our subscribers know first
Why this rally looks different from a typical safe-haven spike
The reflex is to see gold up 4% and call it fear. But copper rising to an all-time high on the same session complicates that reading considerably. If this were pure safe-haven demand, industrial metals would typically lag or decline, not set records.
Gold’s largest single-day moves over the past 18-24 months have consistently coincided with discrete policy events: tariff announcements, export-control changes, and shifts in Fed rate expectations. The 6 August session fits that pattern precisely. A weaker dollar lifted dollar-denominated commodities broadly, while policy uncertainty added a scarcity and supply-chain premium specific to copper and critical minerals.
Copper’s record builds on structural demand that has been compounding for years. Electric vehicle production, grid upgrades, and data-centre build-outs have created a demand floor that did not exist a decade ago. The fact that copper’s 6 August high surpassed a previous all-time record set just two months earlier signals sustained structural tightness, not a one-day squeeze.
The breadth of the 6 August materials bid, spanning gold, copper, lithium, uranium, and steel simultaneously, matches the cross-commodity signature that historians of the commodity supercycle identify as distinguishing a structural regime shift from a cyclical bounce.
When gold and copper rise together, the market is pricing two distinct things simultaneously: macro uncertainty through gold and structural supply constraint through copper.
That dual signal has different implications for position duration than a pure fear trade. Investors who read this as generic safe-haven sentiment and exit early may miss the structural copper story entirely.
What the ETF scorecard reveals about where investors moved capital
The ETF data maps exactly where capital went, and where it came from. Gold Miners ETF gained 7.39% against gold’s 4.16%. Copper Miners ETF gained 3.25% against copper’s 1.58%. The leverage relationship between the metals and their miners was visible in real time.
The hard-asset rotation extended well beyond precious metals miners. Steel (+1.35%), Lithium and Battery Tech (+1.34%), Strategic Metals (+1.31%), and Uranium (+0.94%) all posted gains, confirming the breadth of the materials bid.
The losers were equally specific. Solar fell 3.93%, Semiconductors dropped 2.12%, and Data Centre and Digital Infrastructure declined 1.71%. These are sectors sitting directly in the crosshairs of trade-policy actions announced on the same day.
| ETF | Change (%) | Close |
|---|---|---|
| Session Gainers | ||
| Gold Miners ETF | +7.39% | 83.68 |
| Silver Miners ETF | +6.59% | 83.77 |
| Copper Miners ETF | +3.25% | 86.72 |
| Steel ETF | +1.35% | 110.0 |
| Lithium and Battery Tech ETF | +1.34% | 72.65 |
| Session Losers | ||
| Solar ETF | -3.93% | 51.27 |
| Semiconductor ETF | -2.12% | 530.7 |
| Data Centre ETF | -1.71% | 28.2 |
| FinTech ETF | -1.25% | 26.42 |
Selected Sector ETF Performance, 6 August 2026.
An 11-percentage-point spread between the best and worst sector ETFs in a single session is not noise. It is a high-conviction directional rotation, and if you hold equity positions across tech, clean energy, and materials simultaneously, your relative allocations shifted meaningfully today.
The trade policy moves that triggered the split session
Four distinct policy actions converged on 6 August, each with a traceable market impact:
- Polysilicon tariffs and minimum import pricing. The US administration prepared tariff measures on polysilicon imports, potentially effective as early as 6 August, according to Bloomberg. The Solar ETF’s 3.93% decline followed directly.
- Optical transceiver ban deliberations. According to Bloomberg, the US government considered prohibiting Chinese optical transceivers from entering data-centre supply chains, a step that risked undermining the existing trade truce. The deliberations centred on the US$61.6 million worth of these components China shipped in June 2026. The Semiconductor ETF (-2.12%) and Data Centre ETF (-1.71%) absorbed the hit.
- Tungsten and battery material export restrictions. The US announced restrictions on exports of tungsten scrap and recycled battery materials, effective later in August 2026. In retaliation, Beijing introduced tighter controls on drone exports and imposed sanctions on a number of US firms, according to Bloomberg.
- IEEPA tariff refund backdrop. According to the Financial Times, the administration had repaid around US$100 billion in duties originally collected under the International Emergency Economic Powers Act (IEEPA), covering approximately 60% of the tariffs that the Supreme Court had struck down.
The breadth is the signal. Polysilicon, optical transceivers, tungsten, battery materials: these are not the same supply chain. When trade and industrial policy moves simultaneously across multiple input categories in a single session, it tells you that policy sensitivity has become a persistent cross-sector risk for any portfolio with materials or technology exposure.
The mechanics of a mining equity: why miners moved more than the metals did
The Gold Miners ETF gained 7.39% on a day gold rose 4.16%. The Copper Miners ETF gained 3.25% on a day copper rose 1.58%. That amplification is not random. It is operational leverage, a structural feature of how mining companies earn money.
Mining company revenues rise directly with commodity prices. But a significant portion of their costs, including labour, equipment leases, and processing infrastructure, are fixed regardless of the spot price. When the commodity price rises, that incremental revenue flows almost entirely to the operating margin. A 4% increase in the gold price can produce a much larger percentage increase in a miner’s earnings.
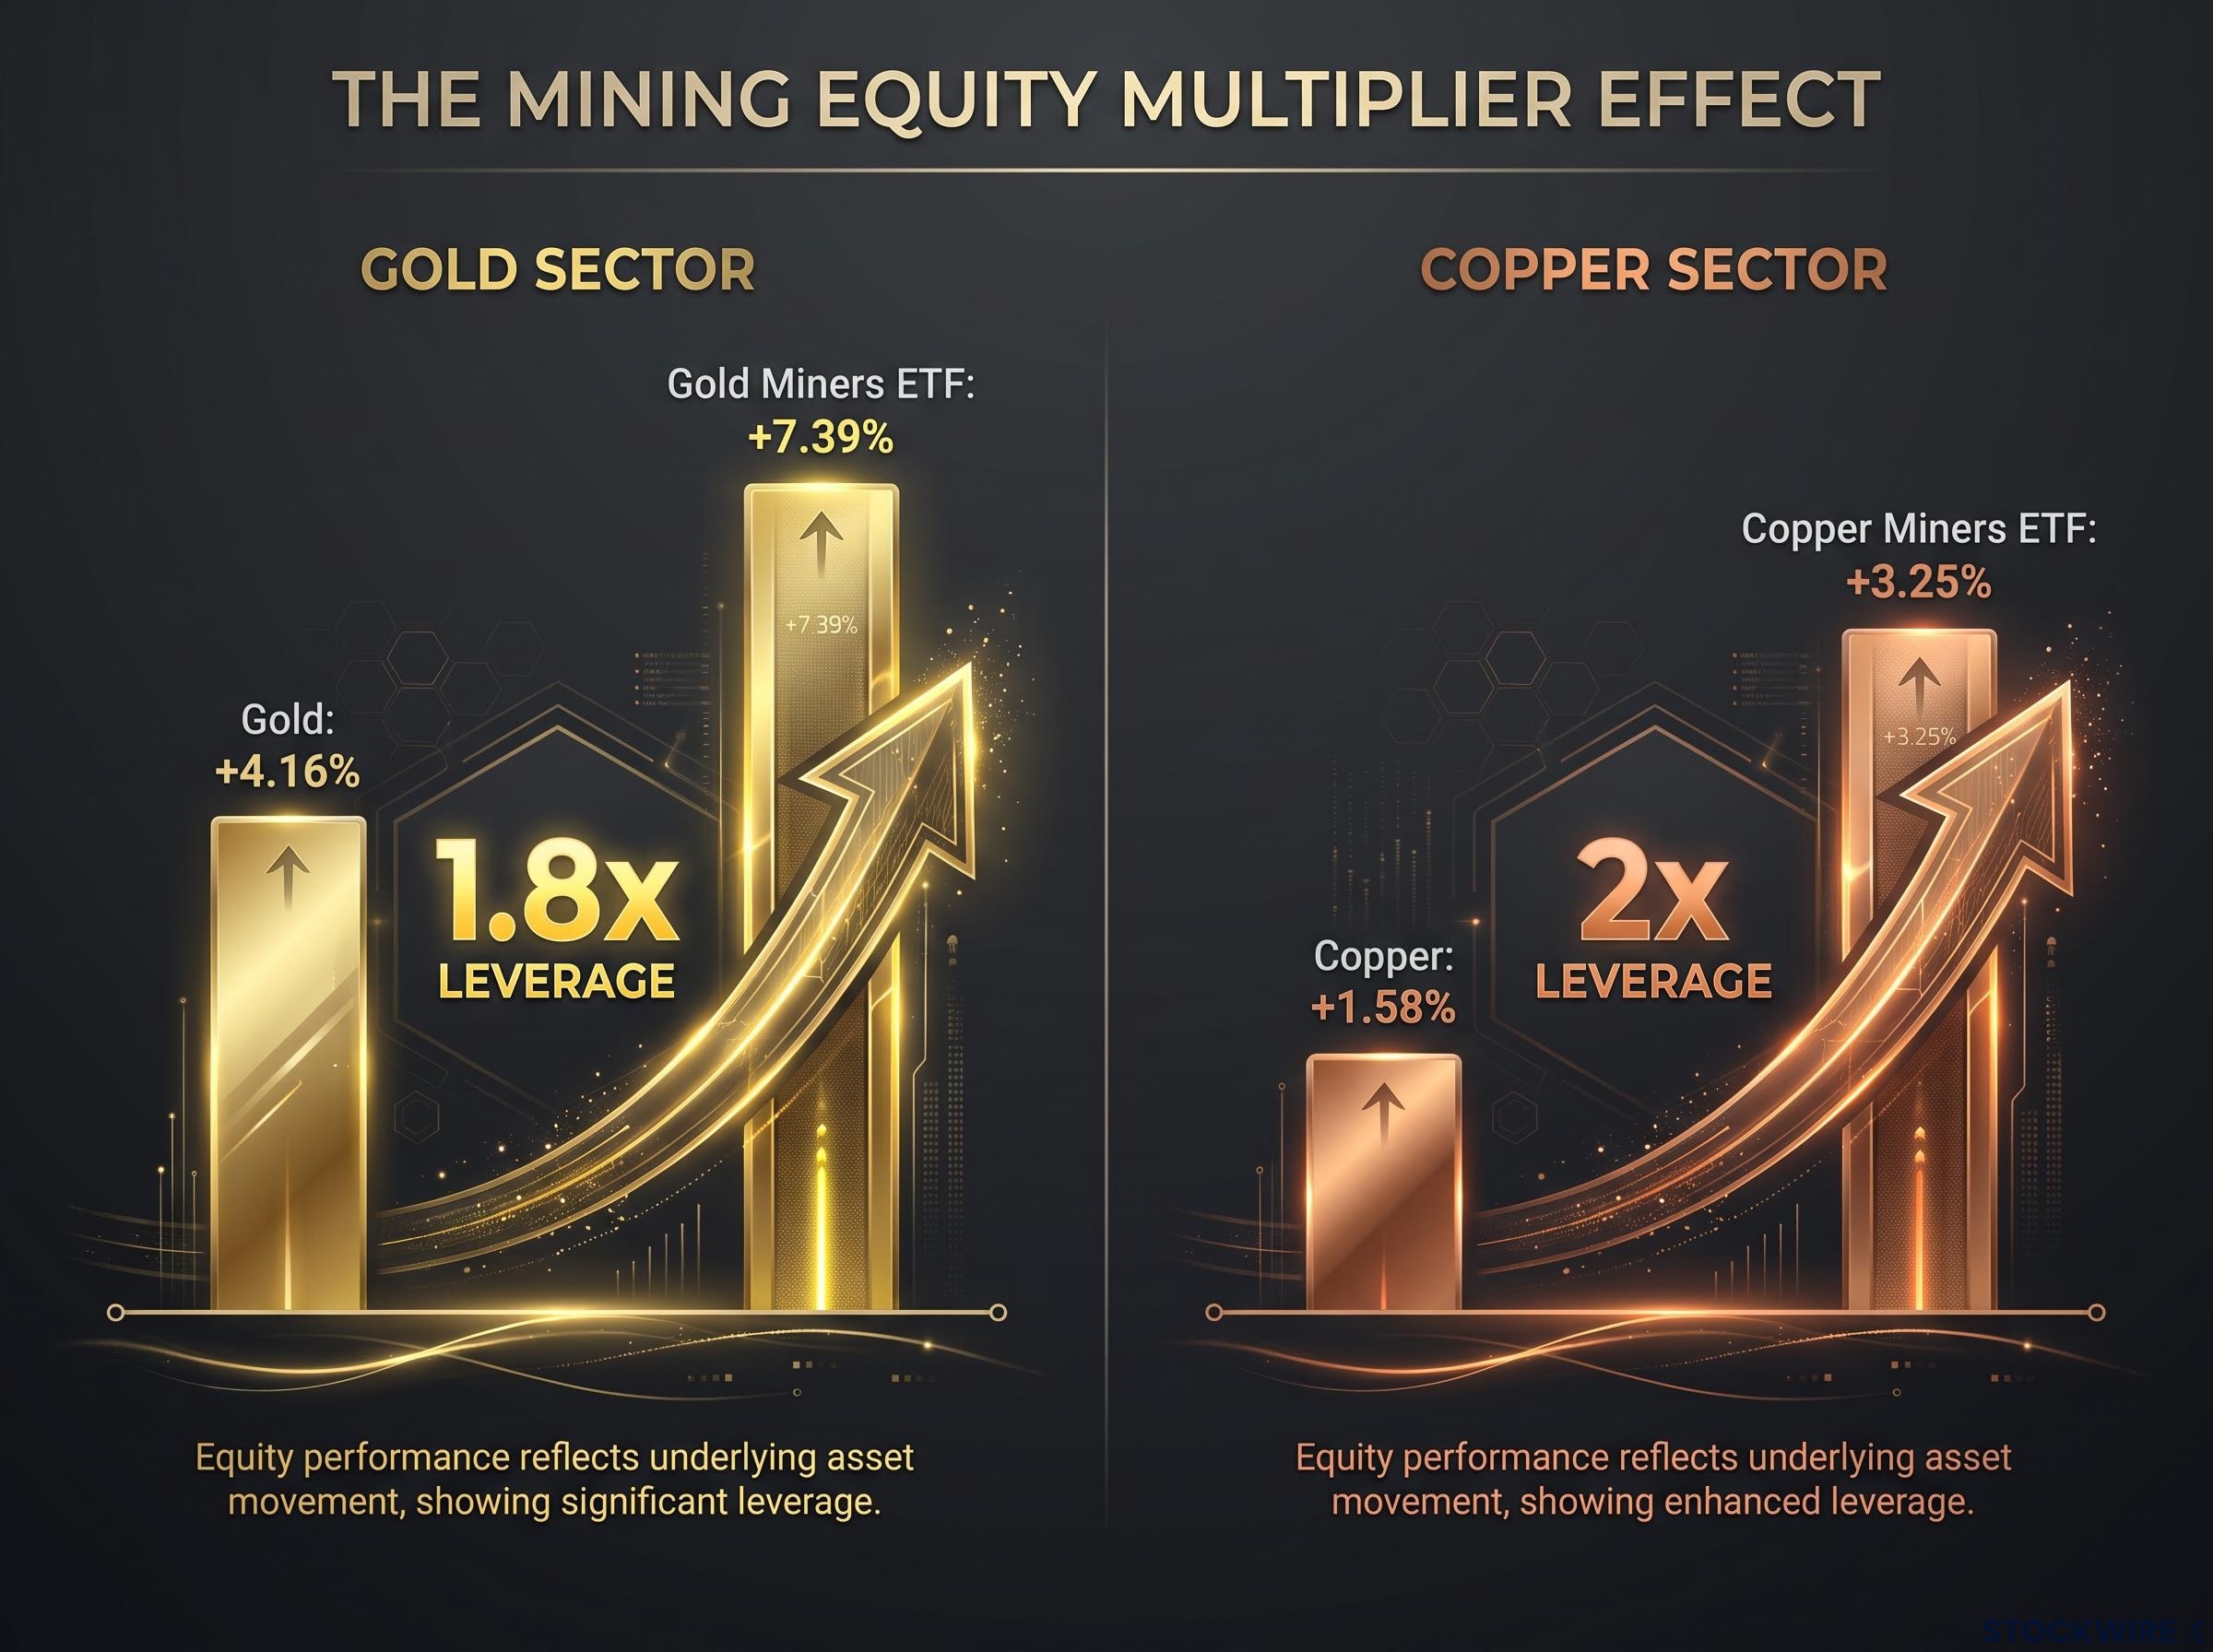
- Gold +4.16% vs Gold Miners ETF +7.39% (approximately 1.8x leverage on this session)
- Copper +1.58% vs Copper Miners ETF +3.25% (approximately 2x leverage on this session)
This pattern held consistently during prior record-high episodes in metals over the past 18-24 months.
Mining ETF positioning has shifted from a retail curiosity to an institutional allocation tool, with assets under management surging 136% to US$87.4 billion in the twelve months to March 2026, context that helps explain why the Gold Miners ETF and Copper Miners ETF amplified metals moves so visibly on 6 August.
The leverage works symmetrically on the downside. If the commodity breakout fails or reverses, mining equities will amplify the drawdown at a similar ratio. That changes the risk profile relative to holding the physical commodity or a commodity-tracking ETF directly. Before treating mining ETFs as simple commodity proxies, you need to understand that the instrument carries a built-in multiplier in both directions.
What to watch before calling this a sustained breakout
A strong single session is not a confirmed trend change. Whether 6 August marks the start of a sustained move or a sharp mean-reversion depends on a specific set of variables:
- Gold consolidation at US$4,200. Whether gold holds above this threshold in the sessions following the surge is historically significant. Prior sharp single-day rallies have sometimes given back gains within a week when the policy catalyst faded.
- Copper follow-through above US$6.72-6.81. Sustained closes above the previous all-time high would confirm structural demand and supply constraint are dominating. A failure to hold would suggest a single-session squeeze.
- Polysilicon measures. The final scope, confirmed timing, and whether the 6 August implementation date holds will determine whether the Solar ETF’s decline deepens or stabilises.
- Optical transceiver ban decision. Whether the US proceeds with a ban on Chinese modules, and how that affects the existing trade truce, will shape the semiconductor and data-centre outlook for weeks.
- Tungsten and battery material restrictions. Effective dates, enforcement detail, and any Chinese countermeasures, expected later in August 2026.
- IEEPA refund completion. The remaining approximately 40% of struck-down duties yet to be returned could affect broader risk sentiment depending on timing and political framing.
A copper supply deficit already projected at 520,000 metric tonnes for 2026 by UBS, more than double the prior year’s shortfall, means the session’s record intraday high arrived against a physical market backdrop where concentrate scarcity was already confirmed by benchmark TC/RC charges collapsing to zero.
Tracking these variables, not just gold and copper prices in isolation, gives you an earlier read on whether the policy-driven catalyst remains active or is being resolved.
What 6 August 2026 changes about reading commodity moves
The 6 August session demonstrated a pattern that has been building for 18-24 months but arrived with unusual clarity on this day. A single session’s trade-policy news flow simultaneously boosted hard assets, repriced entire equity sectors downward, and reshaped the relative attractiveness of materials versus growth technology.
Three categories of exposure were visible in real time. Hard-asset hedges (gold, copper, miners) benefited directly. Structural-demand plays (lithium, uranium, steel) participated. Policy-crosshair sectors (solar, semiconductors, data centres) paid the price. Understanding which of your holdings falls into which category is more useful than watching any single commodity price level.
Trade and industrial policy is now a tier-one market variable. The 6 August session is evidence, not anomaly.
For investors wanting to understand the broader framework behind why policy announcements now move individual sector ETFs by 3-7% in a single session, our full explainer on political influence in U.S. equity pricing examines how direct government equity stakes and announcement timing strategies have embedded political risk permanently into semiconductor, critical minerals, and steel valuations.
The investor who carries that three-category framework forward has a more durable analytical tool than any single trade idea this session might have suggested. Policy sensitivity is now as relevant to sector allocation as earnings growth or interest rate expectations, and the 6 August commodity surge confirmed it.
This article is for informational purposes only and should not be considered financial advice. Investors should conduct their own research and consult with financial professionals before making investment decisions. Past performance does not guarantee future results.