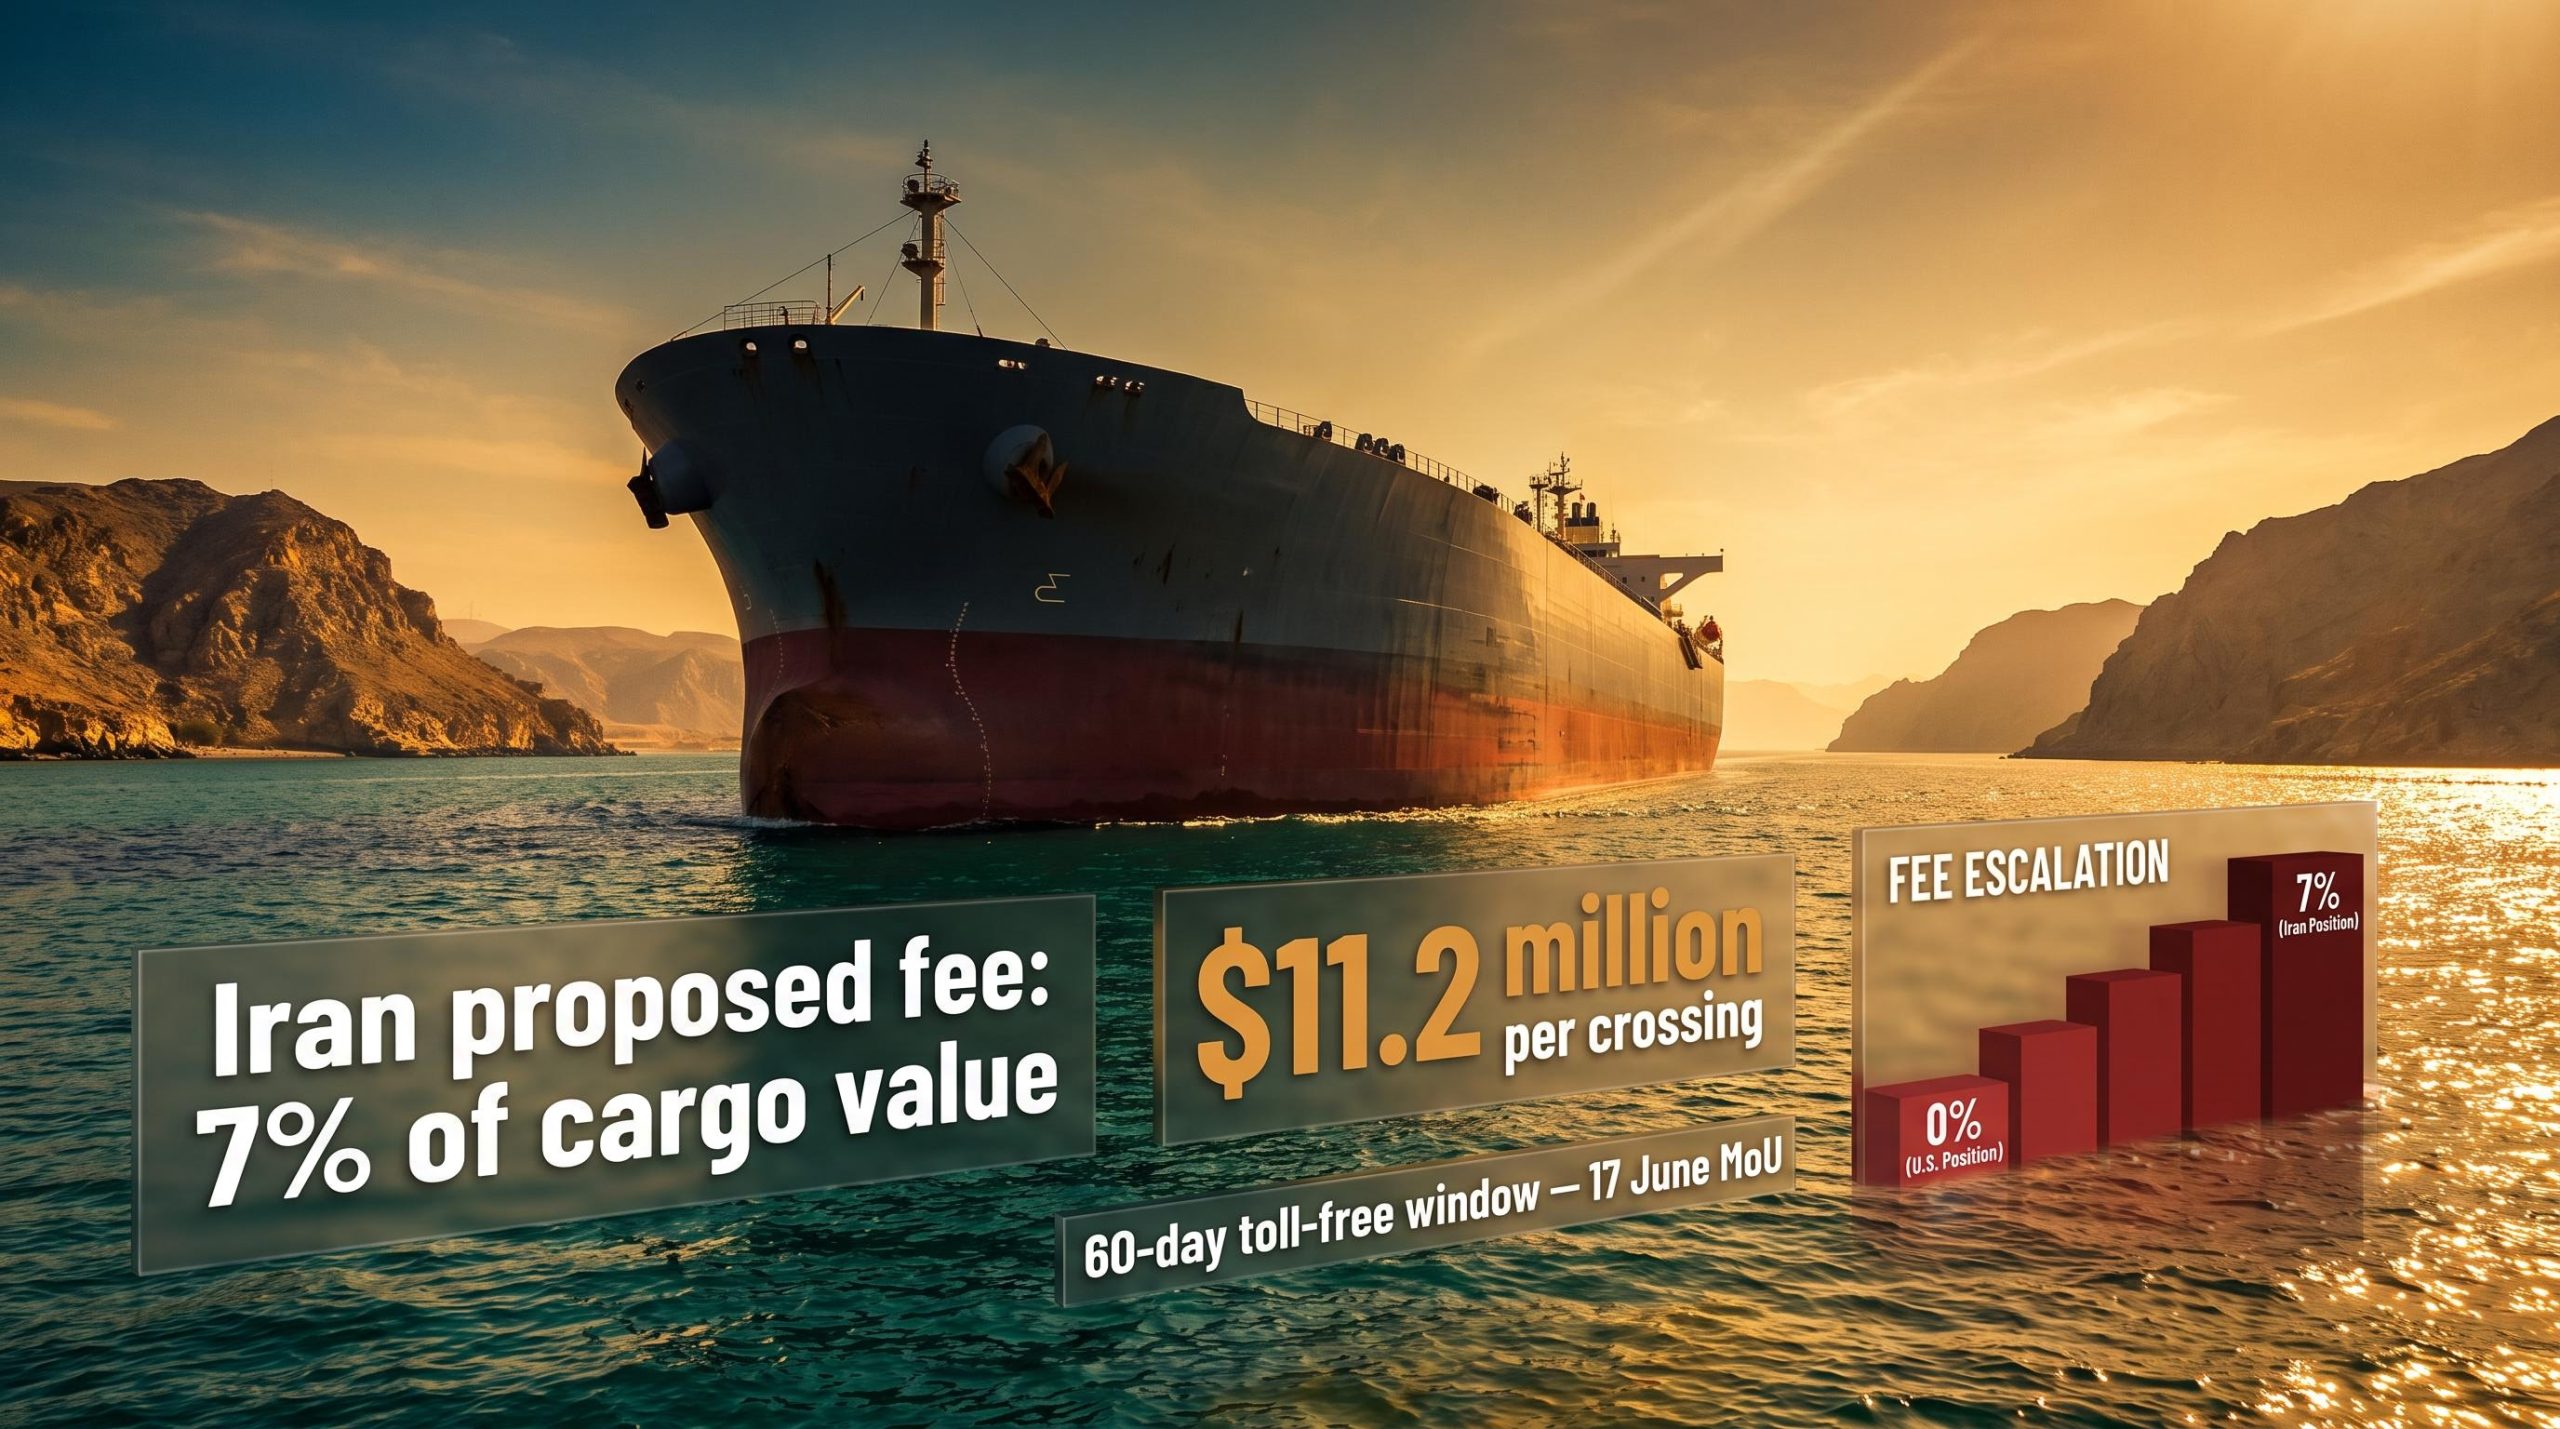
Tehran and Muscat have agreed on navigational lane coordinates for the Strait of Hormuz in a preliminary framework that could place Iran in the role of traffic authority over the world’s most critical energy passage, putting it on a direct collision course with Washington’s stated demand that Tehran must have no gatekeeping role over the waterway. According to Reuters, an Iranian official familiar with the draft terms indicated the arrangement would position Tehran to oversee vessels moving into the Gulf, with Iran’s proposed transit levy reaching as high as 7% of a cargo’s declared value, a charge that against a single supertanker shipment works out to approximately $11.2 million per crossing.
The arrangement sits against a specific backdrop. A 17 June memorandum of understanding (MoU) reopened commercial traffic and guaranteed toll-free passage for 60 days while all sides negotiate a longer-term governance framework. That window is the clock against which three competing visions, Tehran’s control ambitions, Muscat’s voluntary-fee model, and Washington’s insistence on zero mandatory charges, are now colliding.
Here is what the fee proposals actually mean in dollar terms, and which parts of a portfolio are most exposed if a control regime takes hold.
The deal on the table: what Iran and Oman have actually agreed to
The word “deal” overstates what exists. Iran’s Foreign Ministry Spokesperson Esmail Baghaei confirmed that the two countries have reached agreement on the geographic lane coordinates for transit through the strait, laying out the structural skeleton on which any future governance arrangement would be built. The substance, who controls what and at what price, remains unresolved.
The 17 June MoU is the operational baseline: toll-free passage for 60 days, during which Iran claims its port and military authorities are responsible for managing traffic and beginning demining operations. Iran’s core proposal goes well beyond coordination. Tehran wants both inbound and outbound traffic lanes routed through Iranian territorial waters, establishing de facto oversight of the entire chokepoint. One of the main points still being negotiated, as of 6 August 2026, is how much control Iran would have over outbound ships.
Iranian, Omani, and U.S. sources all say talks are ongoing and no new accord has been finalised. The three parties hold fundamentally different positions:
- Iran: Seeks formal control over both traffic lanes by routing them through Iranian territorial waters, with mandatory fees on cargo value
- Oman: Proposes a joint 50-50 lane-management model with voluntary service fees to finance maritime security and environmental protection
- U.S.: Insists on zero mandatory fees and no Iranian gatekeeping authority over transit
The fact that “control” is the central unresolved term tells you the outcome range here is extremely wide, from a modest administrative coordination role to effective gatekeeping authority over a fifth of the world’s energy supply. That distinction matters enormously for how markets should price this risk, and it is why any single headline announcing a “deal” needs to be read for its internal architecture, not its sentiment.
When big ASX news breaks, our subscribers know first
Three positions, one chokepoint: why the fee gap is wider than it looks
Iran’s opening position is a fee of 5-7% of cargo value on ships transiting the strait, up to 7% according to a senior Iranian official cited by Reuters. Oman has countered with approximately 3%, framed not as a toll but as voluntary service fees tied to specific functions: navigation safety, environmental protection, and search-and-rescue operations, backed by other Gulf states. Washington’s position is simpler: 0%. No mandatory fees, full freedom of transit, no payments to Tehran.
The distance between those numbers becomes visceral when you attach them to an actual cargo. A Very Large Crude Carrier (VLCC) carries roughly 2 million barrels. At $80 per barrel, that is $160 million in cargo value.
| Party | Fee position | Framing |
|---|---|---|
| Iran | 5-7% of cargo value | Mandatory toll on transit |
| Oman | ~3% of cargo value | Voluntary service fee for maritime services |
| United States | 0% | No mandatory fees; freedom of transit preserved |
At the 7% level, a single VLCC transit would cost approximately $11.2 million, or roughly $5-6 per barrel in additional cost layered onto every barrel of Gulf crude.
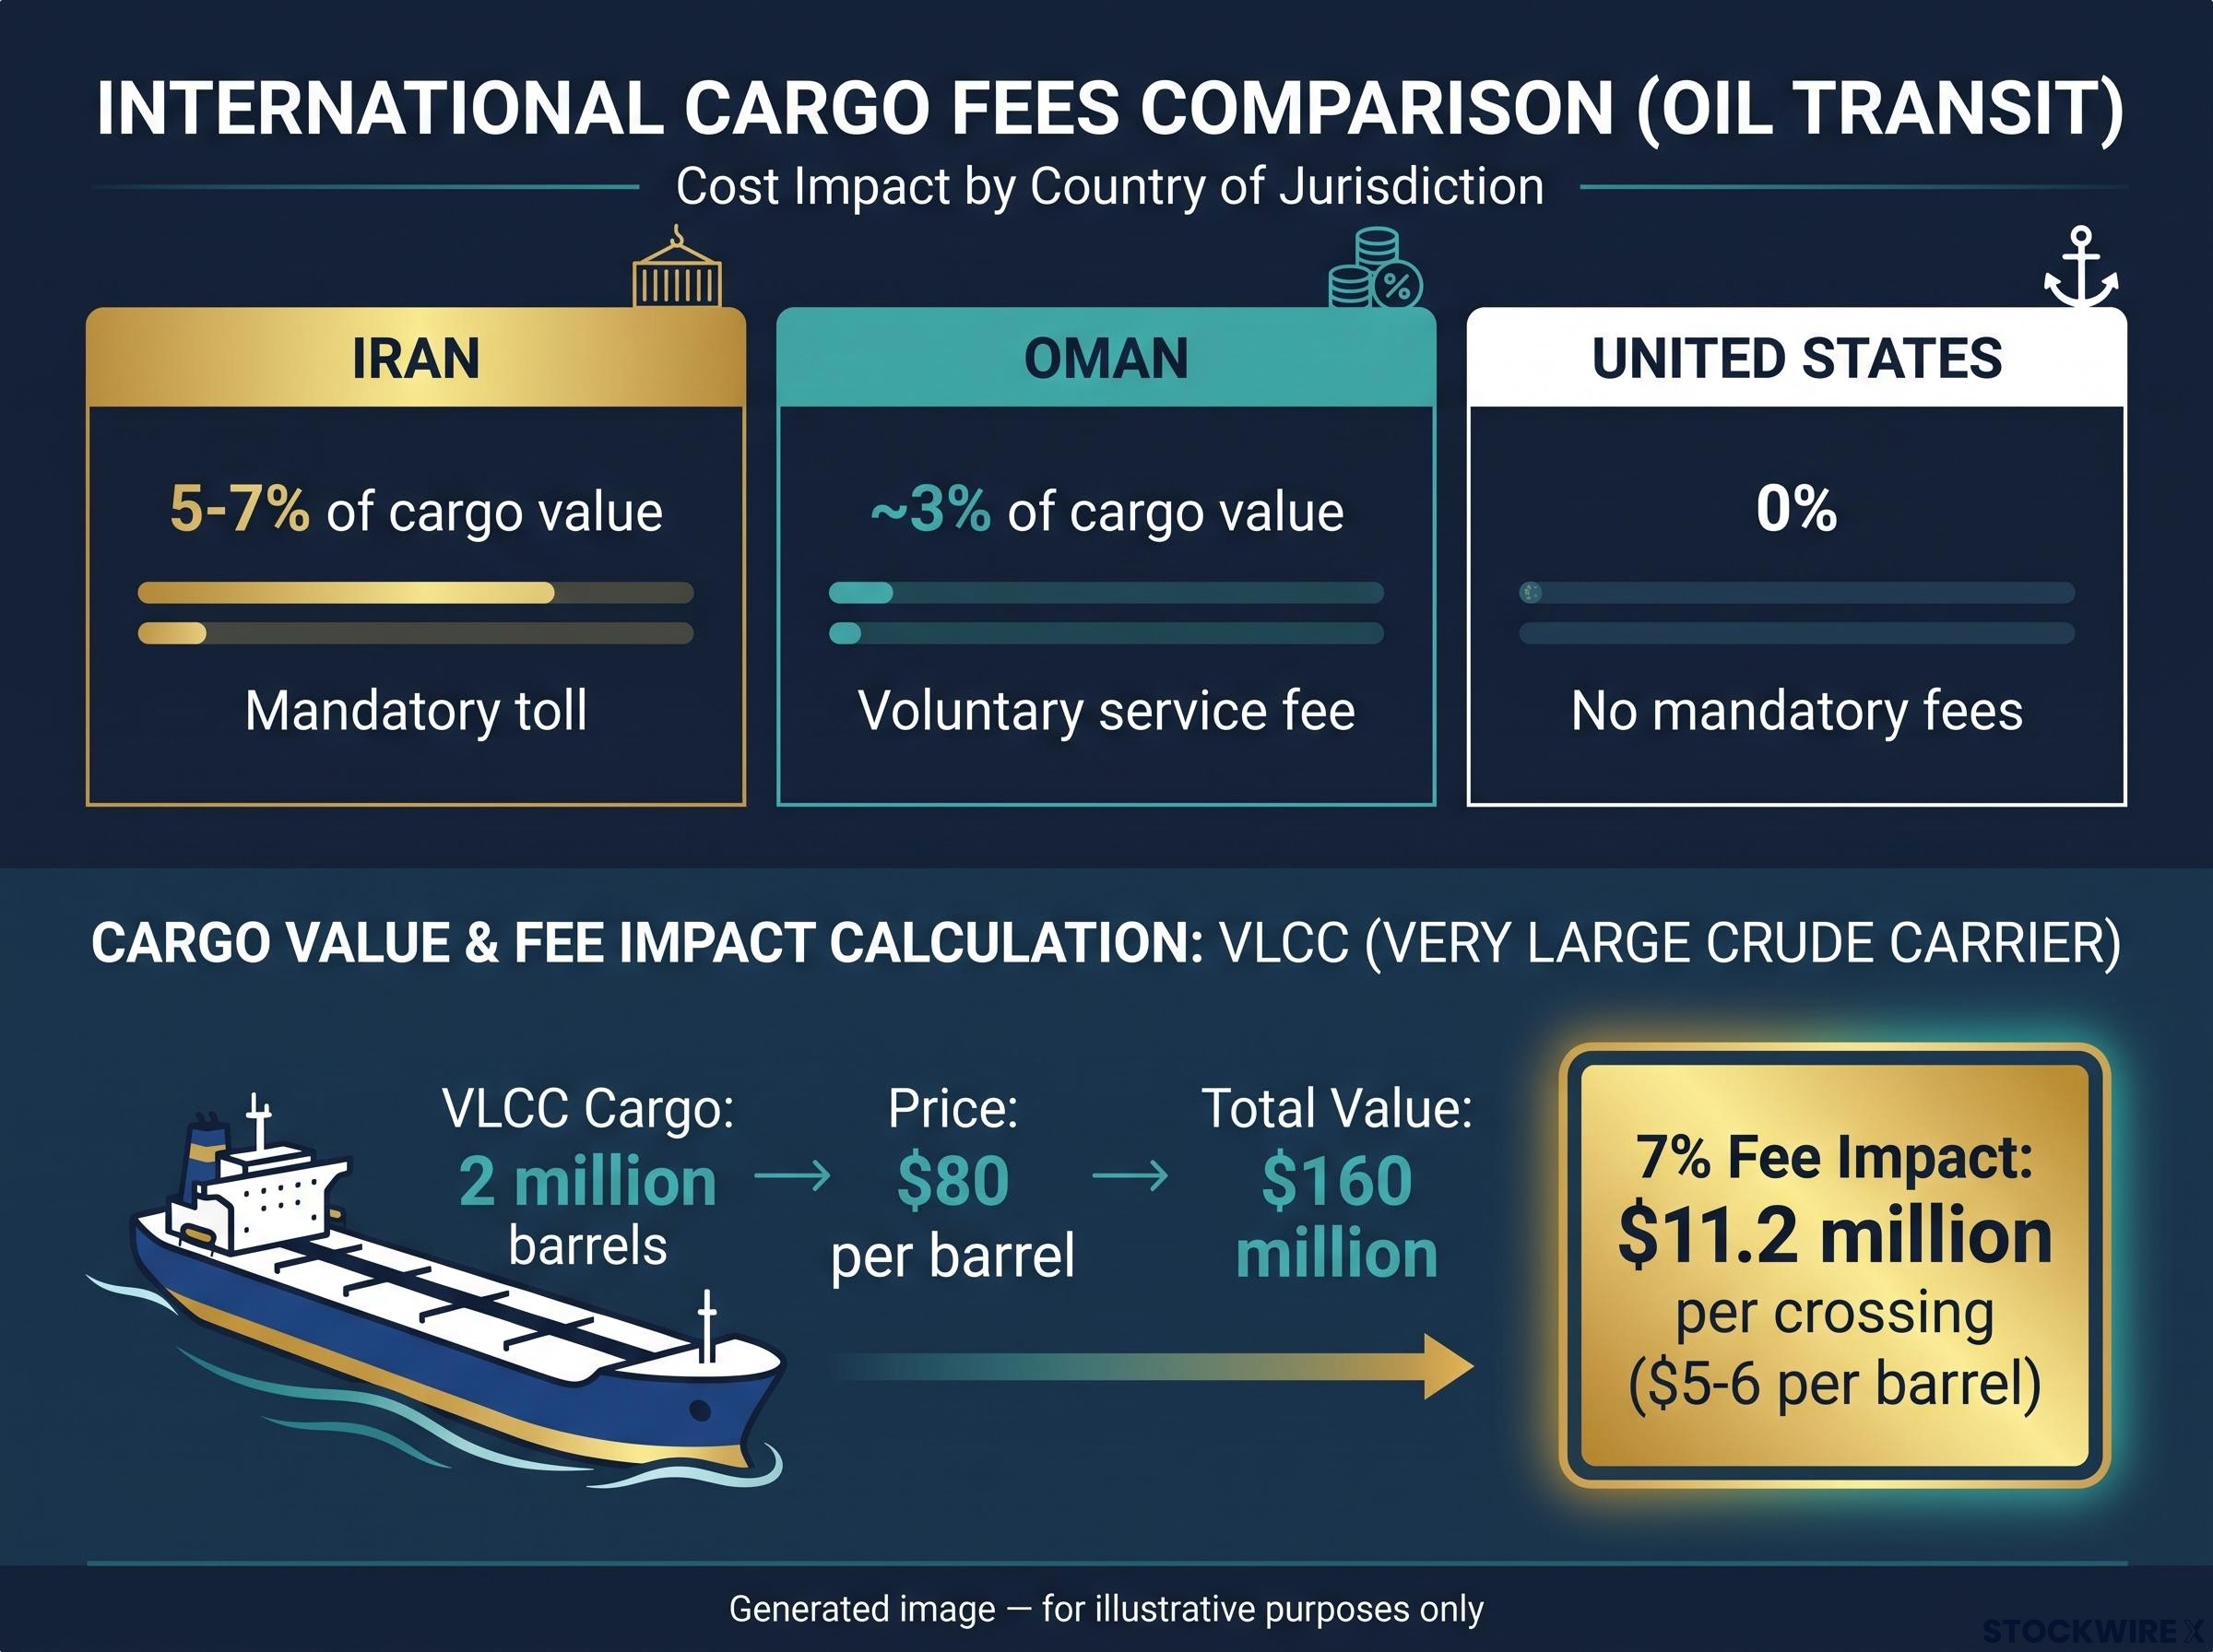
That per-barrel figure is one any energy-aware reader can immediately map onto benchmark prices. The gap between 0% and 7% is not a bargaining detail; it is the difference between no structural market impact and a permanently higher energy cost baseline for every import-dependent economy in Asia and Europe.
Why Hormuz sits at the centre of global energy geography
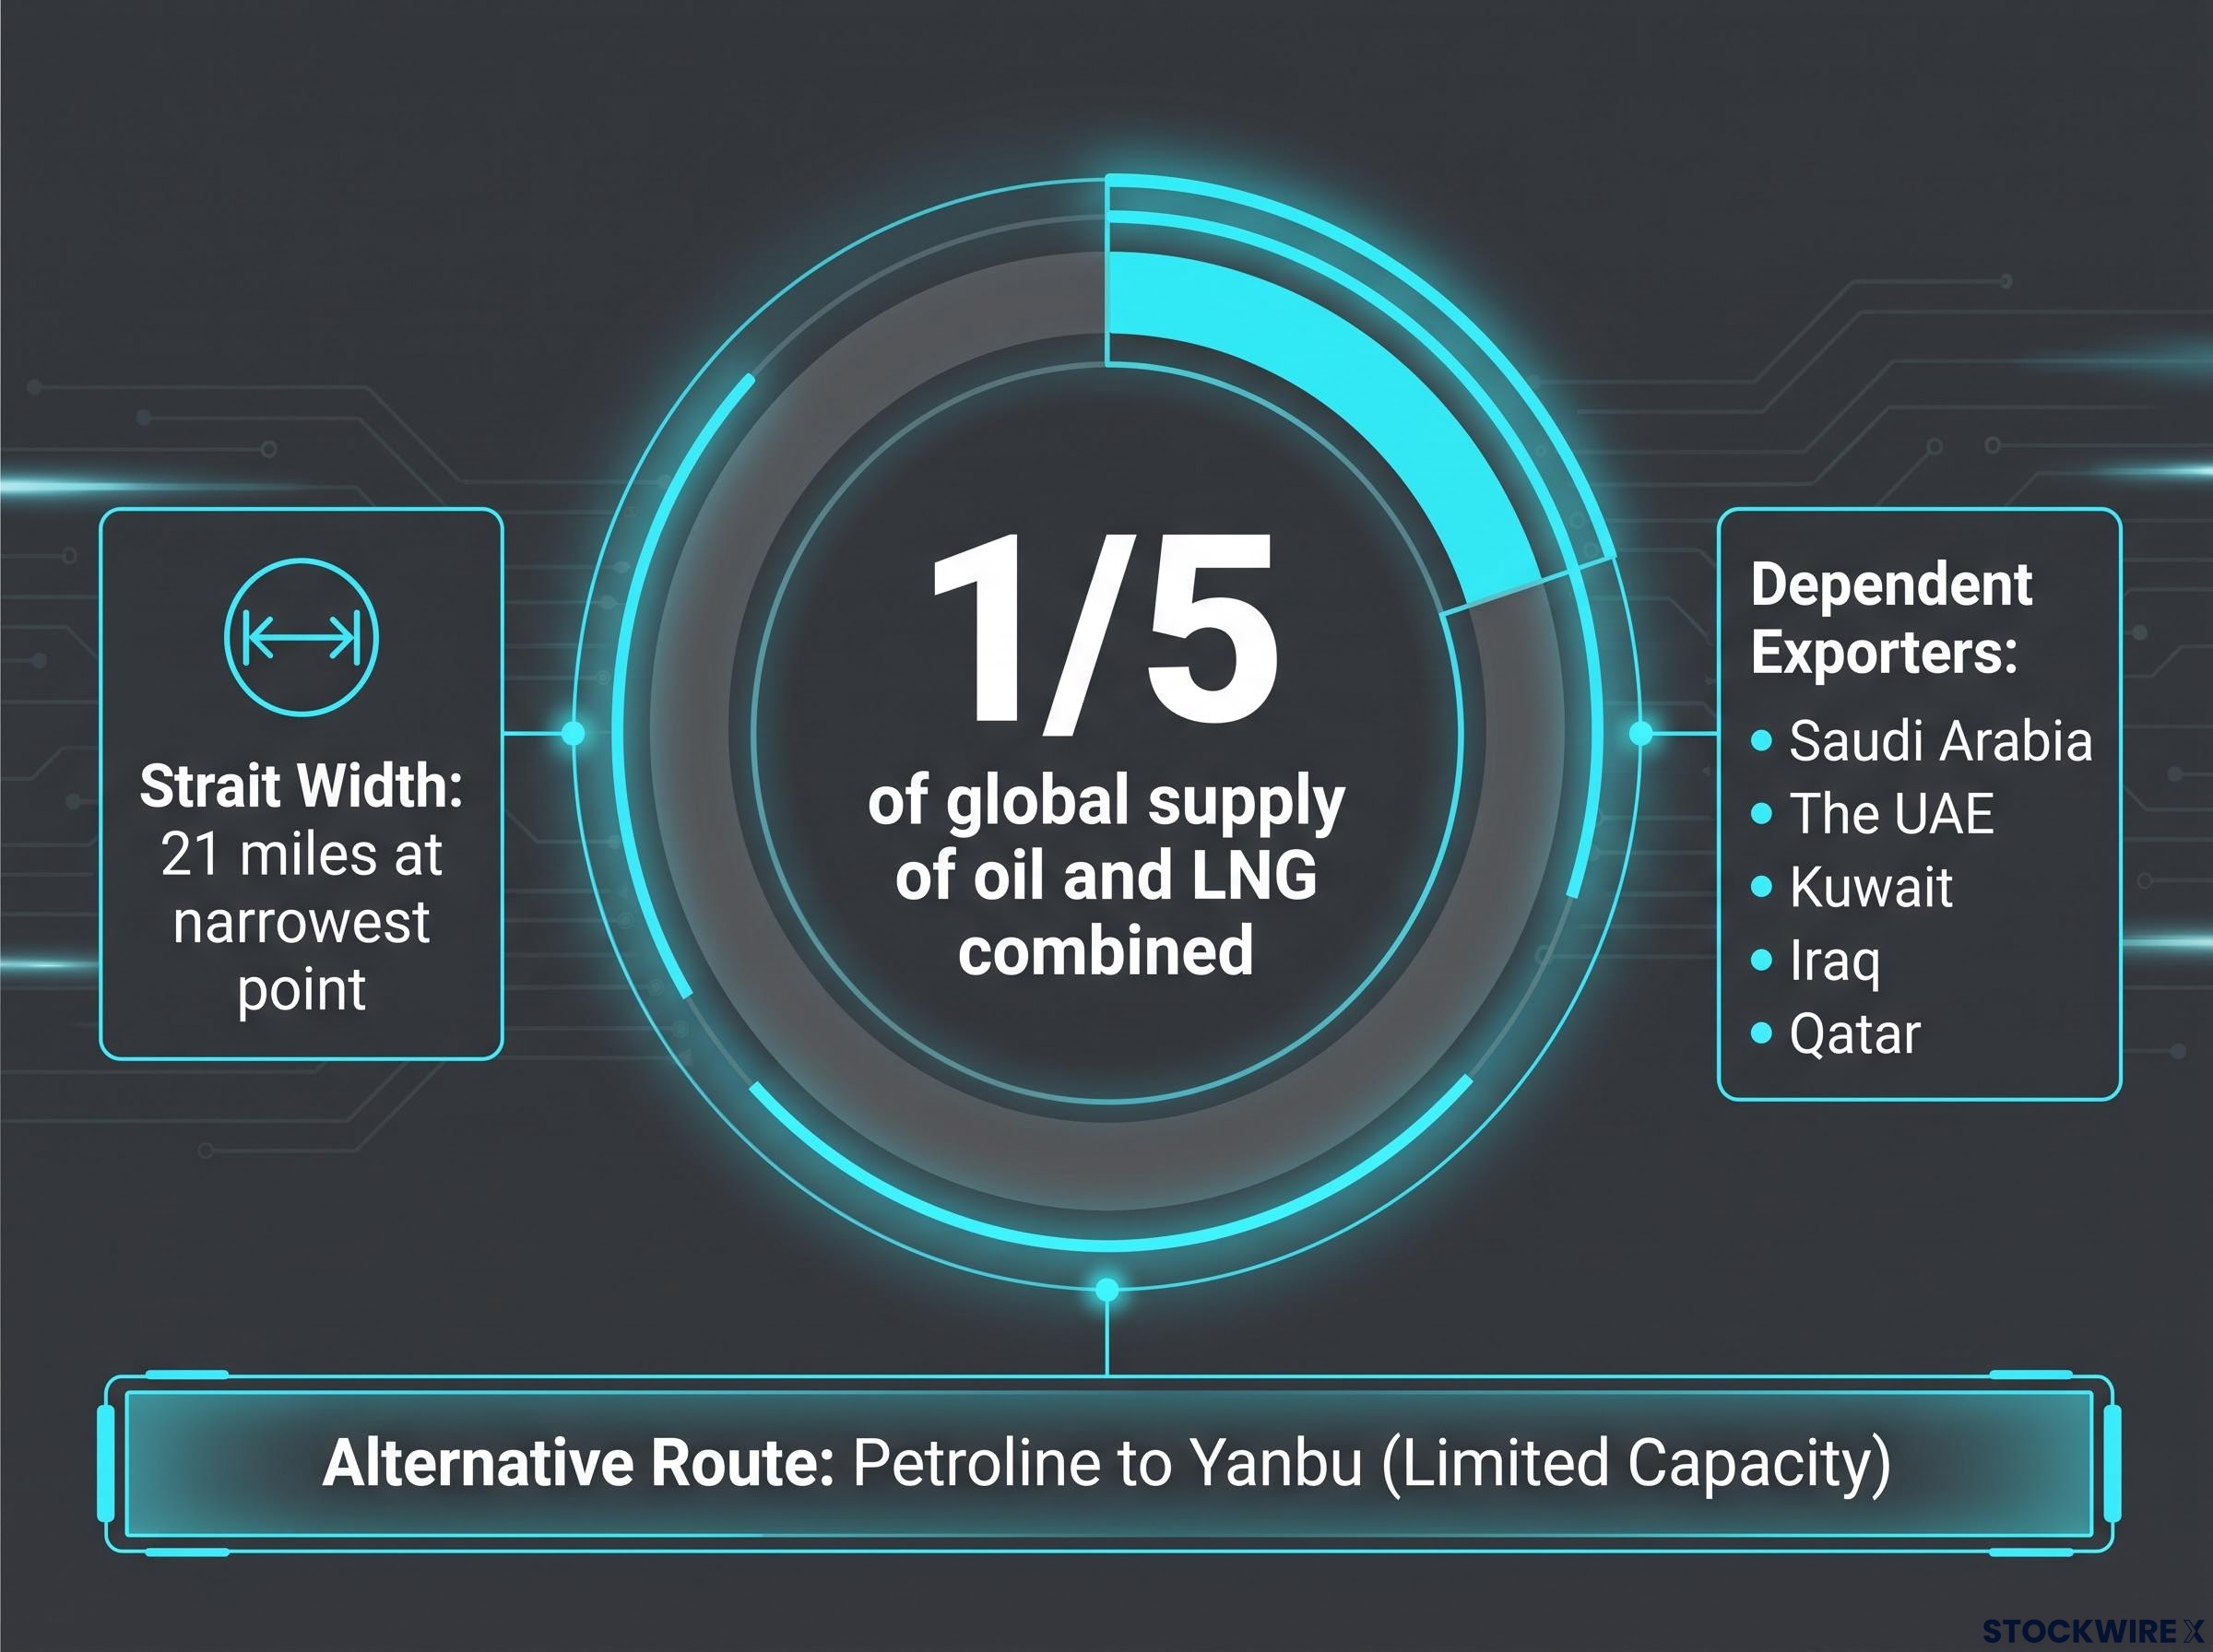
The Strait of Hormuz is approximately 21 miles wide at its narrowest point. Prior to the conflict that erupted in late February, the waterway carried close to one-fifth of the entire global supply of oil and liquefied natural gas (LNG) combined. That single statistic explains why a fee negotiation in a narrow waterway between Iran and Oman carries consequences in London, Tokyo, and New Delhi.
The exporters most dependent on Hormuz as their primary exit route are:
- Saudi Arabia
- The UAE
- Kuwait
- Iraq
- Qatar
Iran’s leverage in these negotiations comes not from military force alone but from geography. Its territorial position along the strait’s northern shore is why the lane-routing demand, not the fee percentage, is the central issue.
What alternative routes exist, and why they are not a quick fix
Alternative pipelines do exist. The Petroline (also called the East-West Pipeline) runs across Saudi Arabia to Yanbu on the Red Sea, offering an outlet that bypasses Hormuz entirely. But its capacity handles only a fraction of total Gulf output, and scaling it rapidly is not feasible.
Bypass pipeline capacity across the Saudi East-West line and the UAE Habshan-Fujairah route is running at or near maximum, meaning the existing infrastructure floor that has partially absorbed diverted volumes offers no meaningful additional headroom if Hormuz transit fees push operators toward alternative routing.
For Qatar’s LNG, the picture is starker. There is no practical alternative export route of comparable capacity. The absence of a scalable detour is what converts a fee negotiation into a systemic market risk; unlike most supply disruptions, major importers cannot simply reroute around this one.
From tanker fees to your portfolio: how this flows through markets
The transmission chain from a Hormuz fee to portfolio impact runs through more links than crude oil alone. If mandatory fees are imposed on most oil and LNG flows, energy input costs rise for import-dependent economies. Those costs feed into transportation, petrochemicals, plastics, fertilisers, and food prices, broadening the inflation footprint well beyond the energy sector.
- Fee imposed on Hormuz transit
- Shipping and transit costs rise for Gulf crude and LNG
- Refiners and utilities pass costs through to refined product prices
- CPI inputs rise across transport, chemicals, and food
- Central banks respond by maintaining tighter policy or hiking further
- Long-duration bonds reprice as rate expectations shift upward
Oil prices were approximately 0.3% lower on 6 August 2026, after volatile trading in the prior session. That modest move is not a reassuring signal of calm. It reflects markets pricing partial resolution risk while the negotiation remains unresolved, meaning the repricing if a high-fee regime is confirmed would be sharper than that single-session move implies.
Why central banks are unlikely to look through an energy shock this time
Most major central banks were criticised for treating post-2021 energy price rises as transitory. Institutional memory of that episode makes policymakers more likely to respond pre-emptively to a sustained, supply-side energy shock rather than wait for second-round effects to appear in the data. For fixed income holders, that means rate risk concentrated at the long end of the curve.
The supply normalisation timeline stretches well beyond any single deal announcement, with Saudi Aramco CEO Amin Nasser warning that full recovery could extend into 2027 and Goldman Sachs and Bank of America both pushing their first Fed rate cut projections to late 2026 and mid-2027 respectively.
Which assets are most exposed, and which could benefit
The most directly exposed category is emerging-market net energy importers. Economies such as India, Pakistan, and parts of Southeast Asia face higher import bills, current account pressure, currency weakness, and the risk of locally driven rate hikes that weigh on both local bonds and equities.
Higher import costs for net energy importers do not stop at the fuel bill. They pressure currencies, force local central banks into defensive rate hikes, and compress returns across local fixed income and equity markets simultaneously.
Energy equities require geographic nuance. Integrated majors with heavy Gulf exposure face operational risk: delays, higher insurance costs, and potential political interference. Producers outside the Hormuz system, in North America, the North Sea, West Africa, and parts of Latin America, could benefit from higher benchmark prices without sharing the same transit risk. The most actionable portfolio distinction is whether energy exposure is concentrated in the wrong geography, not whether to hold energy at all.
| Asset class | Exposure direction | Key reason | Monitoring signal |
|---|---|---|---|
| Long-duration bonds | More exposed | Inflation and rate expectations shift upward | Breakeven inflation rates widening |
| EM net-importer equities and bonds | More exposed | Higher import bills, currency pressure, local rate hikes | Current account deterioration, FX weakness |
| Gulf-exposed energy majors | Mixed | Higher prices offset by operational and insurance risk | War-risk premium changes, insurance cost disclosures |
| Non-Hormuz producers | Potential beneficiary | Higher benchmarks without transit risk | Production guidance, price realisation spreads |
| TIPS and index-linked gilts | Potential beneficiary | Realised inflation rising above current breakevens | Breakeven vs. realised CPI divergence |
| CAD and NOK | Potential beneficiary | Commodity-linked currencies strengthened by supply-side oil uplift | Sustained oil price moves above pre-negotiation baseline |
This article is for informational purposes only and should not be considered financial advice. Investors should conduct their own research and consult with financial professionals before making investment decisions.
What to watch before this risk becomes a base case
Four observable signals will tell you when this tail risk is migrating toward probability:
- Deal text and lane definition: Whether both inbound and outbound lanes are routed significantly inside Iranian territorial waters and how “control” is legally defined, administrative oversight versus genuine gatekeeping authority
- Fee structure and classification: Whether charges are mandatory tolls on transit or voluntary service fees tied to specific services, and whether the final figure lands closer to Iran’s 5-7% or Oman’s approximately 3%
- Shipping and insurance market signals: Changes in war-risk premiums for Gulf transit and any reluctance by major tanker operators to accept Iranian permit requirements; a shift to more expensive special insurance would raise effective transit costs before any formal fee is charged
- U.S. and Gulf state political alignment: The degree of alignment among Saudi Arabia, the UAE, and other Gulf producers behind Oman’s voluntary-fee model influences whether an Iran-centric regime is politically sustainable
These signals need to be read against the 60-day MoU toll-free window, which provides the clearest timeline investors have. Watching for “a deal” as the resolution signal is watching the wrong indicator; the deal’s internal architecture on lane control and fee classification is what determines whether the Hormuz risk premium rises or falls after any announcement.
The Hormuz deal verification signals that matter, a formal signed agreement, an independent verification regime, and mine-clearance completion estimated at 40-50 days, are all still unmet as of early August 2026, a distinction that separates genuine normalisation from a headline-driven sentiment bounce.
Reading the final deal when it comes: architecture over headlines
The analytical distinction this negotiation demands is specific. A voluntary service-fee coordination model, closer to Oman’s proposal, is a manageable cost increase that markets can absorb. A mandatory control regime, closer to Iran’s ambition, is a structural geopolitical risk premium embedded permanently in energy prices. Those are two fundamentally different outcomes wearing the same headline.
As of 6 August 2026, this remains a material but still-uncertain tail risk. The portfolio response is not to reposition dramatically but to audit concentration risk in Gulf-exposed assets, review whether existing inflation-protection allocations are commensurate with this scenario, and maintain enough liquidity to act if a high-fee regime is confirmed.
For readers wanting to map the full range of institutional projections against fee and closure scenarios, our full explainer on Hormuz oil price scenarios walks through EIA, Goldman Sachs, and JPMorgan forecasts from $79 to $142 per barrel across reopening and prolonged closure outcomes.
The clock on the toll-free period is the clearest timeline signal available. When a deal text emerges from these negotiations, read it for lane architecture and fee classification before reading it for headline sentiment. That is where the market-moving information will sit.
Past performance does not guarantee future results. Financial projections are subject to market conditions and various risk factors.