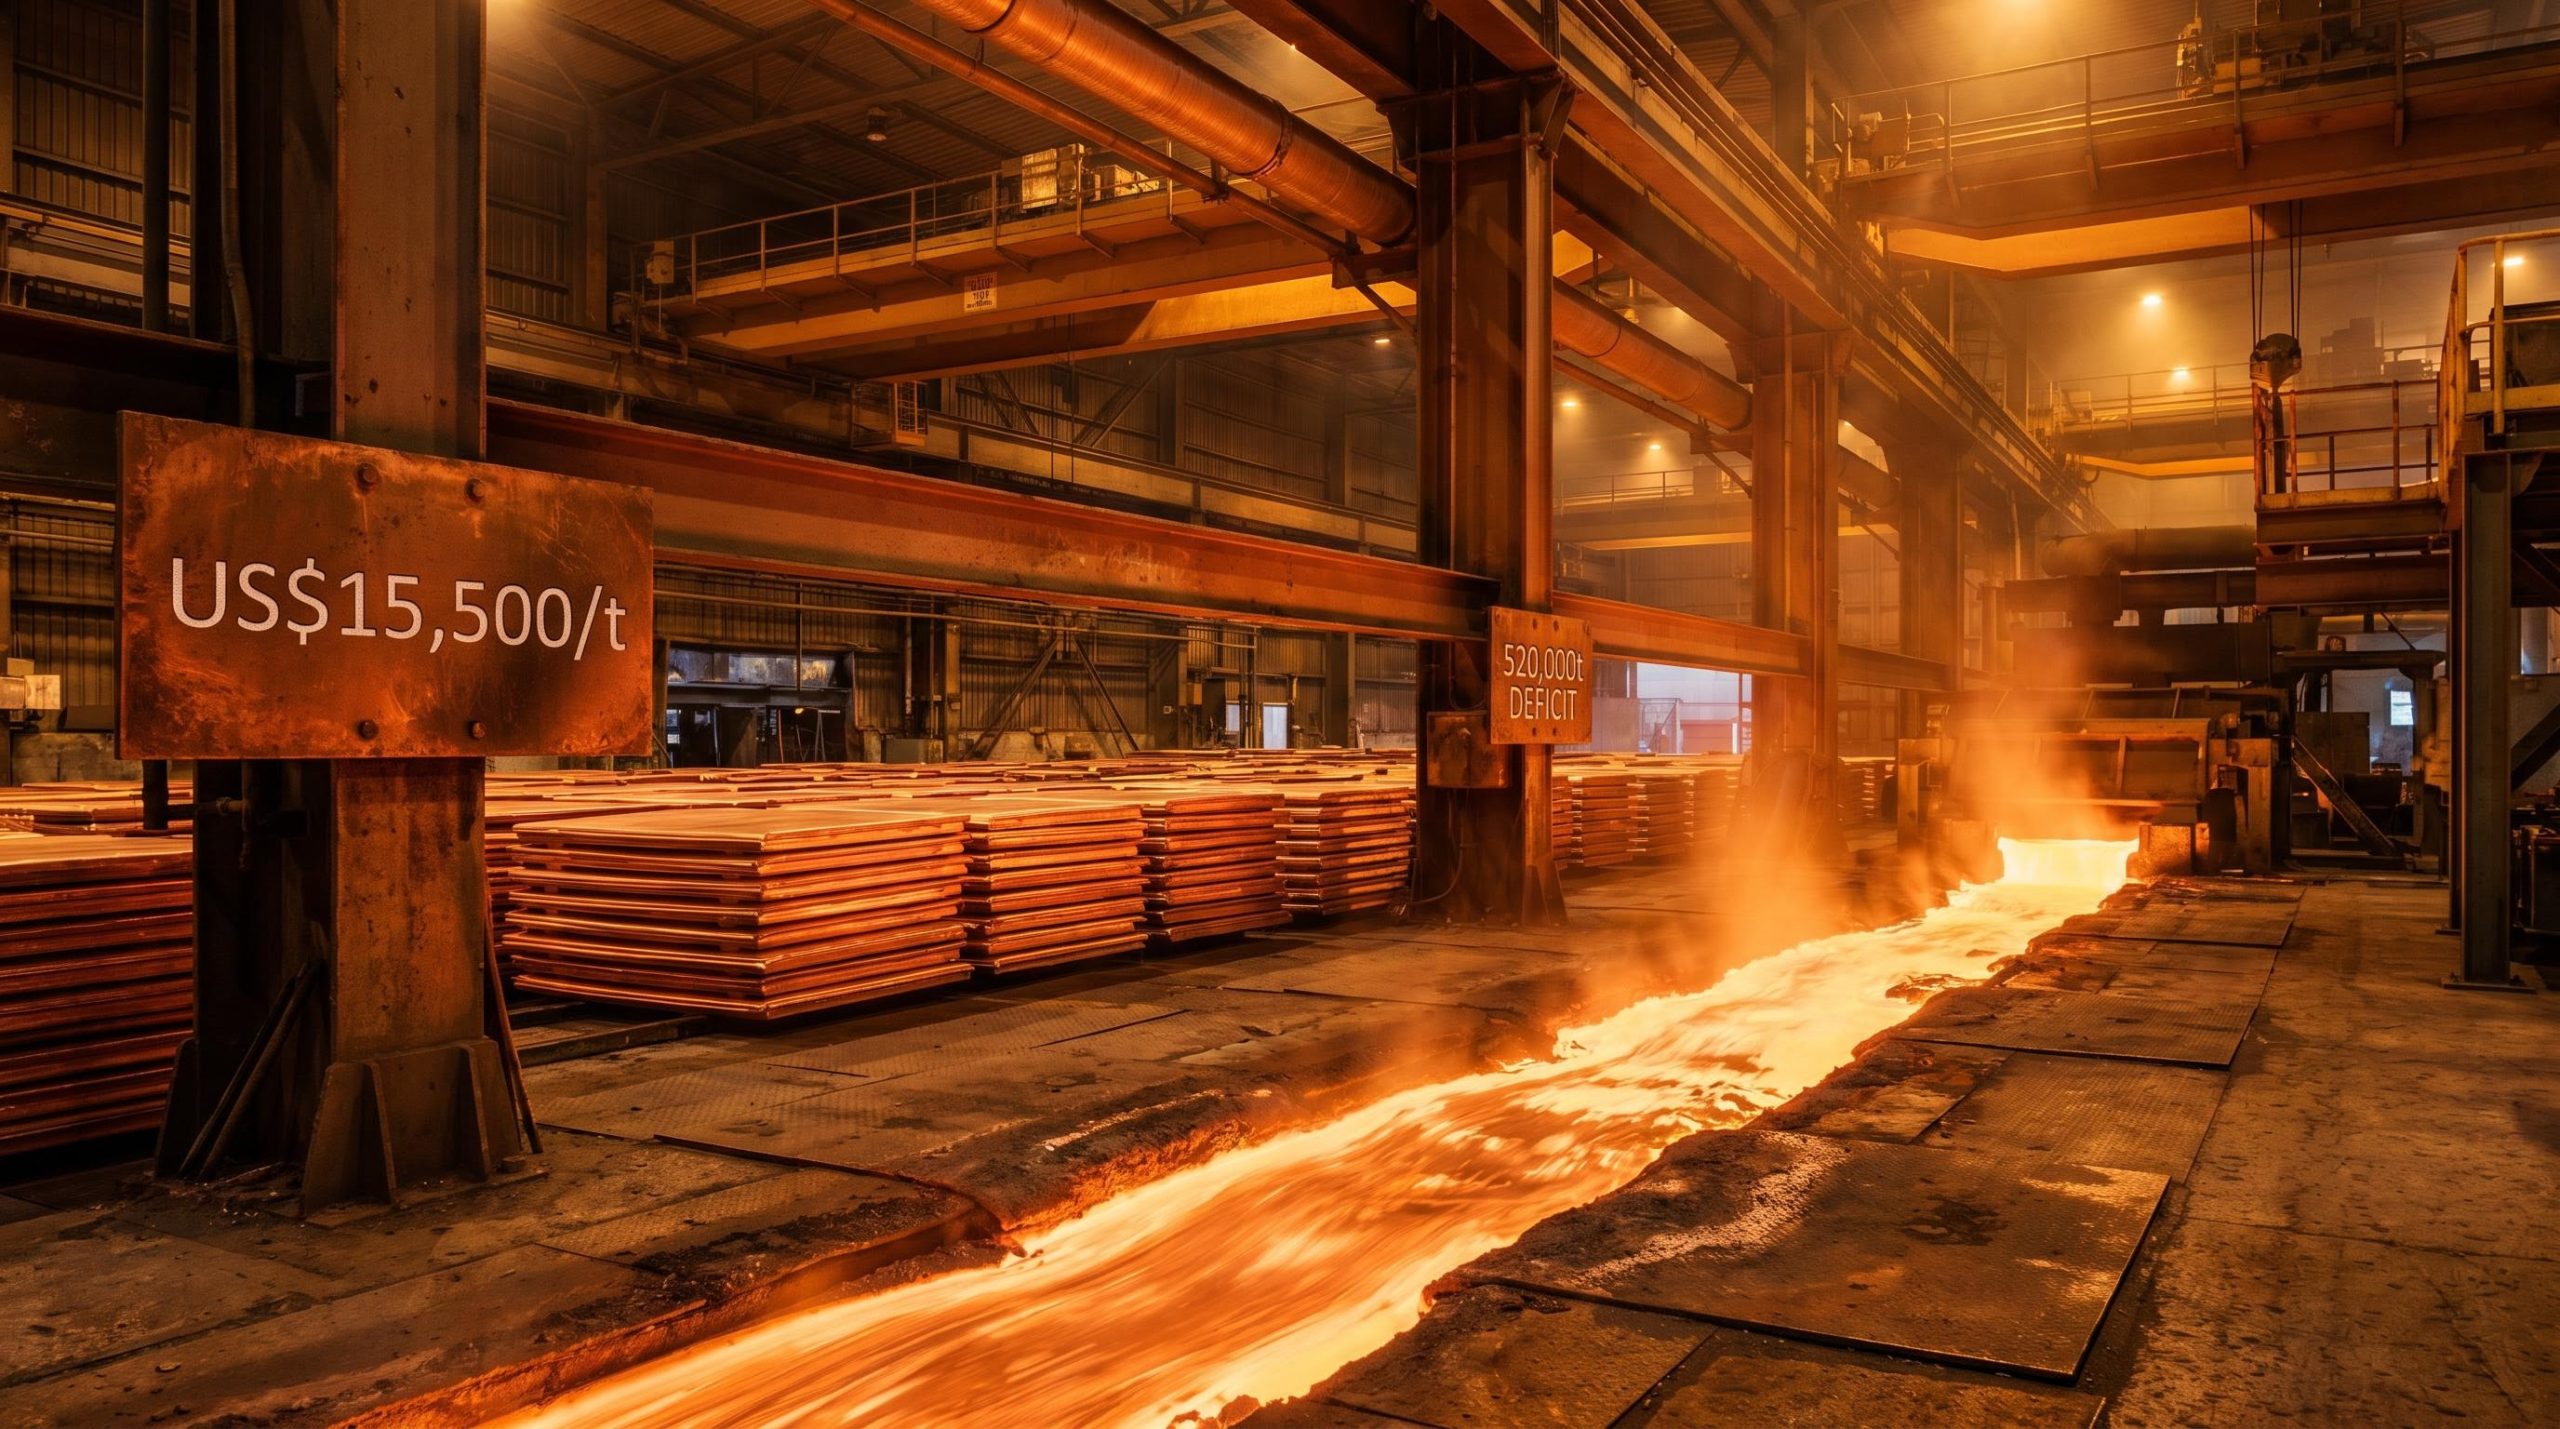
LME copper briefly traded above US$14,000 per metric tonne in May 2026, and UBS believes that crossing that threshold was not a ceiling but a staging post. The bank has upgraded its copper price forecasts to US$14,000/t by September 2026 and US$15,500/t by June 2027, citing a 2026 refined market deficit of approximately 520,000 metric tonnes, more than double the 2025 shortfall. The upgrade arrives as benchmark treatment and refining charges have collapsed to zero, Freeport-McMoRan’s Grasberg restart has been pushed to early 2028, and China has halted sulphuric acid exports from May 2026. This analysis unpacks the specific supply failures and demand accelerators behind UBS’s numbers, contextualises them against the broader analyst consensus, and translates the bank’s preferred entry ranges and volatility strategies into a framework investors can use to evaluate copper exposure.
UBS raises its copper target to US$15,500 by mid-2027 as the deficit doubles
As of 22 May 2026, LME copper settled at US$13,545/t, having briefly pushed above US$14,000/t earlier in the month. UBS’s revised price path now sits materially above that level:
- Spot (22 May 2026): US$13,545/t
- September 2026 target: US$14,000/t
- June 2027 target: US$15,500/t
The gap between the current spot price and the June 2027 target implies roughly 15% potential upside from the 22 May close, a meaningful return horizon for investors evaluating entry points now.
The engine behind the upgrade is not a single mine disruption or a speculative positioning shift. It is the arithmetic of the balance itself. UBS projects a 2026 refined copper deficit of approximately 520,000 metric tonnes, more than double the 203,000 metric tonne shortfall estimated for 2025.
Deficit scale: UBS estimates the 2026 refined copper deficit at approximately 520,000 metric tonnes, compared with 203,000 metric tonnes in 2025, a revision that reflects a structural reassessment rather than a marginal adjustment.
The underlying maths is straightforward. UBS forecasts 2026 demand growth of 2.8% against refined supply growth of just 1.7%. That 1.1 percentage point gap, applied to a market consuming roughly 25-26 million tonnes annually, produces a deficit large enough to tighten physical availability across the supply chain.
When big ASX news breaks, our subscribers know first
Three supply failures converging at the same moment
The deficit is not one shock. It is three independent pressures compressing availability simultaneously, each operating on a different timeline and mechanism. That convergence is what makes a rapid reversal structurally unlikely.
China’s sulphuric acid export halt, effective from May 2026, removes a byproduct that copper miners depend on for leaching operations. According to J.P. Morgan Global Research (April 2026), approximately 15% of global copper production relies on sulphuric acid availability. China’s decision to retain domestic supply for fertiliser and industrial use cuts off a volume that previously supported overseas copper and nickel output.
Freeport-McMoRan’s Grasberg mine in Indonesia, one of the world’s largest copper-gold operations, declared force majeure following a mudslide. The restart has now been pushed to early 2028, removing a major source of expected concentrate supply from the near-term balance.
Quebrada Blanca in Chile, operated by Teck Resources, has issued reduced production guidance, compounding the concentrate shortage at a moment when smelters are already competing aggressively for feed.

| Disruption | Location / Source | Mechanism | Timeline for Resolution |
|---|---|---|---|
| Sulphuric acid export halt | China (policy) | Removes acid supply for leaching; ~15% of global copper output reliant | No reversal date announced |
| Grasberg force majeure | Indonesia (Freeport-McMoRan) | Mudslide shut major concentrate source | Restart pushed to early 2028 |
| Quebrada Blanca guidance cut | Chile (Teck Resources) | Reduced production lowers concentrate availability | Uncertain; operational improvement required |
What collapsed treatment charges signal about concentrate scarcity
Treatment and refining charges (TC/RCs) are fees smelters earn for processing raw concentrate into refined copper. When these charges are healthy, smelters have bargaining power because concentrate is readily available. When they collapse, smelters are effectively competing for scarce feed.
The 2026 benchmark TC/RC has fallen to US$0/t, down from approximately US$25/t in 2025. Spot rates have dropped below negative US$100/t, meaning some smelters are paying miners for the right to process their concentrate. This is not a forecast of tightness. It is a real-time market signal confirming that concentrate scarcity is already here.
Exchange inventory distortions complicate the physical tightness narrative: global exchange-held copper stocks exceeded 1 million tonnes in May 2026, a 20-year high, with US inventories at roughly five times prior-year levels due to tariff-driven front-loading, a dynamic that temporarily inflates visible supply without reflecting the underlying concentrate scarcity that TC/RC data confirms.
Why copper needs more electricity, more EVs, and more data centres than ever before
The deficit is a demand-pull story as much as a supply-push one. Three separate structural trends are pulling on the same constrained material, and none of them is cyclical.
- Electric vehicles: Battery electric vehicles use roughly 2-4 times as much copper as internal combustion engine vehicles, primarily in wiring, motors, and battery connectors. As global EV penetration grows, annual copper demand compounds.
- Electricity grids and renewables: Grid expansion and renewable energy build-out represent a multi-year capital deployment cycle that is anchored in government policy commitments and cannot be easily paused. Wood Mackenzie frames this as a source of multi-million-tonne cumulative demand additions over the decade.
- AI data centres: The construction of large-scale data centres requires substantial copper for power distribution infrastructure, cooling systems, and cabling. This theme is increasingly integrated into analyst structural demand narratives, cited across Fastmarkets, Wood Mackenzie, and UBS as an accelerant layered on top of the electrification trend.
Copper intensity: A battery electric vehicle uses roughly 2-4 times the copper content of an internal combustion engine car, making each percentage point of EV penetration growth a compounding demand multiplier.
UBS forecasts 2.8% demand growth for 2026. Unlike supply disruptions that can theoretically be resolved through restarts or policy reversals, demand growth from electrification and digital infrastructure is structurally embedded in policy commitments and corporate capital plans. That provides a durable floor beneath the demand side of the deficit.
The broader copper market outlook extends well beyond the 2026-2027 window, with S&P Global projecting global demand to rise from 28 million metric tonnes in 2025 to 42 million metric tonnes by 2040 as renewables, EVs, grid electrification, and AI data centres compound demand simultaneously; BHP has anchored to that trajectory with a commitment to roughly 5% annual production growth targeting 2 million attributable tonnes per annum by 2035.
Understanding copper’s supply-demand balance: how deficits move prices
For readers less familiar with how commodity deficits translate into price movements, the mechanism is more sequential than it might appear. The copper supply chain has multiple stages, each with its own potential bottleneck:
- Mining: Ore is extracted and processed into copper concentrate at the mine site.
- Concentration: The raw material is refined into a concentrate containing 20-30% copper content.
- Smelting: Concentrate is sent to smelters, which process it into refined copper metal (the stage where TC/RCs apply).
- Trading: Refined copper is traded on exchanges such as the LME, establishing the benchmark price.
- Consumption: Industry purchases refined copper for manufacturing, construction, and infrastructure.

A deficit of 300,000-600,000 tonnes may sound modest against total annual refined consumption of approximately 25-26 million tonnes globally. In proportional terms, it represents roughly 1-2% of the market. But commodity markets price at the margin, and a persistent gap of that magnitude tightens physical availability enough to push prices higher until demand is rationed or new supply arrives.
The consensus deficit range across Goldman Sachs, J.P. Morgan, Citi, S&P Global, and Wood Mackenzie clusters in that 300,000-600,000 tonne band for 2026-2027, with J.P. Morgan estimating approximately 330,000 tonnes for 2026 alone.
Why new mines cannot quickly close a deficit of this size
New copper projects typically require 5-10 years from discovery to production. Permitting delays, rising capital costs, and policy risk, factors identified by both Wood Mackenzie and Goldman Sachs, further constrain the supply response. Prices must remain elevated long enough to justify the capital required for development, a concept known as the incentive price. Even if copper reaches US$15,500/t, the market balance does not immediately correct because the mines needed to close the gap do not yet exist in production.
How UBS’s view compares with Goldman Sachs, J.P. Morgan, and Citi
UBS’s forecast sits at the upper end of a range that, directionally, tells a consistent story. The variation across institutions reflects differing macro scenario assumptions rather than disagreement on the structural supply-demand picture.
| Institution | 2026 Deficit Estimate | 2026 Price Forecast | 2027 Price Forecast |
|---|---|---|---|
| UBS | ~520,000 t | US$14,000/t (Sep 2026) | US$15,500/t (Jun 2027) |
| J.P. Morgan | ~330,000 t | US$13,500/t (Q2 2026) | Not publicly specified |
| Goldman Sachs | Structural deficit (unquantified) | ~US$12,000/t* | US$15,000/t* |
| Citi | ~400,000 t† | ~US$11,500/t (raised)† | Upside risk cited† |
*Goldman Sachs figures based on Financial Times and Reuters reporting from March 2025. †Citi figures based on Reuters reporting from April 2025; precise numbers remain unverified in publicly accessible sources.
Goldman Sachs characterised the deficit outlook as “unsustainable” in a note reported by the Financial Times in March 2025, projecting copper could reach US$15,000/t by 2027. That framing aligns directionally with UBS’s revised targets. J.P. Morgan’s April 2026 outlook is more conservative on the deficit magnitude but identifies the same supply constraints, including Grasberg, Quebrada Blanca, and the sulphuric acid policy.
When multiple institutions independently converge on deep deficits using different methodologies, the structural case is strengthened even where individual price targets diverge.
What UBS’s entry range and volatility strategy mean for investors building copper exposure
UBS identifies US$12,800-13,000/t as its preferred entry range, approximately 4% below the 22 May spot level of US$13,545/t. The bank’s recommendation to sell volatility on the downside, generating income while waiting for entry, implies it does not expect copper to fall sharply below that range.
For investors evaluating exposure vehicles, the global market offers several approaches: physical copper exchange-traded funds (ETFs), copper mining equities (which carry company-specific operational risk alongside commodity exposure), and futures or options contracts for those with derivatives experience.
J.P. Morgan provides a useful risk parameter on the downside. Its bearish macro scenario places medium-term price support at US$11,100-11,200/t, a level that would represent a roughly 18% decline from current levels and could serve as a stress-test reference for position sizing.
Key risks that could delay or derail the UBS price path
- Macro demand contraction: A global industrial slowdown could reduce copper consumption below the 2.8% growth rate UBS assumes for 2026.
- Policy reversal on China’s sulphuric acid restrictions: If Beijing lifts the export halt, one of the three supply constraints eases materially.
- Faster mine restarts: An earlier-than-expected Grasberg restart (currently guided for early 2028) or equivalent capacity coming online elsewhere would loosen concentrate availability.
- US dollar strength: A stronger dollar compresses dollar-denominated commodity prices, potentially capping upside even if physical fundamentals remain tight.
The supply gap will not close quickly, and the clock is running
The 2026 deficit of 520,000 tonnes is the product of three simultaneous and independently slow-to-resolve supply failures, set against a demand backdrop anchored in policy commitments and corporate capital deployment. No single policy reversal, mine restart, or demand shock is sufficient to close a gap of this magnitude quickly.
New supply requires sustained elevated prices and 5-10 years of development from discovery to production. Even if copper reaches UBS’s US$15,500/t target by June 2027, the market balance does not immediately correct. The mines needed to close the deficit do not yet exist in production.
The copper deficit thesis sits within a broader materials sector re-rating argument: Bank of America’s Michael Hartnett identifies the materials sector at a near 30-year low of 2% S&P 500 weighting, framing that structural under-ownership, combined with four non-correlated demand drivers including $700-750 billion in hyperscaler AI infrastructure spending, as a setup for a multi-year re-rating that copper is the most quantifiable expression of.
The incentive price mechanism means that higher prices are necessary to justify new project investment, but the supply response takes years to materialise, creating a window where deficits persist and prices remain elevated.
For investors monitoring the thesis, three developments would materially challenge the UBS price path: a reversal of China’s sulphuric acid policy, an accelerated Grasberg restart ahead of the early 2028 timeline, or a global demand contraction severe enough to compress the 2.8% growth assumption. Until those variables shift, the structural case for sustained copper price elevation rests on a deficit that arithmetic alone cannot quickly resolve.
This article is for informational purposes only and should not be considered financial advice. Investors should conduct their own research and consult with financial professionals before making investment decisions. Past performance does not guarantee future results. Financial projections are subject to market conditions and various risk factors.