
Societe Generale raised its S&P 500 year-end target to 8,000 on 4 August 2026, publishing a research note that does more than revise a number. It challenges investors to reconsider how they hold U.S. equity exposure, not just whether to hold it.
The revision lands mid-earnings season, with roughly 60% of S&P 500 companies having reported and a beat rate that SocGen’s proprietary tracker describes as historically unprecedented. The 8,000 figure now sits alongside identically calibrated targets from Goldman Sachs, Morgan Stanley, and Deutsche Bank, making this a moment of unusual institutional convergence. With the S&P 500 trading near 7,600 today, the call implies meaningful but measured upside.
Here is what is actually driving the SocGen thesis, why the bank is tilting toward the equal-weighted version of the index rather than the standard benchmark, and what two specific macro conditions would cause the entire bullish case to unravel. If you are evaluating whether to add or rebalance index exposure, the framework applies directly.
Where four major institutions have landed on the S&P 500, and what SocGen’s upgrade adds
Manish Kabra, Chief U.S. Equity Strategist at Societe Generale, authored the note lifting the bank’s year-end target from 7,300 to 8,000. The revision is built on earnings growth and margin resilience rather than a bet on valuation multiples expanding further.
SocGen is not making a contrarian call. Goldman Sachs, Morgan Stanley, and Deutsche Bank have all independently arrived at 8,000. Yardeni Research sits slightly higher at 8,250. When four major institutions converge on the same number without coordination, the signal shifts: this is not one bank’s optimism but a mainstream institutional expectation, which changes how you should weigh the call against current index levels.
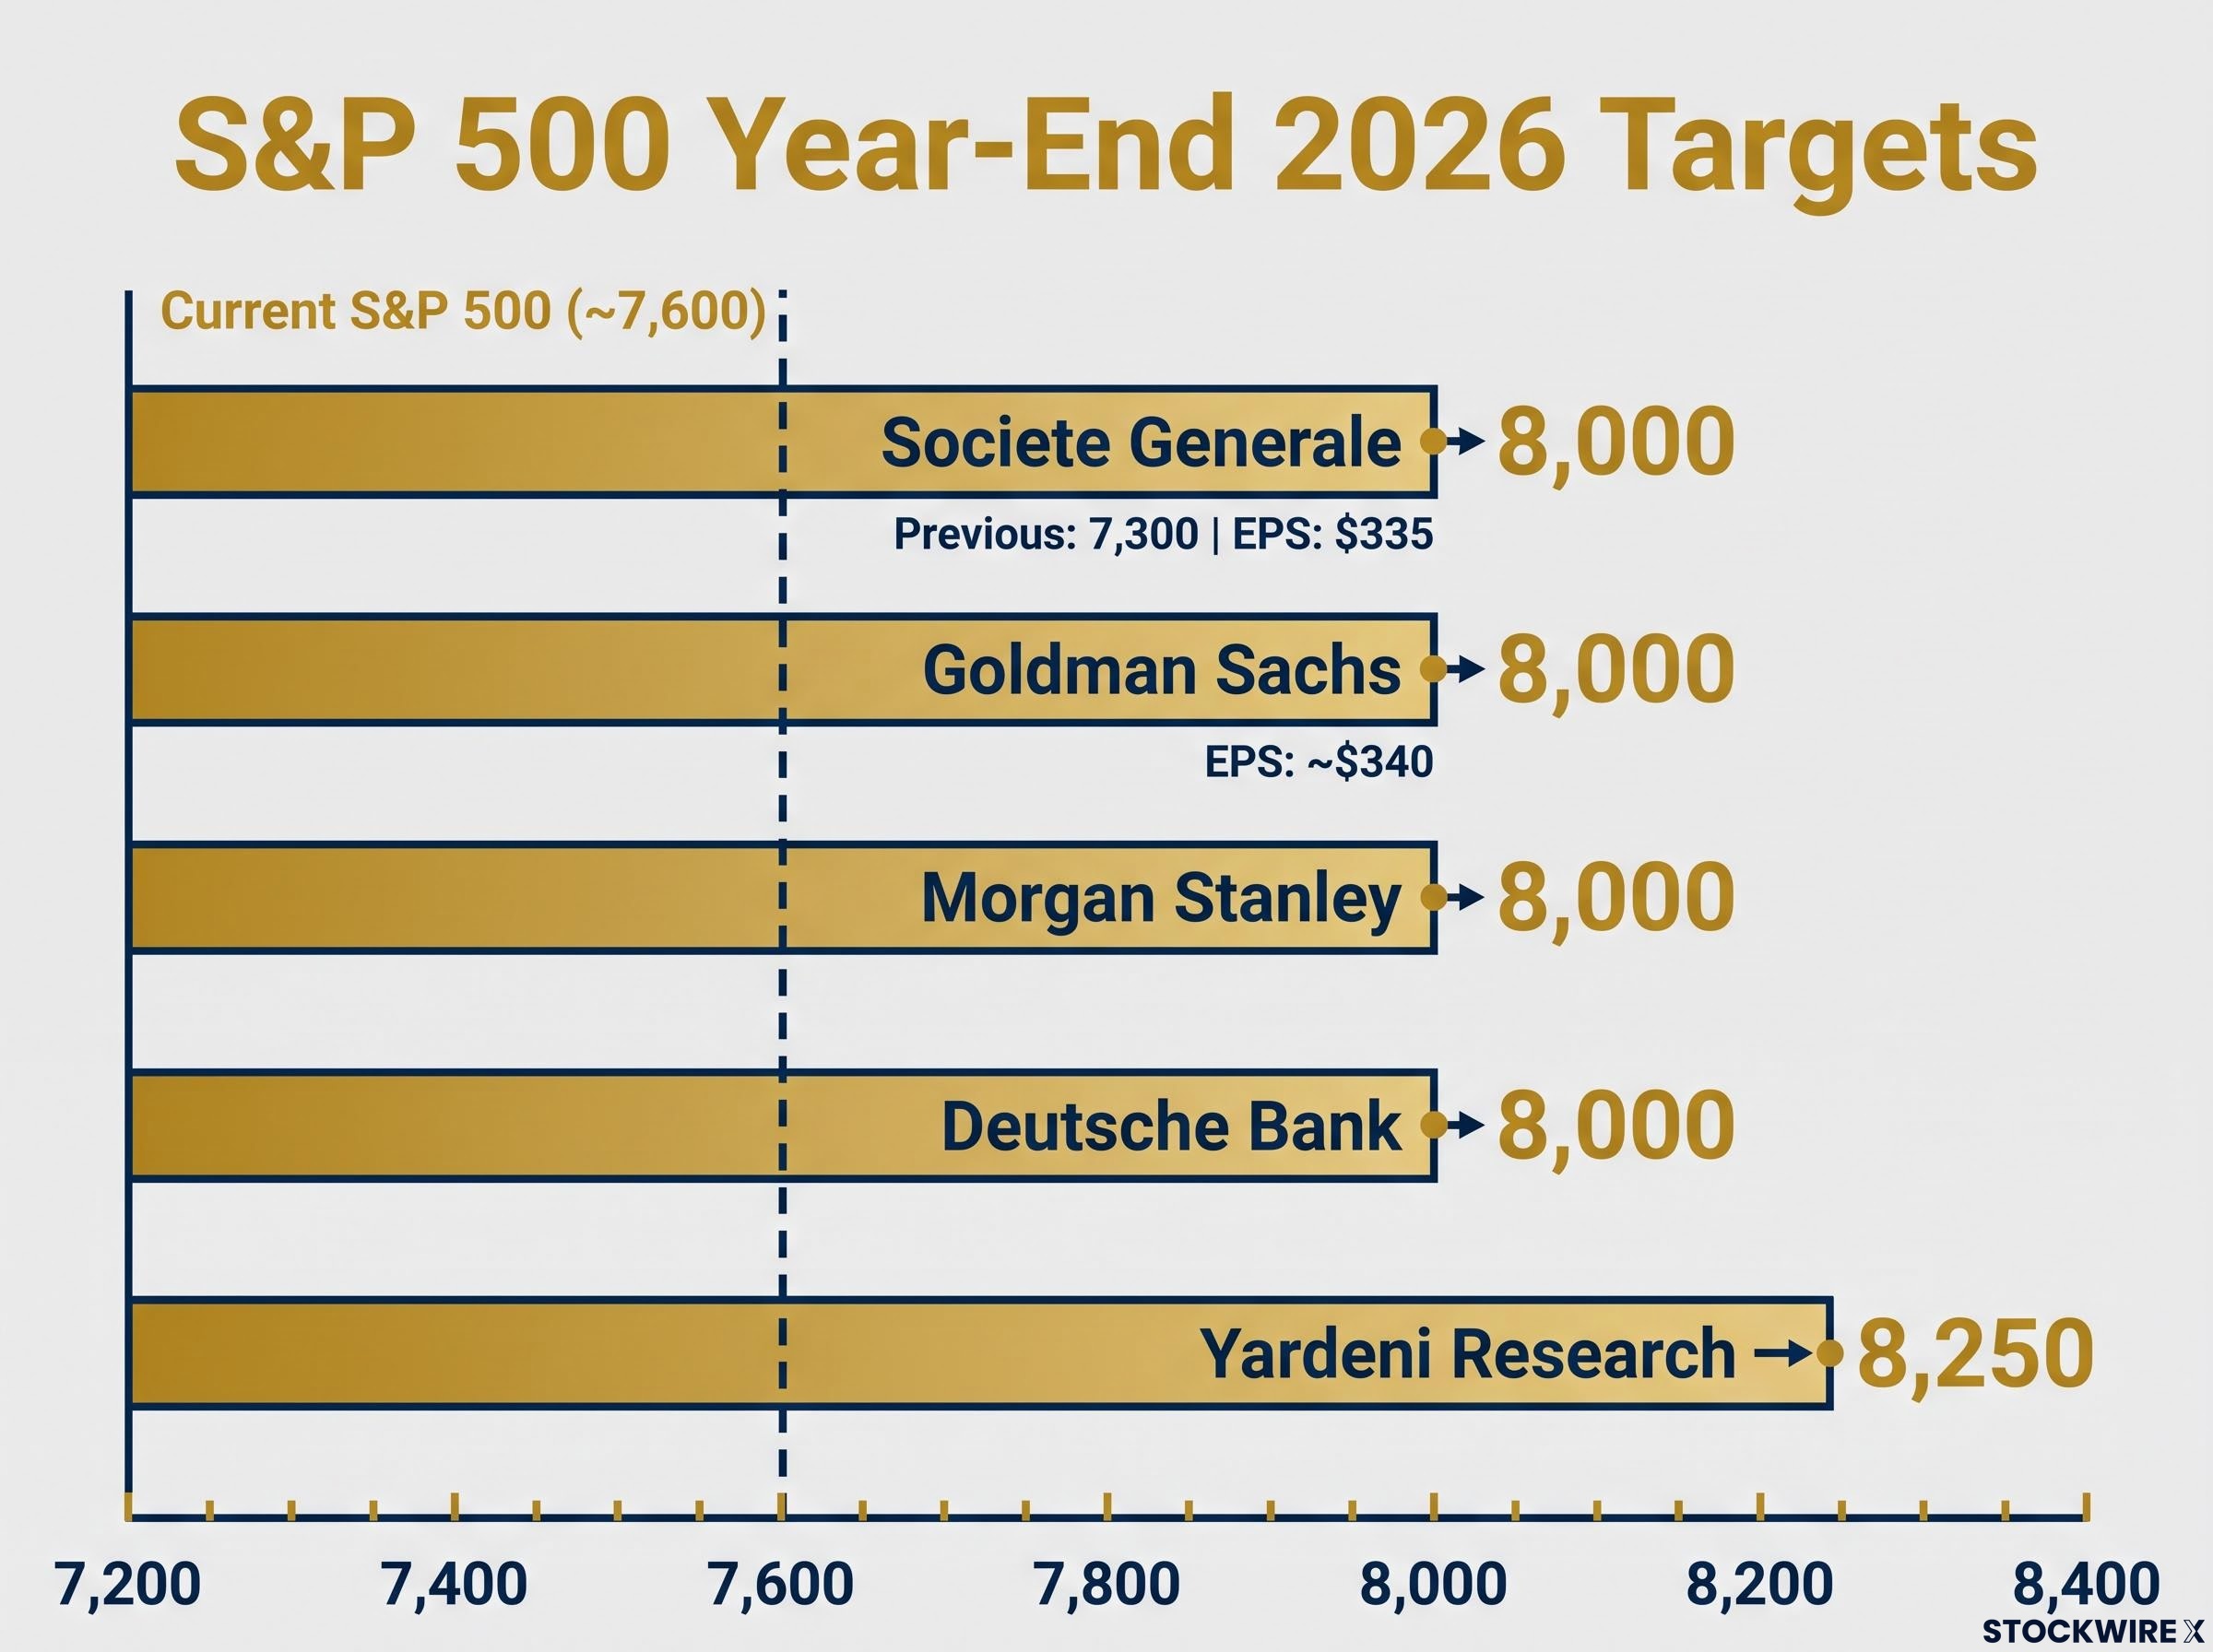
| Institution | S&P 500 year-end 2026 target | Associated EPS estimate |
|---|---|---|
| Societe Generale | 8,000 | $335 (full-year 2026) |
| Goldman Sachs | 8,000 | ~$340 (full-year 2026) |
| Morgan Stanley | 8,000 | Not publicly specified |
| Deutsche Bank | 8,000 | Not publicly specified |
| Yardeni Research | 8,250 | Not publicly specified |
SocGen’s positioning: The bank advises investors to view dips in momentum-driven positions as entry points rather than warning signs, a confident bullish bias oriented around disciplined entry, not a prediction of explosive near-term gains.
From approximately 7,600, the 8,000 target implies high-single-digit upside. The question for investors is whether that upside is broad-based or concentrated, and SocGen’s answer to that shapes a structural recommendation that matters more than the target itself.
When big ASX news breaks, our subscribers know first
What the equal-weight call actually means for how you hold U.S. stocks
The price target grabbed the headline. The structural recommendation underneath it may matter more for how you are actually positioned.
How equal-weight construction differs from the standard index
SocGen explicitly favours the equal-weighted S&P 500 over the standard cap-weighted benchmark. The distinction is mechanical but its investment implications are significant.
- Cap-weighted S&P 500 (tracked by SPY, VOO): Each company’s weight is proportional to its market capitalisation. A handful of mega-cap technology names can drive the majority of index returns, meaning your performance depends heavily on a small group of very large companies.
- Equal-weight S&P 500 (tracked by RSP): Each of the 500 constituents carries approximately the same weight regardless of size. Performance reflects breadth across the full index, so your returns are tied to the average company rather than the largest ones.
Equal-weight indexes tend to outperform during periods of broad market participation and underperform when a narrow group of mega-caps dominates earnings and price leadership.
Cap-weighted concentration in the S&P 500 has reached historically extreme levels, with five mega-cap stocks controlling roughly 23% of the broad market index and driving the majority of both Q1 2026 losses and April’s subsequent recovery, a dynamic that gives SocGen’s equal-weight preference a structural foundation beyond near-term earnings breadth.
Why SocGen’s earnings thesis points to equal-weight over cap-weight now
According to Kabra’s note, the S&P 500 Equal Weight Index reaching record highs demonstrates that earnings growth has spread well beyond the largest technology names, serving as evidence of what has already happened rather than a forecast. The rally, in SocGen’s framing, is no longer exclusively a “Magnificent Seven” story. Small caps and equal-weight indexes have been improving alongside large-cap performance.
If that earnings-breadth thesis holds, an investor concentrated in a standard cap-weighted ETF is holding a less balanced exposure than the underlying market conditions may warrant right now. Cap-weight would again be the preferable structure if mega-cap technology reasserts dominant earnings and price leadership, but SocGen’s base case is that it will not.
An earnings season for the record books, and what the numbers actually show
The beat rate is where it starts: 86% of reporting companies exceeded expectations, against a historical average of approximately 74%. That alone is strong. What makes this season exceptional is what happened at the other end.
The earnings season beat rate in Q2 2026 came in against a deliberately raised bar, with analysts revising EPS estimates upward by 3.4% during the quarter rather than cutting them, making the 86% beat figure harder to dismiss as a product of lowered expectations.
All-time low: Just 9% of reporting companies fell short of consensus estimates, a figure SocGen’s proprietary earnings tracker identifies as the weakest miss rate ever recorded.
A 9% miss rate combined with record margins outside the technology sector tells you the earnings story is not being carried by a handful of AI-linked companies. This is a genuine economy-wide phenomenon.
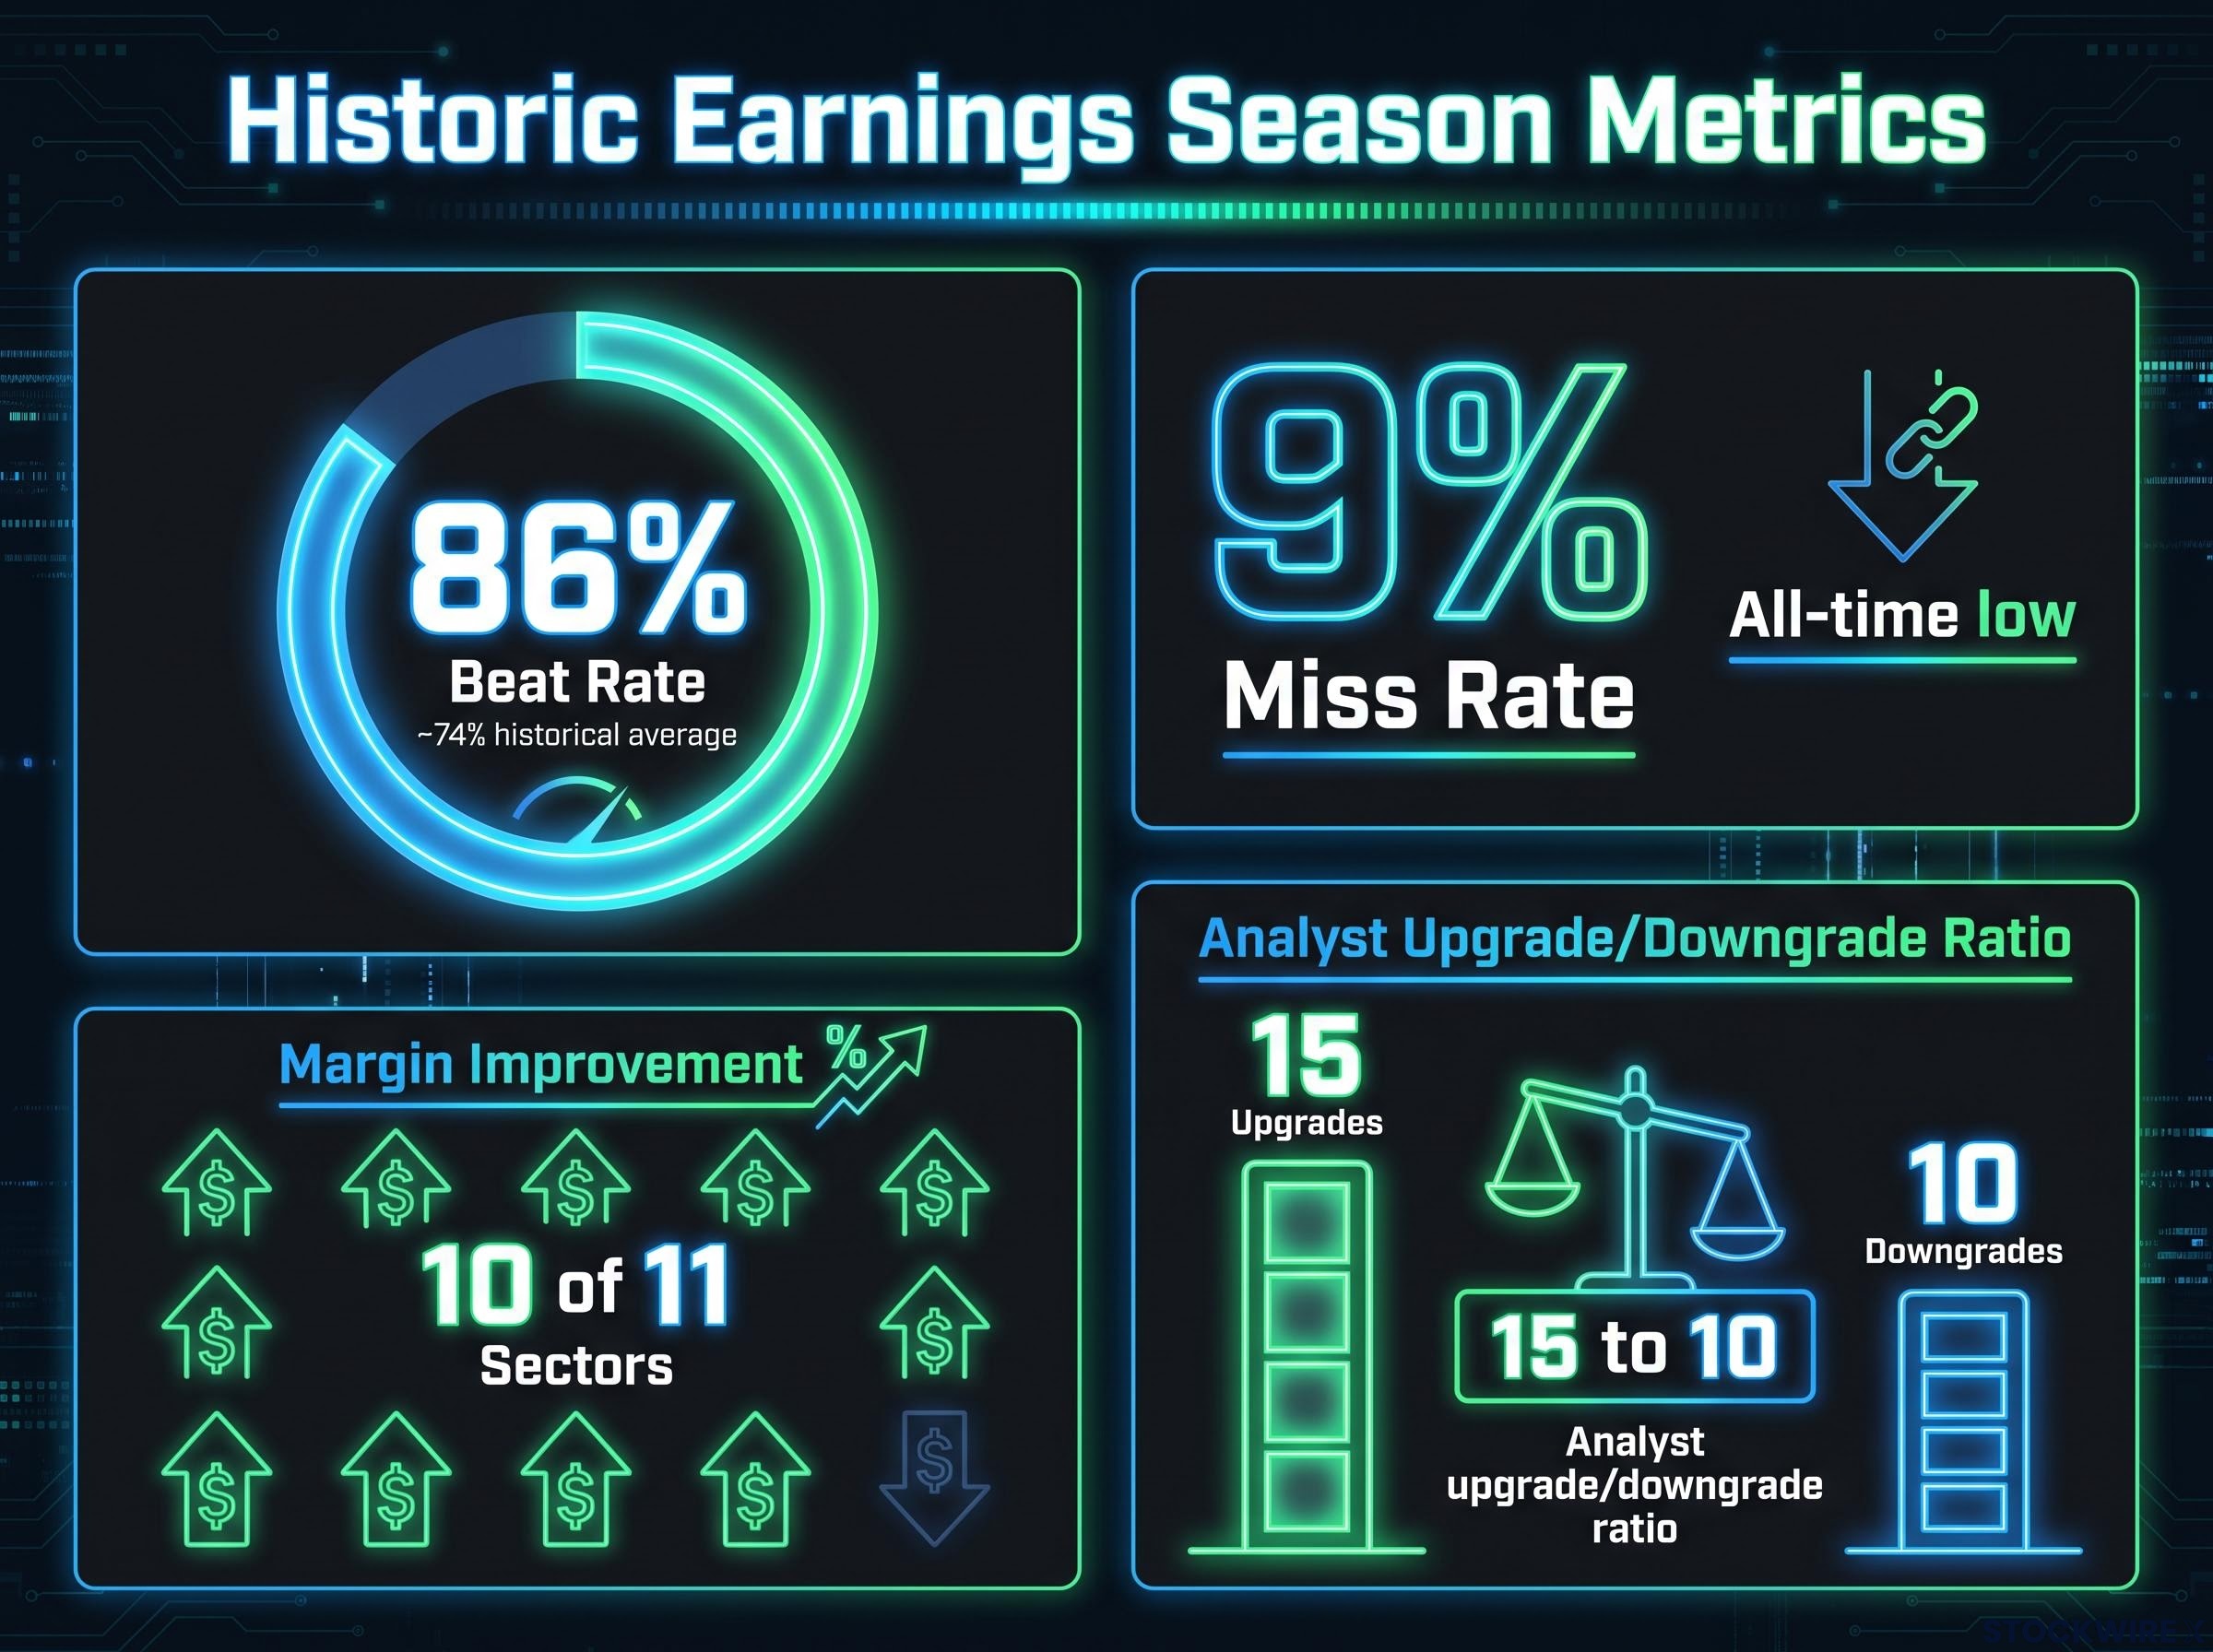
| Metric | Current reading | Historical benchmark |
|---|---|---|
| Beat rate | 86% | ~74% (historical average) |
| Miss rate | 9% | All-time low per SocGen |
| Sectors with margin improvement | 10 of 11 | Record overall and ex-tech margins |
| Analyst upgrade/downgrade ratio | 15 to 10 | Upgrades concentrated in tech, financials, industrials |
| Beat outperformance vs. index | ~0.2% | Positive market recognition sustained |
Profitability improved across 10 of 11 S&P 500 sectors, pushing both headline and ex-technology margins to all-time highs, a result that lends direct support to the equal-weight thesis. The upgrade cycle is running strongest in technology, financials, and industrials, a mix that spans AI-linked names and sectors tied to the broader economic cycle.
SocGen revised its full-year 2026 EPS estimate upward by 2% to $335 since the season commenced, implying a forward price-to-earnings (P/E) ratio, the price investors pay per dollar of earnings, of approximately 23.9x at the 8,000 target. That figure deserves scrutiny: broader Street consensus associates the 8,000 target with EPS estimates ranging from $340 to $375, implying a more moderate 21-23x forward P/E. The discrepancy may reflect differing time horizons or the gap between SocGen’s proprietary estimate and broader consensus. At $335 and 23.9x, the valuation picture is richer than most public commentary implies, and investors should factor that into their own assessment of entry risk.
What would actually force SocGen to abandon its bullish outlook
A price target without a risk framework is incomplete information. SocGen defines precisely what would break the thesis, and the specificity makes it useful as a monitoring checklist rather than a vague catalogue of threats.
- Aggressive Federal Reserve monetary tightening. Higher rates raise real yields and compress equity multiples directly. The valuation stability that underpins the 8,000 thesis depends on the Fed not aggressively hiking. Tightening would squeeze the price investors are willing to pay for AI-driven earnings growth, threatening the multiple before the earnings themselves deteriorate.
- Yield-curve inversion signalling recession risk. A yield curve inverts when short-term interest rates exceed long-term rates, a pattern that has historically preceded U.S. recessions. A deep, persistent inversion would put both earnings and valuations at risk simultaneously, removing the two supports the entire bullish case rests on.
The key variable: SocGen frames Federal Reserve policy as the single most important factor determining what valuation multiple the market can sustain on AI-driven earnings.
The Federal Reserve policy stance entering the second half of 2026 matters directly to SocGen’s valuation multiple: with core PCE running at 3.2% and futures markets pricing no meaningful easing before late 2026, the floor under which aggressive tightening becomes the base case rather than a tail risk has narrowed considerably since the year began.
Neither of these scenarios is part of SocGen’s base case. The bank recognises that elevated market leverage and higher real yields are already limiting how far valuations can re-rate, yet concludes that within those constraints the bullish outlook remains intact. If you are holding or considering index exposure aligned with this thesis, these two macro indicators are the specific variables to check before deciding whether the case remains intact at any given point.
What the 8,000 thesis means before you act on it
SocGen’s case rests on three interlocking components: earnings breadth strong enough to support broad-based index gains, a structural preference for equal-weight over cap-weight that follows from that breadth, and a conditional risk framework that defines when the bullish stance no longer holds.
The decision facing investors is not a single question. It separates into three:
- Directional exposure: From approximately 7,600, the 8,000 target implies roughly 5% upside. SocGen recommends using pullbacks as buying opportunities. That is a modest but actionable directional view.
- Index construction choice: The equal-weight preference (RSP) versus cap-weight (SPY, VOO) is a separate structural decision. You can agree with the 8,000 target and still disagree with the equal-weight tilt, or vice versa. The choice depends on whether you believe earnings breadth is durable or whether mega-cap leadership will reassert itself.
- Risk trigger monitoring: The two-condition framework (aggressive Fed tightening plus yield-curve inversion) gives you specific, observable variables to track. The thesis remains intact as long as neither condition materialises.
The EPS discrepancy matters here. At SocGen’s own $335 estimate and 23.9x forward P/E, the valuation is richer than the headline target suggests. Broader Street estimates in the $340-$375 range imply a more moderate multiple. Where you land on that range shapes how much margin of safety you believe exists between here and 8,000.
The question is not simply whether you believe in 8,000. It is whether you believe the earnings breadth story is durable enough to justify holding equal-weight exposure through the volatility that precedes any year-end target being reached.
For investors wanting broader context on how major asset managers are navigating the same macro conditions SocGen is analysing, our full explainer on institutional positioning for late-cycle markets covers how BlackRock, JPMorgan, and Fidelity are balancing overweight equity stances against rising concentration and yield risks.
This article is for informational purposes only and should not be considered financial advice. Investors should conduct their own research and consult with financial professionals before making investment decisions. Past performance does not guarantee future results. Financial projections are subject to market conditions and various risk factors.