
Covered call ETFs advertise yields of 10-20%, and the number does most of the marketing work. What almost no product page tells you is where that yield actually comes from, or what the fund had to give up to generate it.
The uncomfortable truth is that the headline yield is decided long before the first option is ever written. It is the output of three earlier choices: which stocks the fund overwrites, how far above the current price it sets the strike, and how it manages leverage as prices drift. Understanding how covered call ETFs work means understanding those decisions, because the yield is downstream of every one of them.
To make this concrete rather than theoretical, this piece uses two live funds as working machinery: Ninepoint’s USHI and EDHI, which began trading on the TSX in September 2026. These are not recommendations. They are simply a fresh, real structure to trace the logic through.
Work through what follows and you will be able to look at any covered call ETF you are considering and answer the question that matters: is it trading away your equity upside for yield in a way that actually fits what you want your portfolio to do?
The mechanics underneath the yield number
You already understand the surface of it: the ETF pays you a premium, and that premium shows up as distributions. The mistake is treating that premium as free money. It is compensation, and it is worth knowing exactly what you sold to earn it.
A covered call has two parts. You own a stock, and at the same time you sell another investor the right to buy that stock from you at a fixed price before a set date. In return, that investor pays you an upfront premium.
A covered call has two parts. You own a stock, and at the same time you sell another investor the right to buy that stock from you at a fixed price before a set date. Call and put options each carry distinct risk profiles depending on whether you are the buyer or the seller, and the asymmetry between those roles is what makes the premium feel like income when you are on the selling side.
Here is the sequence in practice:
- You own a stock currently trading at $100.
- You sell a call giving someone the right to buy it from you at $105, and you collect a premium immediately.
- At expiration, if the stock is below $105, you keep the premium and the stock. If it has climbed to $120, you still only sell at $105, and the extra $15 goes to the buyer.
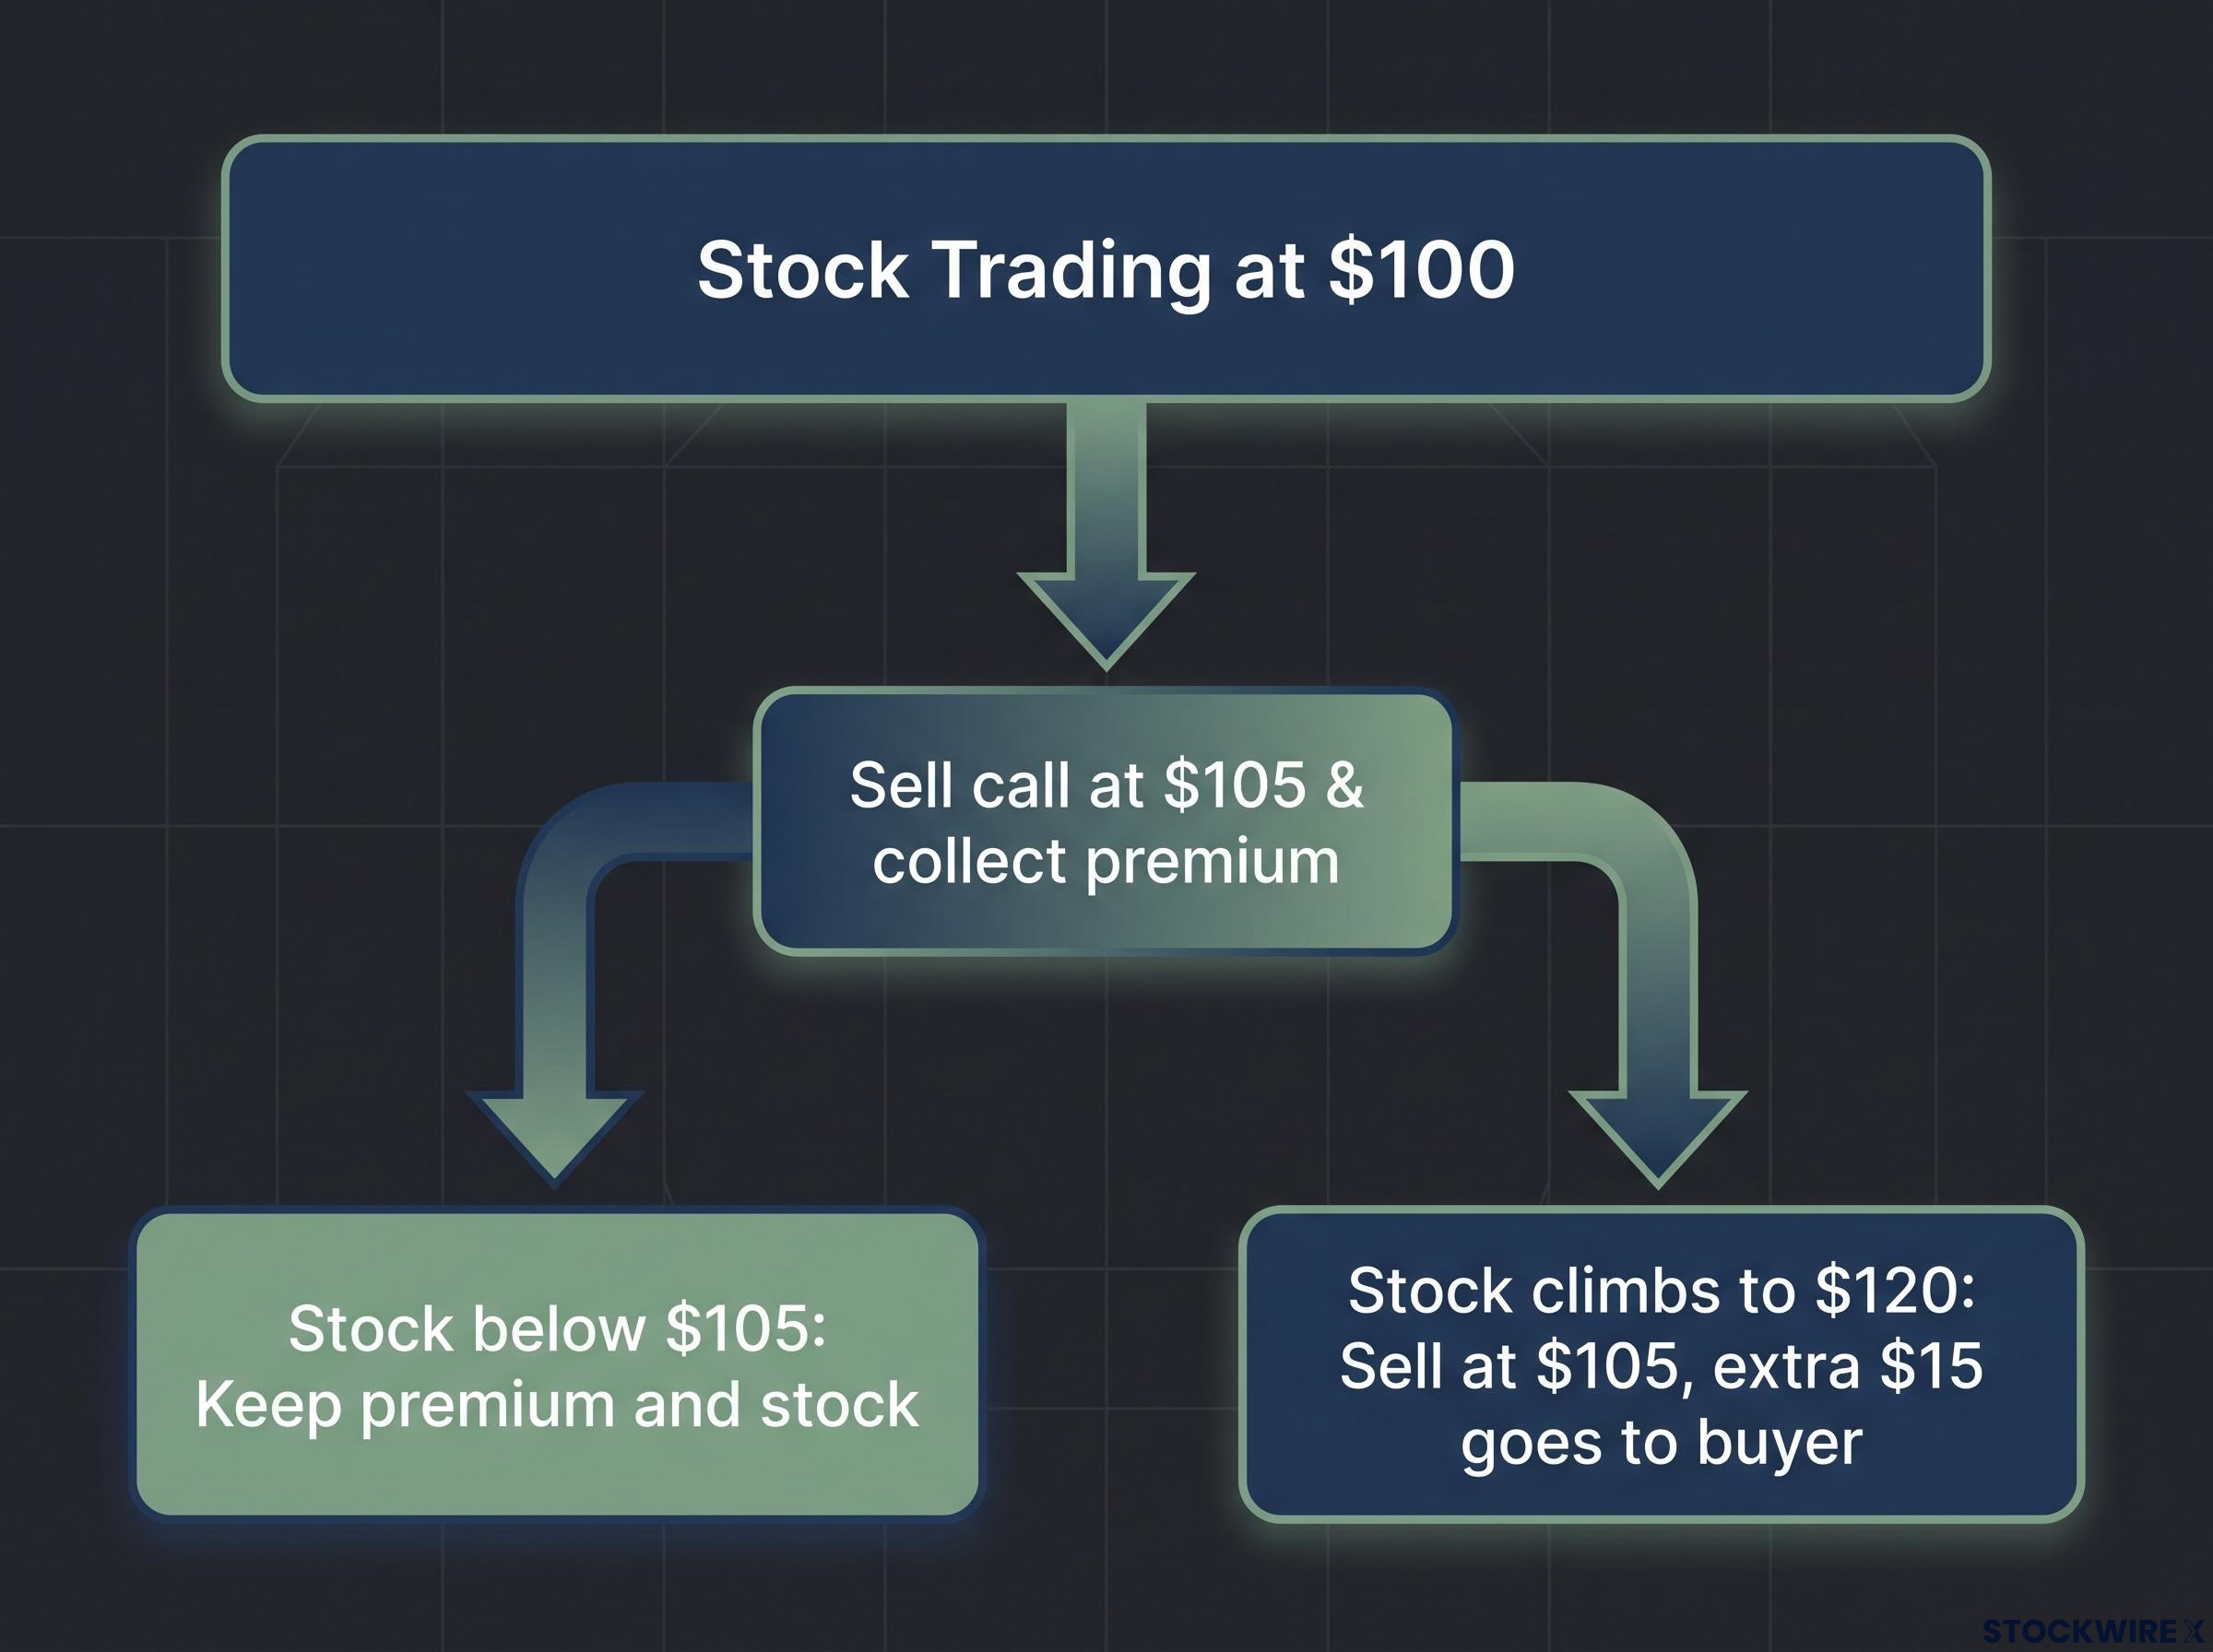
That is the whole trade. The premium is not income in the way a dividend is income. It is payment for capping the upside on a position you already own.
The seller keeps that premium regardless of what happens. What the seller forfeits is any gain above the strike price. In a flat or gently rising market, that is a good bargain. In a strong rally, it is expensive.
The cost of capping upside Backtests of the BXM index, which writes at-the-money calls on the S&P 500, show the strategy sacrificed an average of 13.3 percentage points of return per year in strong bull markets compared with simply holding the index.
None of this is a flaw. It is a deliberate design choice, and its value depends entirely on what you want the money to do. But there is a consequence most yield-seekers miss.
When you buy a covered call ETF, you have already placed an implicit bet against strong near-term equity upside. You need to know you are making that bet before you buy, not discover it during the next rally.
When big ASX news breaks, our subscribers know first
Why managers only overwrite 40-45% of the portfolio
If capping upside is the cost, then the obvious question is how much of the portfolio a fund should cap. This is where the most consequential decision in the whole structure gets made, and it rarely appears in the marketing.
Ninepoint’s prospectus permits writing calls on up to 50% of the portfolio. Its options team typically writes on only 40-45%. That leaves 55-60% of holdings completely uncovered, free to appreciate with no ceiling at all.
This is partial overwriting, and it is the primary dial managers use to set the balance between yield and growth. Write on more of the portfolio and you generate more premium but surrender more upside. Write on less and you keep more growth but collect less income.
The overwrite percentage tells you more about how a fund will behave than the yield figure does. A fund writing on 40% of its holdings will move much more like an equity position. A fund writing on 100% will behave like an income instrument that happens to hold stocks.
Across professional managers, the common range sits between 30% and 50%. Ninepoint’s 40-45% target sits comfortably inside it. The point is not that one number is correct; it is that you should find this number first, before you look at the yield.
What full overwriting actually costs you
The contrast that makes this vivid is a full-overwrite fund. QYLD writes at-the-money calls on 100% of its portfolio and carries a trailing 12-month yield of around 11.6%.
The problem is structural. When every position is capped at the money, every strong month gets truncated at the strike, so the fund’s net asset value (NAV, the per-share value of the underlying holdings) cannot compound alongside the market. QYLD has seen historical NAV erosion of roughly 35%.
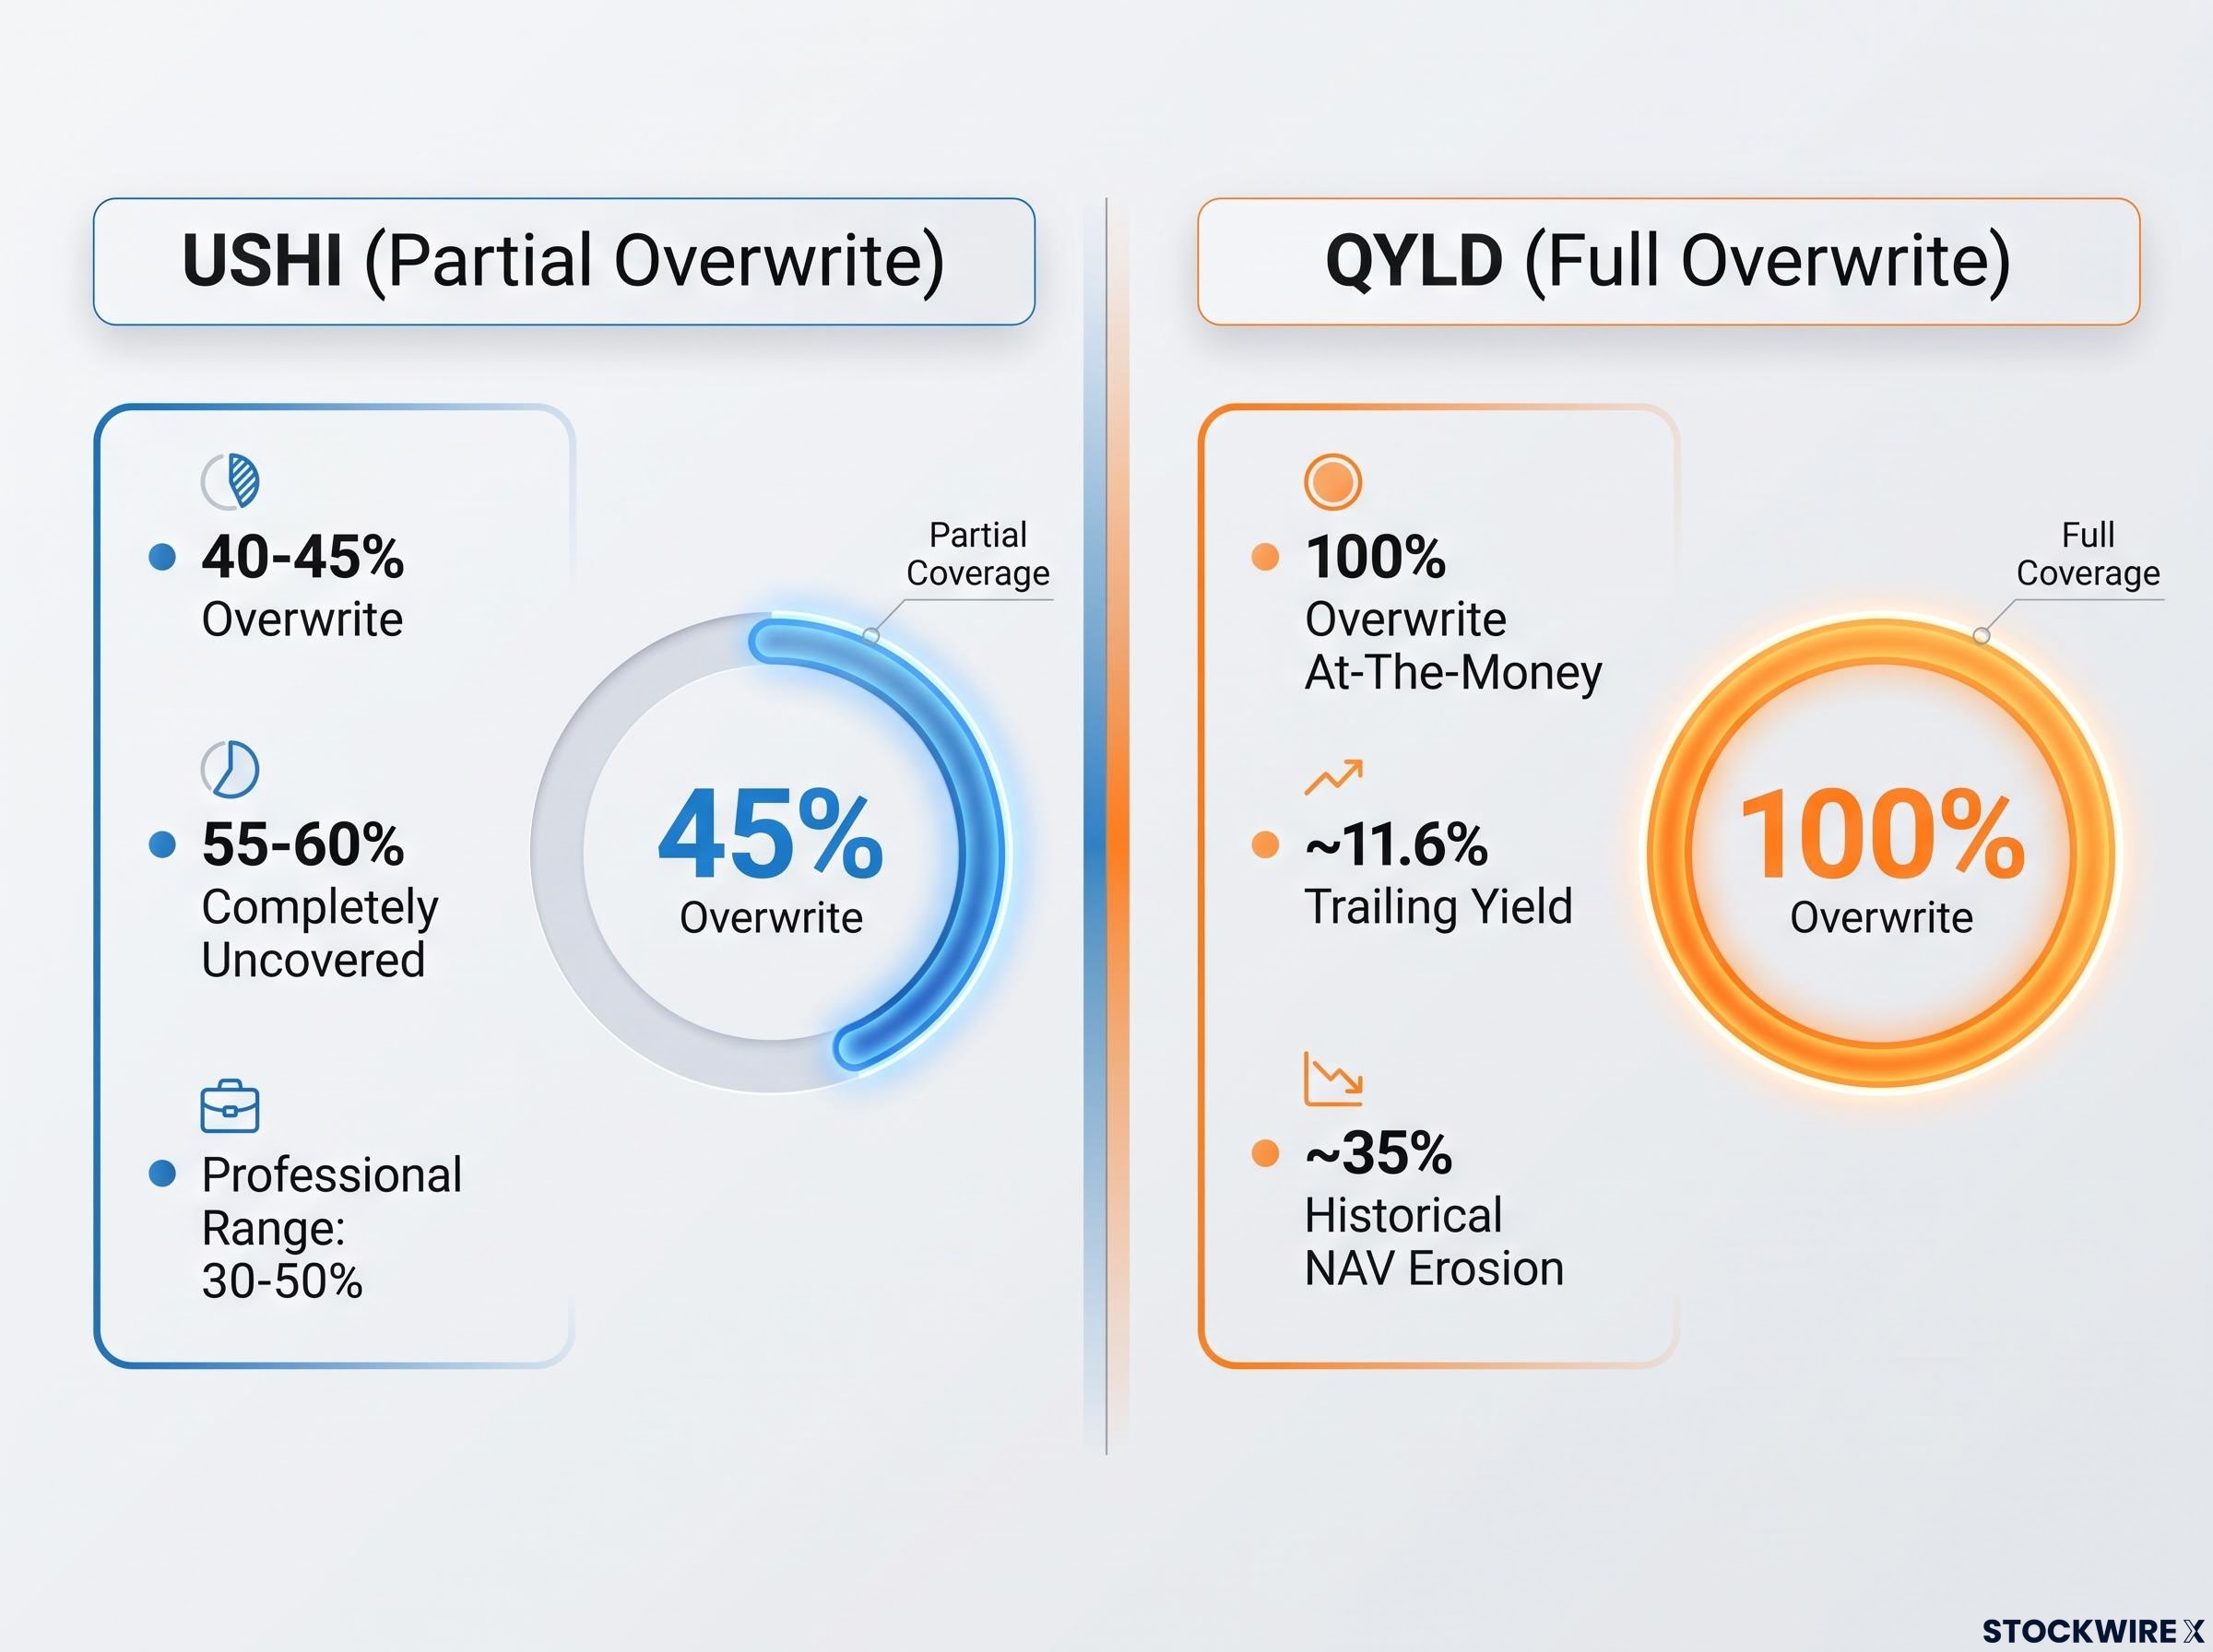
That gap between headline yield and total return is the whole lesson. A high distribution funded by a shrinking NAV is not the same as a high return.
| Fund | Overwrite % | Strike type | Trailing yield | Key trade-off |
|---|---|---|---|---|
| USHI | 40-45% | Out-of-the-money | Distributions semi-monthly | Retains meaningful upside; lower premium income |
| QYLD | 100% | At-the-money | ~11.6% | High yield; ~35% historical NAV erosion |
| XYLD | Full overwrite | At-the-money | Income-focused | Caps upside across the S&P 500 every month |
Research from OptionMetrics across select tech stocks makes the same point from the other direction: 5% out-of-the-money covered calls returned 26.14% annually versus 14.06% for at-the-money strategies. How much you cap, and where, drives everything.
How strike placement shapes both income and upside: OTM versus ATM explained
Overwriting decides how much of the portfolio gets a ceiling. Strike placement decides how high that ceiling sits. And here the intuition many investors carry turns out to be backwards.
A call is out-of-the-money (OTM) when the strike price is set above the current market price. The stock has to rally before the option can be exercised. An at-the-money (ATM) call is struck right at the current price, so it starts working against any gain immediately.
The surface observation is simple: OTM calls collect less premium, because you are selling something less likely to pay off for the buyer. So they should produce less. That is where most people stop.
Ninepoint writes OTM calls generally 1-7% above the current market price, with the exact distance set by each stock’s volatility. Take the $100 stock again. A call written at $101 is 1% OTM: it collects a premium close to an ATM call but caps you almost immediately. A call written at $107 is 7% OTM: it collects less premium but lets the stock climb meaningfully before the ceiling bites.
The premium and the upside allowance move in opposite directions. Tighter strikes buy income at the cost of growth. Wider strikes buy growth at the cost of income.
The counterintuitive part is what happens over time. Allowing more room for the stock to run lets more of the equity risk premium accrue to the fund, and over a full market cycle that room can matter more than the extra premium a tight strike collects.
What the extra room is worth OptionMetrics research on select tech stocks found 5% OTM covered calls returned 26.14% annually against 14.06% for at-the-money strategies. Less premium, more total return.
How wide a strike a manager can set depends on the underlying stock. High-volatility names still pay attractive premiums even far from the money, so they support wider bands. Low-volatility names barely pay unless the strike is tight.
How wide a strike a manager can set depends on the underlying stock, and the driving variable is implied volatility: high-volatility names still pay attractive premiums even far from the money, which is why Tesla and Palantir support wider OTM bands while Walmart and Costco require tighter strikes to generate meaningful income.
Ninepoint sorts its holdings into three volatility tiers:
- High-volatility: Tesla, Palantir, Micron, AMD (wider OTM bands, premiums stay rich further out)
- Mid-volatility: Nvidia, Alphabet, CrowdStrike, Goldman Sachs (moderate strike distances)
- Low-volatility: Walmart, Costco, JPMorgan (tighter strikes needed to generate meaningful premium)
Read this as a signal. A fund chasing a high yield through deep OTM writing on volatile names is making a very different bet from one using tight strikes on stable ones. The OTM depth tells you how bullish the manager really is on near-term prices, and that is the dimension that drives your long-term total return.
How staggered expirations and leverage drift work in practice
So far the portfolio looks static: a list of stocks with calls written on them. In reality it is managed constantly, and understanding that ongoing work is part of understanding what you own.
Options do not all expire on the same day. Ninepoint staggers expiration dates across the calendar so the team is never forced to roll the entire position at once into whatever the market happens to be doing on a single day. Staggering spreads that timing risk out.
The team reviews and resets positions on a bi-weekly basis. Staggered expirations are the structural tool that makes this continuous adjustment workable, because there is always something coming up for renewal rather than everything at once.
Here is the cycle in practice:
- Calls are written across multiple future expiration dates rather than one.
- Each position is reviewed on a bi-weekly schedule.
- As expirations approach, positions are rolled forward or closed.
- Leverage is rebalanced if it has drifted beyond tolerance.
That last step is where the second moving part lives.
Leverage drift and why the target ratio is not a guarantee
Leverage is not a fixed number. It is a ratio, and the denominator is the fund’s NAV, which changes every time prices move, which is constantly.
Ninepoint targets leverage of 20-25% of NAV, well below the prospectus maximum of 33%. That gap is deliberate operating room. But room is not immunity from drift.
In an earlier Ninepoint fund, a large price move in a Shopify holding pushed leverage temporarily above the 25% target. The appreciation itself changed the ratio, and the compliance team had to rebalance the portfolio back into range even though nothing about the strategy had changed.
Rebalancing is not free. Funds do not trade daily to hold leverage perfectly, because that generates real cost: industry estimates put trading costs at roughly 30 basis points per 10% of a stock’s average daily volume traded. Instead they use tolerance bands, letting leverage drift within a set range and only trading when it breaks out.
What this means for you is straightforward. The stated leverage ratio is a target the fund aims at, not a constant it holds. And the cost of keeping it near that target is real, invisible in the marketing, and passed through to performance. How well a fund manages that drift is a genuine measure of operational quality, separate from the headline yield entirely.
What the yield number does not tell you: return of capital, NAV erosion, and distribution volatility
You now understand the machinery. The last step is turning that understanding into scepticism, and the cleanest way is to look at what actually funds the distribution.
When option premiums and equity income are not enough to cover the stated distribution, funds frequently make up the difference with return of capital (ROC). ROC is not income at all. It is a repayment of your own principal, handed back to you and labelled as a distribution.
When option premiums and equity income are not enough to cover the stated distribution, funds frequently make up the difference with return of capital, a mechanism that can account for more than half the headline yield and carries direct tax consequences that erode compounding over time.
The gap can be large. One analysis flagged a fund advertising a 10% headline yield where the genuine income generated was only 4.8%. The remainder came from return of capital.
When yield is partly your own money A 10% headline yield where the true income was just 4.8% means well under half the distribution came from investment returns. The rest was principal being returned to the investor.
There is a second instability built in. Yields on covered call ETFs are driven by implied volatility in the options market, not by corporate earnings. That makes them far less predictable than dividend income, which is tied to company profits. Monthly distributions on peer ETFs have historically swung by 30-50%.
For US-listed structures, there is an outer boundary on how far this can go. SEC Rule 18f-4 caps a registered fund’s derivatives-related exposure at 200% of a reference portfolio, effectively limiting leverage to roughly 2x. It sets the ceiling, not the safety.
None of this is an argument against covered call ETFs. It changes how you read the yield. Three questions surface the truth behind any headline number:
- What percentage of past distributions were return of capital?
- What has the fund’s NAV done over the past 12-24 months?
- How much has the monthly distribution swung over the past year?
Interpret a covered call ETF on its headline yield alone and you risk mistaking the return of your own capital for investment income. That has direct tax consequences and quietly undermines long-term compounding, which is exactly why this is the one skill that matters most.
Making a genuine evaluation of covered call ETFs before you commit
Everything above resolves into four variables. Once you can read them, you can evaluate any covered call ETF, not just the two used here as the example.
The overwrite percentage tells you whether the fund behaves like equity or income. The strike placement tells you how much upside survives. Leverage management tells you how disciplined the operation is. And distribution composition tells you whether the yield is real.
| Variable | What to look for | Red flag signal |
|---|---|---|
| Overwrite % | A stated target you can find in the prospectus | 100% overwrite paired with a very high headline yield |
| Strike type | OTM strikes that leave room for appreciation | Deep OTM on volatile names sold purely as yield |
| Leverage management | Operating range set below the prospectus maximum | Leverage run at or near the permitted ceiling |
| Distribution composition | Distributions funded mostly by genuine income | Large or recurring return of capital |
The central trade-off, in plain language: a covered call ETF makes sense when you genuinely want to swap some equity upside for current income. It does not make sense as a way to collect what looks like a high yield while still expecting full equity growth. You cannot have both.
For a sense of scale, JEPI offers a useful reference point for a conservative income structure: an indicated yield of 7.52% and an expense ratio of 0.58%. Against that, Ninepoint’s USHI carries a management fee of 0.40%, and cost always feeds directly into total return.
Worth noting: the funds used here as a case study sit at the more conservative end of the spectrum, with partial OTM overwriting, moderate leverage, and a volatility-tiered stock selection driving the options layered on top. The same framework applies with equal force to far more aggressive products, and that is the point.
Leveraged covered call ETFs combine 1.25x equity exposure with a call-writing overlay to produce a portfolio delta of approximately 0.92, a structure that sits at the more aggressive end of the spectrum this article covers and carries meaningfully different risk dynamics than the partial-overwrite, moderate-leverage approach described here.
If you keep one thing, keep this: the advertised yield is the output of a chain of earlier decisions. Evaluating those decisions is the only way to know whether the yield is worth what was given up to produce it.
Run any fund you are considering through the same three questions:
- How much of past distributions was return of capital?
- What is the NAV trend over 12-24 months?
- How volatile has the monthly distribution been?
This article is for informational purposes only and should not be considered financial advice. Investors should conduct their own research and consult with financial professionals before making investment decisions. Past performance does not guarantee future results. Financial projections are subject to market conditions and various risk factors.