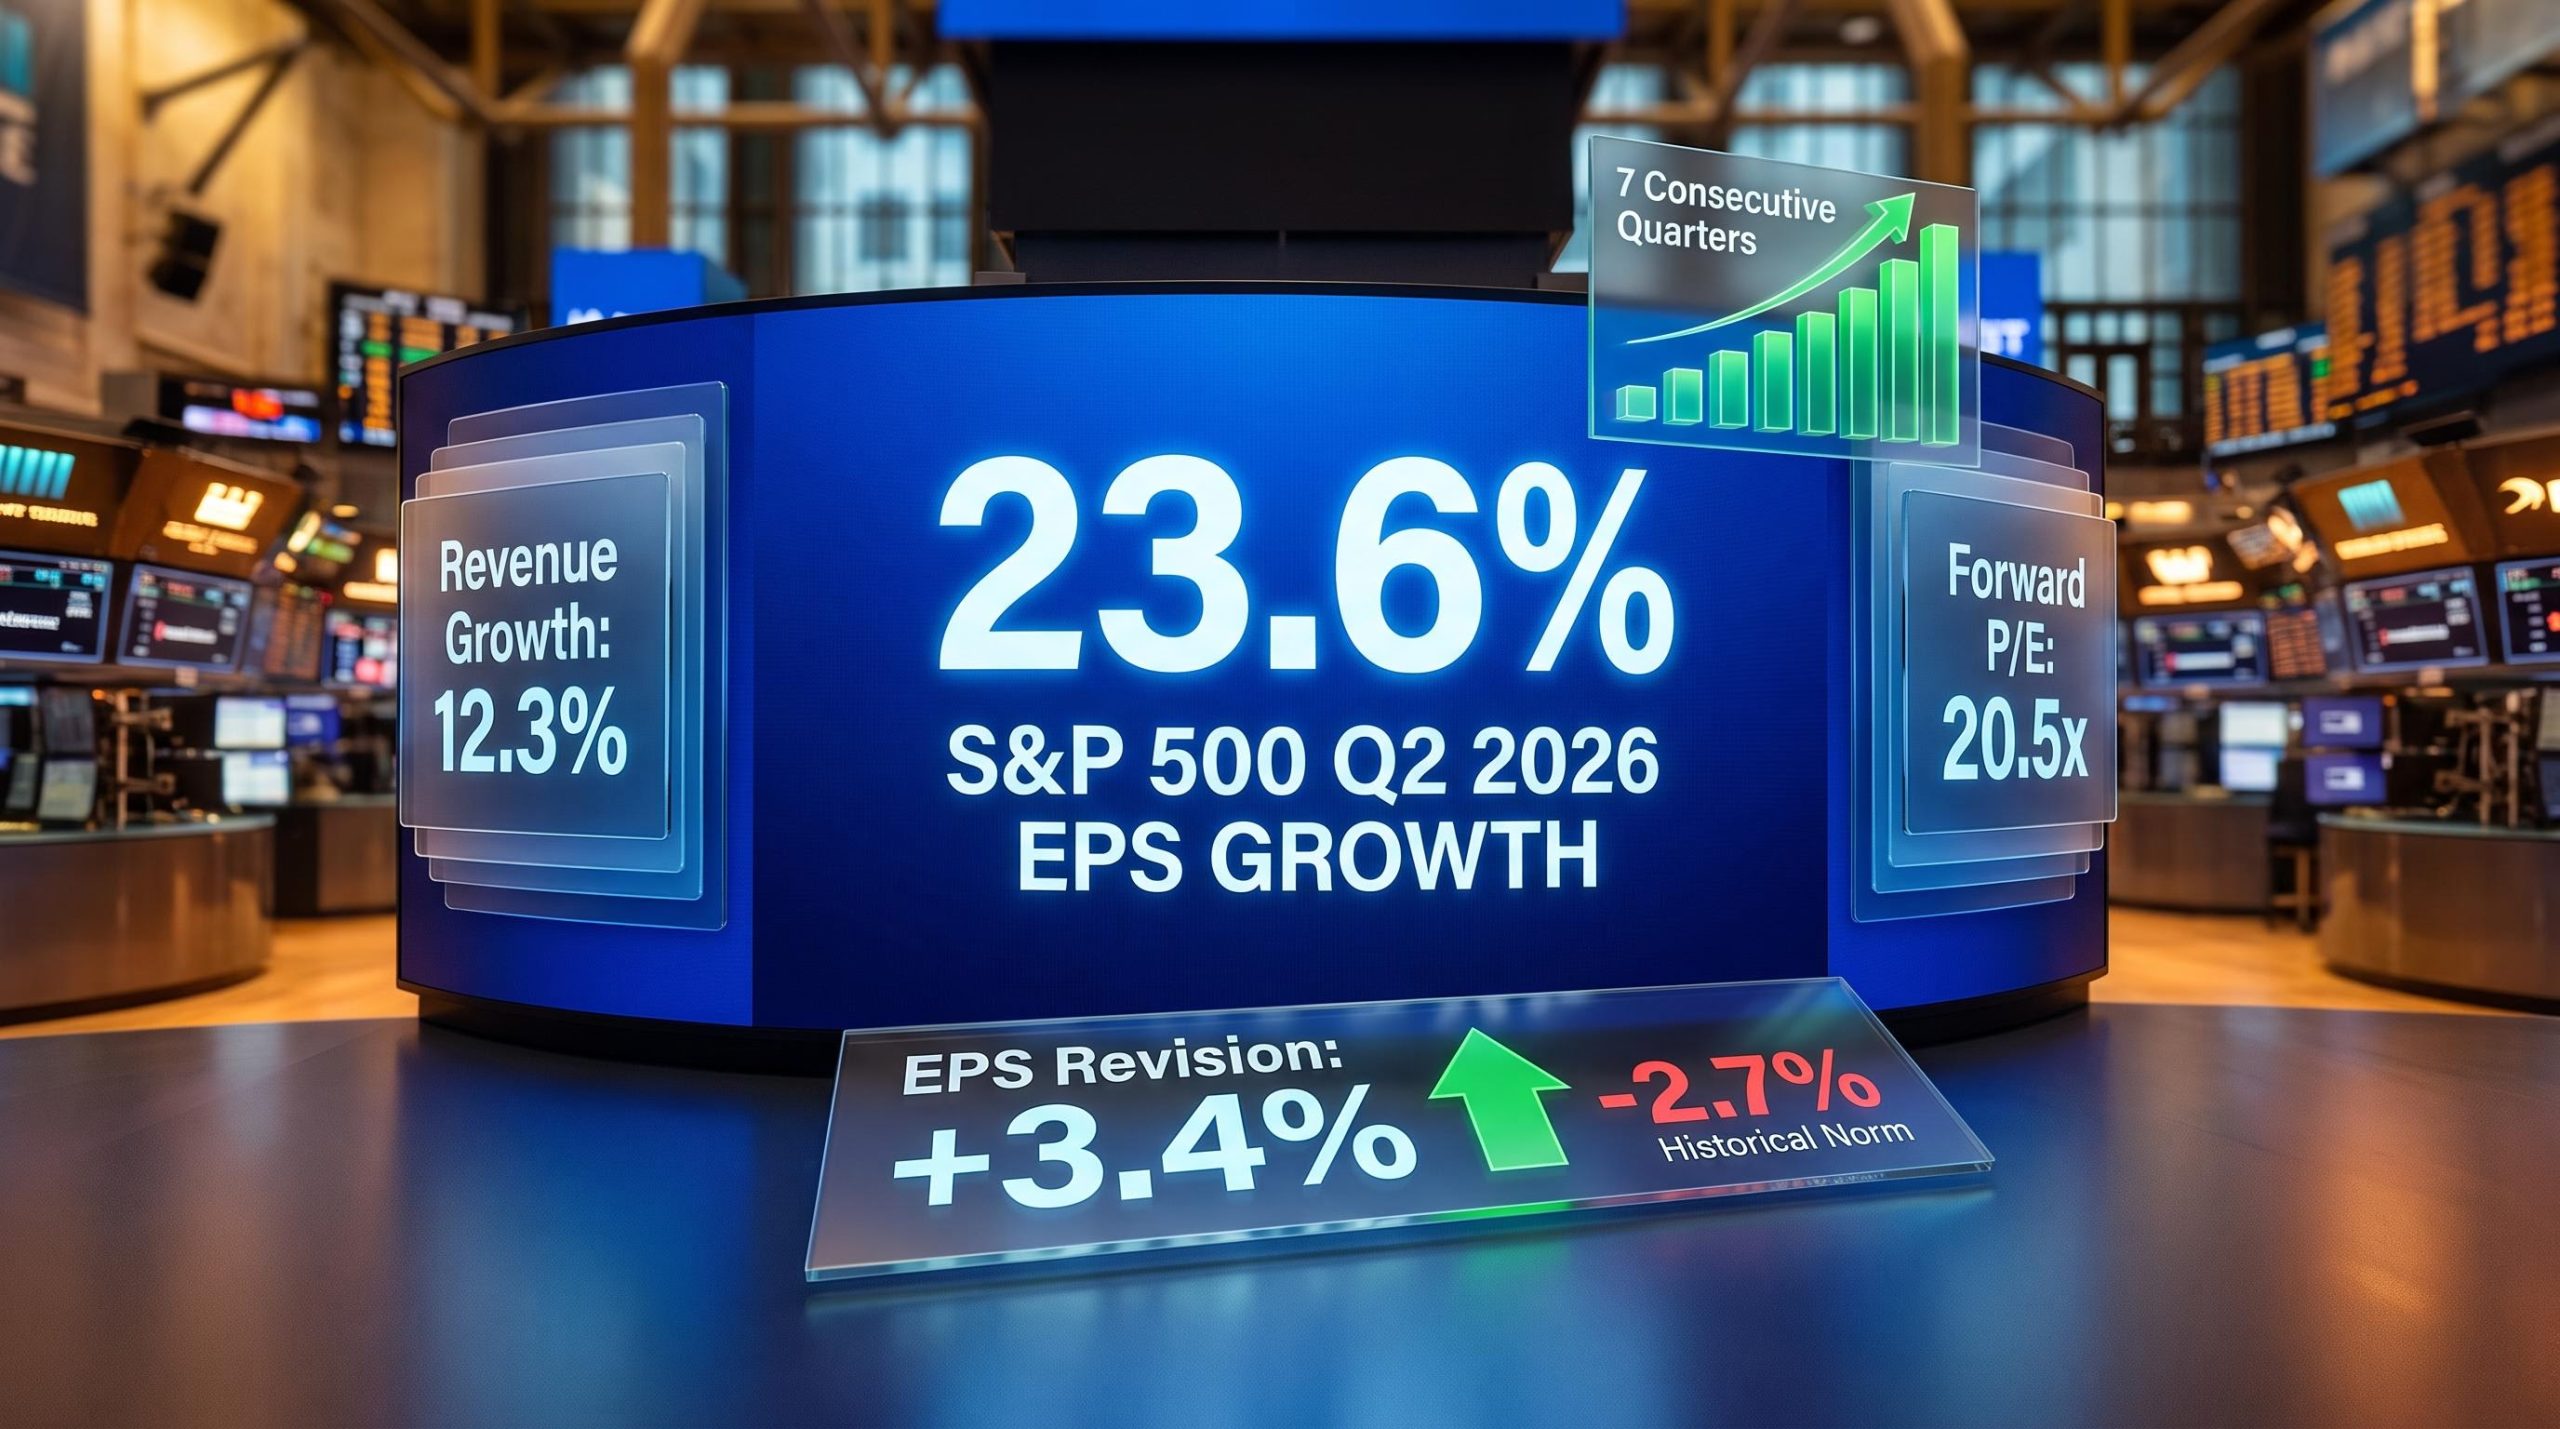
A 23.6% projected earnings growth rate for the S&P 500 in Q2 2026 looks like the kind of number that settles arguments. It does not. It raises harder ones.
Peak reporting season is underway as of mid-July, with the bulk of S&P 500 companies due to report through late August 2026. If the quarter delivers as expected, it will mark two consecutive quarters above 20% earnings growth and seven straight quarters of double-digit expansion. These are not projections investors can afford to wait on; the numbers are arriving now, and the market is already pricing what they mean.
Here is what the growth rate, the revision story, and the valuation number together tell you about how to position through the rest of reporting season, and where the real risk sits even inside a historically strong quarter.
A 23.6% growth rate that is harder to dismiss than it looks
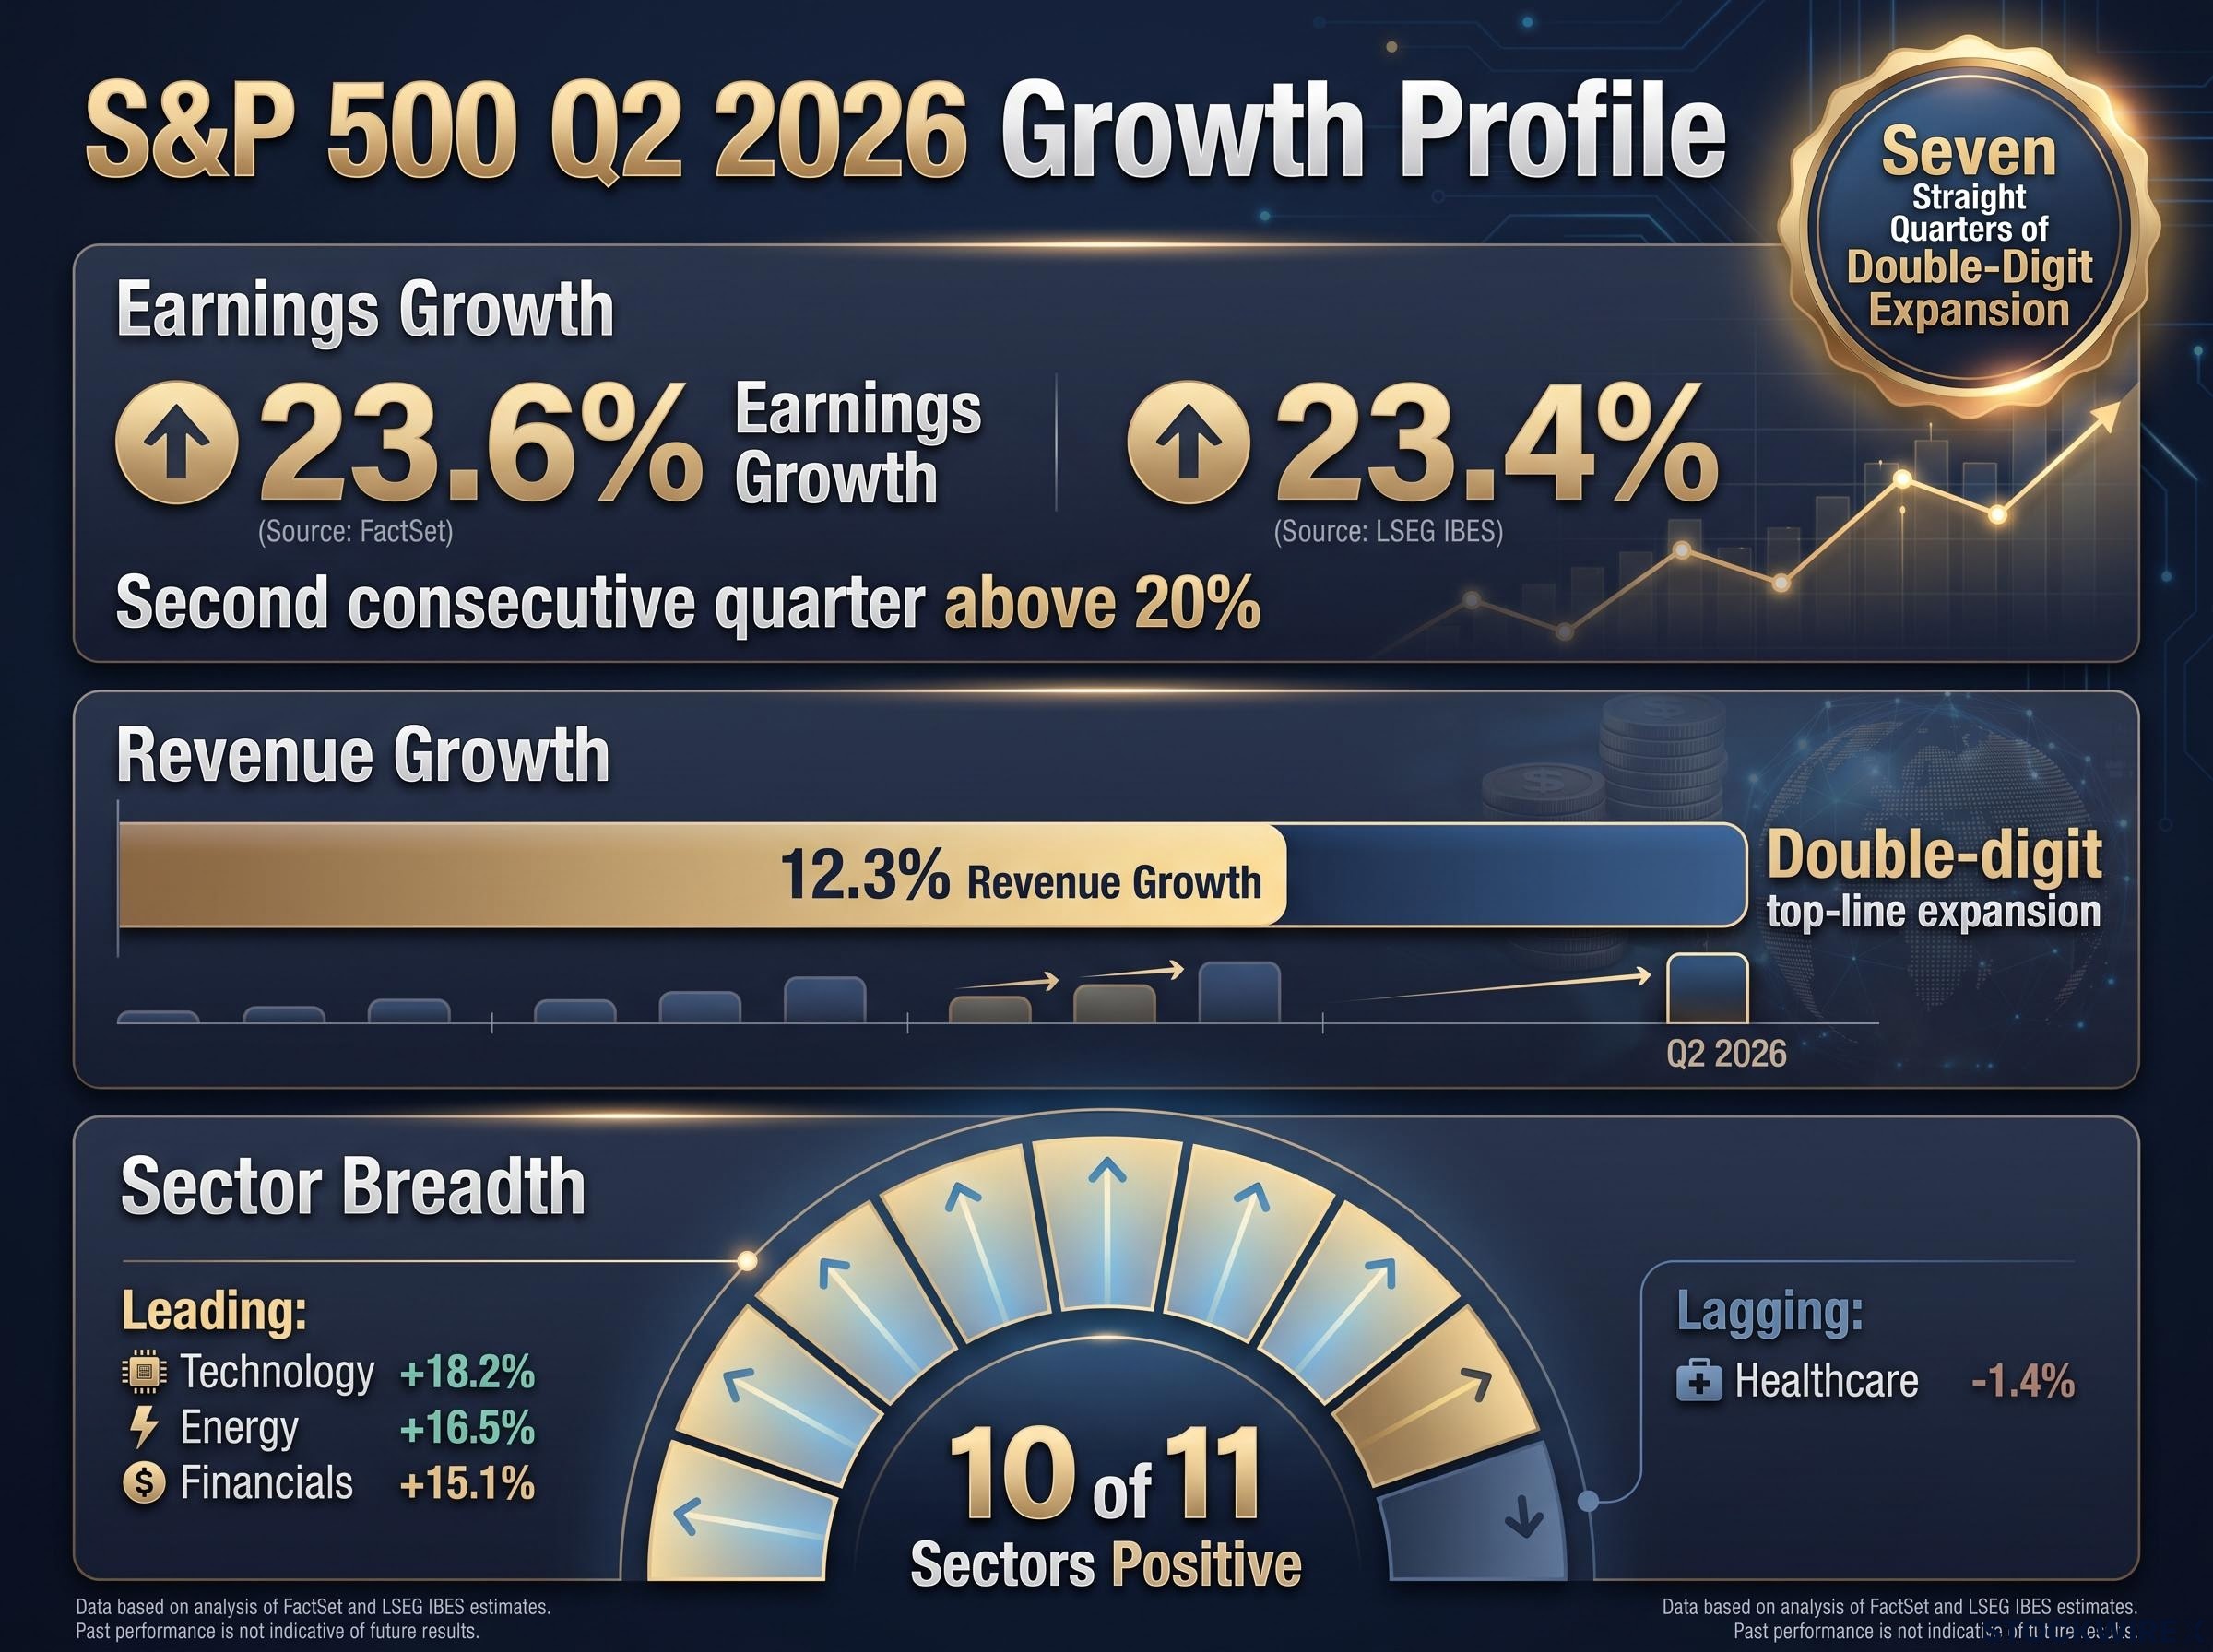
The headline is straightforward: S&P 500 Q2 2026 earnings are projected at 23.6% year-over-year growth according to FactSet, corroborated at 23.4% by LSEG IBES. That is the second consecutive quarter above 20% and the seventh consecutive quarter of double-digit expansion, situating this result inside a sustained trend rather than a one-off spike.
Seven straight quarters of double-digit profit expansion. That is the streak the S&P 500 is extending in Q2 2026, a run that began in late 2024 and has survived rate uncertainty, geopolitical disruption, and multiple sentiment reversals along the way.
The Q1 2026 earnings season produced a blended growth rate of 27.1%, nearly double pre-season analyst estimates, establishing the high-bar precedent that makes the Q2 revision story all the more consequential for investor positioning.
What gives the number its weight is the quality of the growth underneath it:
- Headline earnings growth: 23.6% year-over-year (FactSet), 23.4% (LSEG IBES)
- Revenue growth: 12.3% year-over-year, the second consecutive quarter of double-digit top-line expansion
- Sector breadth: all but one of the 11 S&P 500 sectors are forecast to deliver positive year-over-year earnings growth, with technology, energy, and financials leading while healthcare lags
The revenue confirmation is the detail that matters most. When profits rise on the back of 12.3% revenue growth, the expansion is built on real demand, not margin manipulation or cost-cutting manoeuvres. That distinction is what tells you this earnings cycle has genuine economic substance behind it, and it is the foundation for judging how durable the trend is.
When big ASX news breaks, our subscribers know first
What the S&P 500’s 20.5x forward P/E means when expectations are already elevated
Strong earnings have done real work moderating the valuation picture. Higher profits lift the “E” in price-to-earnings, which has prevented multiples from expanding further even as stock prices climbed through the first half of 2026.
The mechanism is working. The cushion is not.
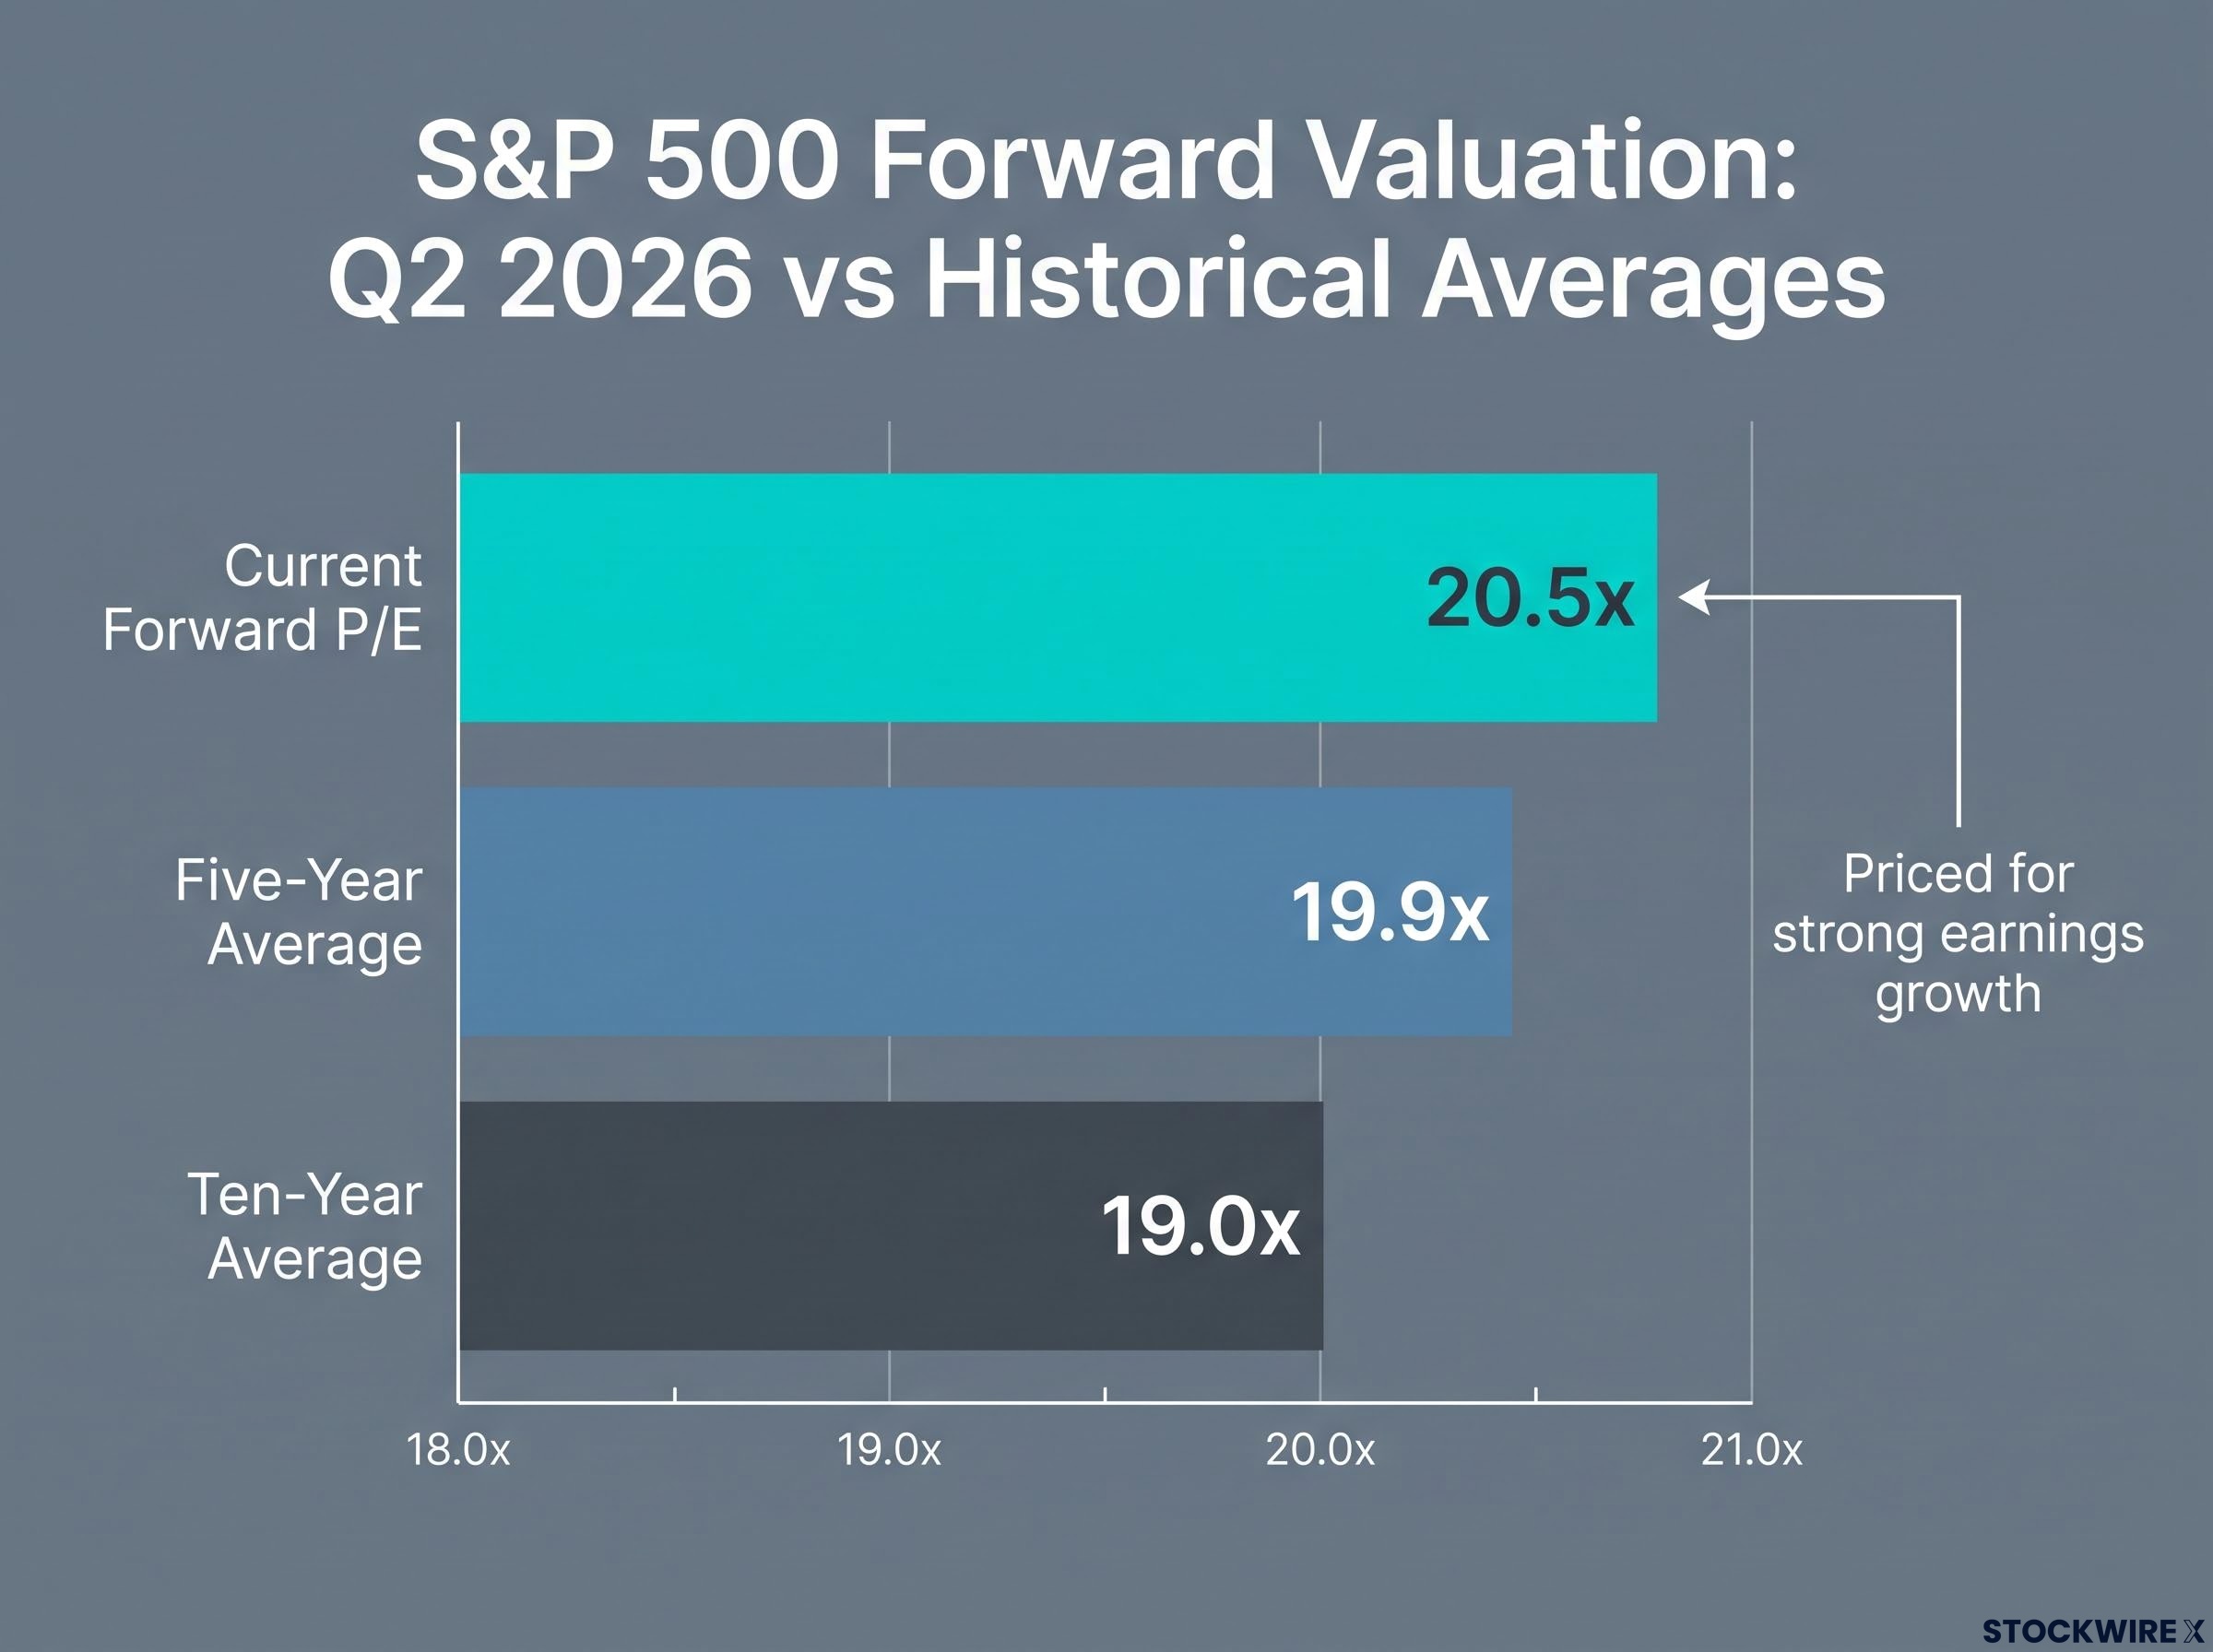
| Metric | Value | What it means |
|---|---|---|
| Current forward P/E | 20.5x | The market has already priced in strong earnings growth |
| Five-year average | 19.9x | Current multiple sits above the medium-term norm |
| Ten-year average | 19.0x | Premium to long-term history is even wider |
At 20.5x forward earnings, the multiple sits clear of both the five- and ten-year historical averages, signalling that investors have already priced in the strong profit cycle rather than waiting for confirmation. Confirming those earnings earns limited reward. Missing them carries elevated cost.
The equity risk premium adds another dimension to the 20.5x forward P/E reading: at a 4.24% implied premium as of May 2026, the S&P 500 sits in historical territory that has typically produced moderate rather than exceptional forward returns, with bond yields at 4.5% now offering real income competition for the first time in the post-COVID era.
Rising profit expectations have been a key driver of the 2026 stock rally, according to Reuters. That creates a reinforcing dynamic where better earnings justify higher prices, which in turn raise the bar for the next reporting cycle. The risk is asymmetric: when the market prices in robust growth, shortfalls or cautious guidance trigger outsized negative reactions relative to what they would cause at a more modest multiple.
Strong results justify current prices. But missteps from large index constituents during peak reporting weeks carry disproportionate market impact, precisely because the valuation leaves so little room for error.
Risk appetite is already uneven. Some segments have seen multiples compress even as earnings rise, a sign investors are differentiating on sustainability. AI-linked and popular growth names remain richly valued. The market is not treating all earnings beats equally, and your positioning should reflect that distinction.
Why analysts raised their forecasts instead of cutting them
Over the prior decade, the standard pattern has been for analysts to trim their bottom-up earnings-per-share (EPS) estimates, the average profit expected per share across the index, by roughly 2.7% during any given quarter. Management teams guide conservatively. Macro uncertainty encourages caution. The manufactured drift downward has historically made beats easier to engineer.
Q2 2026 broke that pattern.
| Metric | Historical norm | Q2 2026 actual |
|---|---|---|
| Quarterly EPS revision | -2.7% | +3.4% |
| Implied growth rate at quarter start | N/A | ~18.8% |
| Implied growth rate by mid-July | N/A | ~23.6% |
Instead of cutting estimates, analysts raised them by 3.4% between 31 March and 30 June 2026, according to FactSet data cited by Vantage Markets senior analyst Hebe Chen. Expected Q2 earnings growth rose from approximately 18.8% at the start of the quarter to approximately 23.6% by mid-July.
The expectations gap is precisely what makes the Q2 revision story cut both ways: analysts raised estimates by 3.4% through the quarter, so a company that merely matches the new consensus delivers no incremental positive surprise to a market that has already priced the upgrade.
The pattern is corroborated across multiple sources. LSEG IBES, Zacks, StreetAccount, and Yahoo Finance all show the same directional movement, reinforcing that this is not a data artefact confined to a single provider.
The 3.4% upward revision tells you the bar was not engineered downward to make beats easy. The 23.6% growth figure is a harder number to dismiss, but it is also a harder hurdle to clear going forward. Guidance that merely holds growth steady rather than accelerating it can register as a disappointment to a market that has spent three months raising its expectations.
Four ways to approach the rest of reporting season without being whipsawed
The peak weeks of reporting season run from mid-July through late August 2026. The conditions established above, genuine earnings strength, elevated valuations, and a high revision bar, call for specific orientations rather than generic investment principles.
- Focus on quality and cash flow. In a high-bar environment, companies with consistent cash flow, conservative balance sheets, and credible forward guidance have the most room to navigate surprises. Earnings breadth across 10 of 11 sectors is a positive for diversified index investors, but index-level returns remain heavily influenced by a handful of mega-cap and AI-related names. Awareness of that concentration matters.
- Read upward revisions as a two-sided signal. Rising estimates confirm that business conditions improved through Q2, and that supports the earnings narrative. But those same revisions raised the hurdle. Results that merely meet the new, higher bar may not move prices the way they would have three months ago, because the “better-than-expected” story is already embedded in consensus.
- Do not overreact to individual report-day moves. With a forward P/E of 20.5x and expectations already elevated, day-to-day volatility around earnings reports is likely to be intense, particularly in crowded trades. The medium-term earnings trajectory, still projected to deliver mid-20s percentage growth for full-year 2026, matters more than the noise of any single quarterly result.
- Use the season for selective refinement, not wholesale change. Earnings season provides granular, forward-looking information on margins, capital expenditure, and demand trends. It is a good time to trim positions where valuation looks stretched relative to earnings quality and to add selectively where strong fundamentals are not yet fully reflected in price. Overhauling a portfolio based on short-term sentiment tends to capture the worst of volatility rather than the best of the information.
For investors wanting a structured framework to apply in the weeks ahead, our comprehensive walkthrough of earnings season hold and trim decisions covers predefined trigger thresholds, analyst-revision drift timing, and the after-tax cost of acting too quickly after a report.
What a historically strong earnings season leaves unresolved
The three threads in this earnings season are clear. The growth is real and broad. The revision story confirms it was not engineered. And the valuation context means the reward structure for investors is asymmetric.
None of that resolves the question the rest of reporting season will actually answer: whether corporate guidance for the second half of 2026 supports the mid-20s full-year profit growth forecast now embedded in consensus. That is the number the market has priced in, and it is the number forward guidance will either validate or undercut over the next six weeks.
The Q2 results themselves are strong. That much is settled. What remains open is whether the companies delivering those results can sustain the pace in an environment where the tolerance for negative surprises is thin.
The edge now comes less from chasing the headline growth rate and more from judging which companies and sectors can sustain that growth when the market has already priced in the good news and left little room for disappointment.
This article is for informational purposes only and should not be considered financial advice. Investors should conduct their own research and consult with financial professionals before making investment decisions. Past performance does not guarantee future results. Financial projections are subject to market conditions and various risk factors.