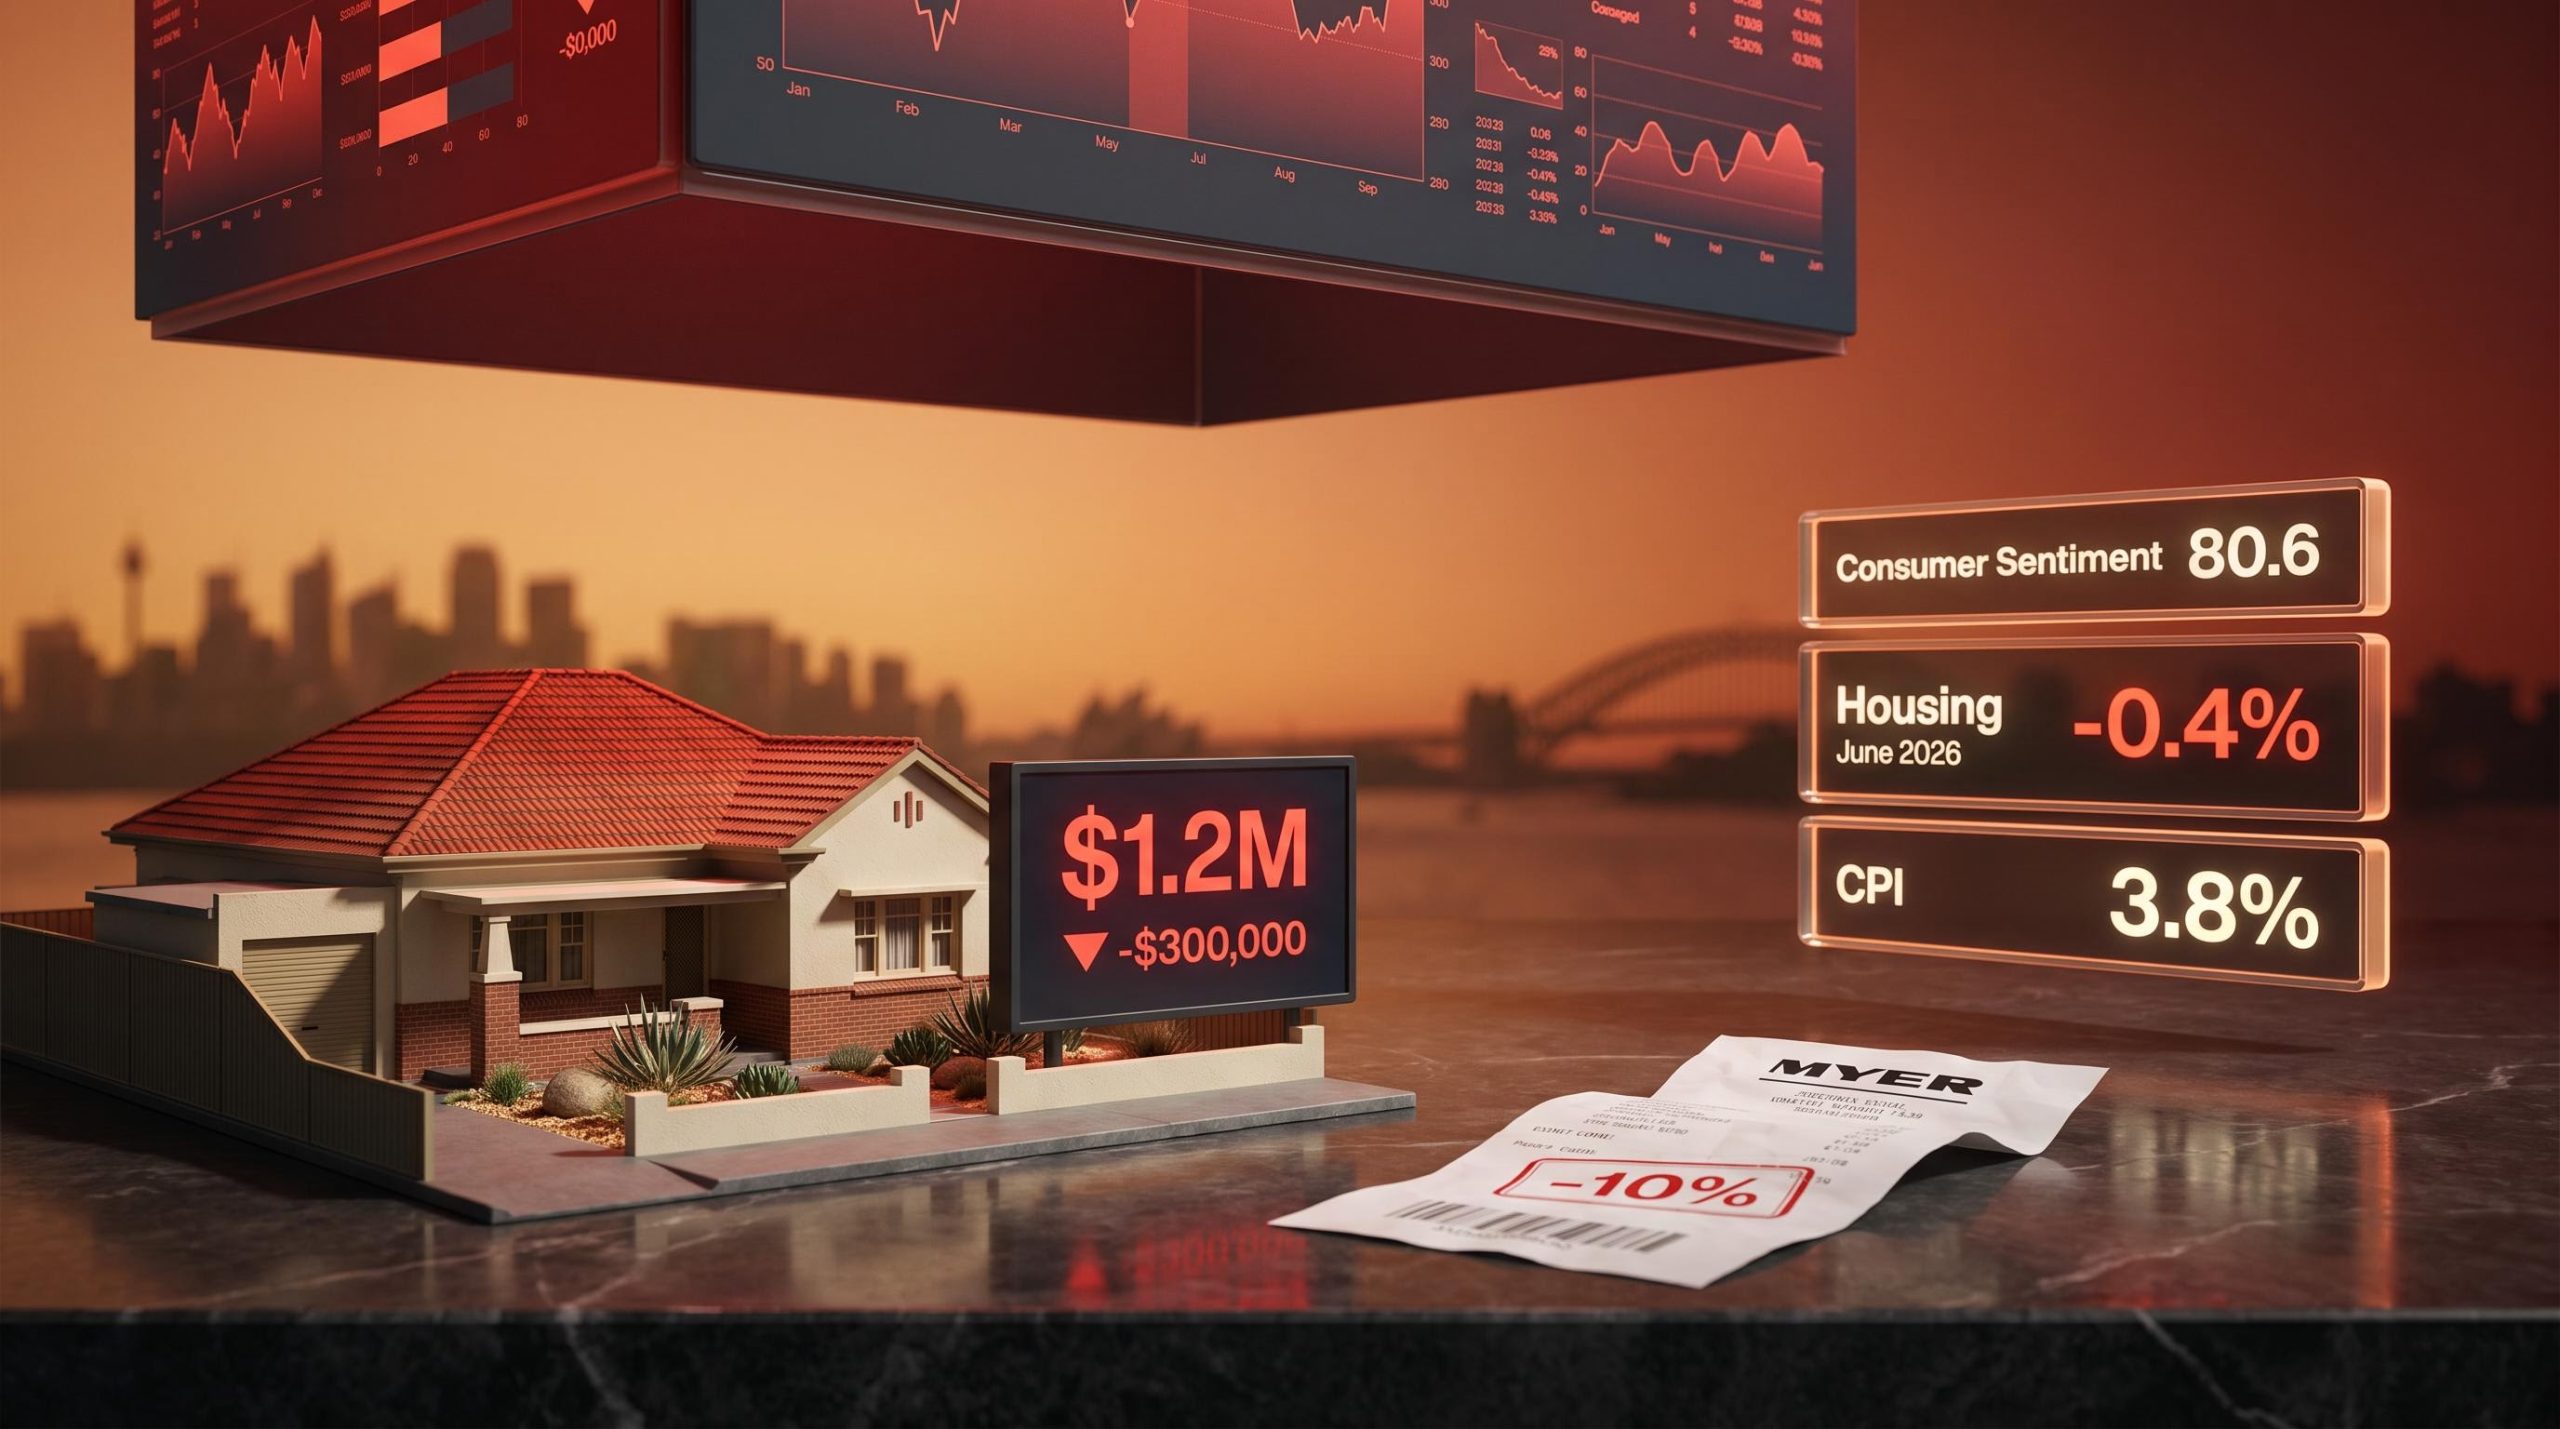
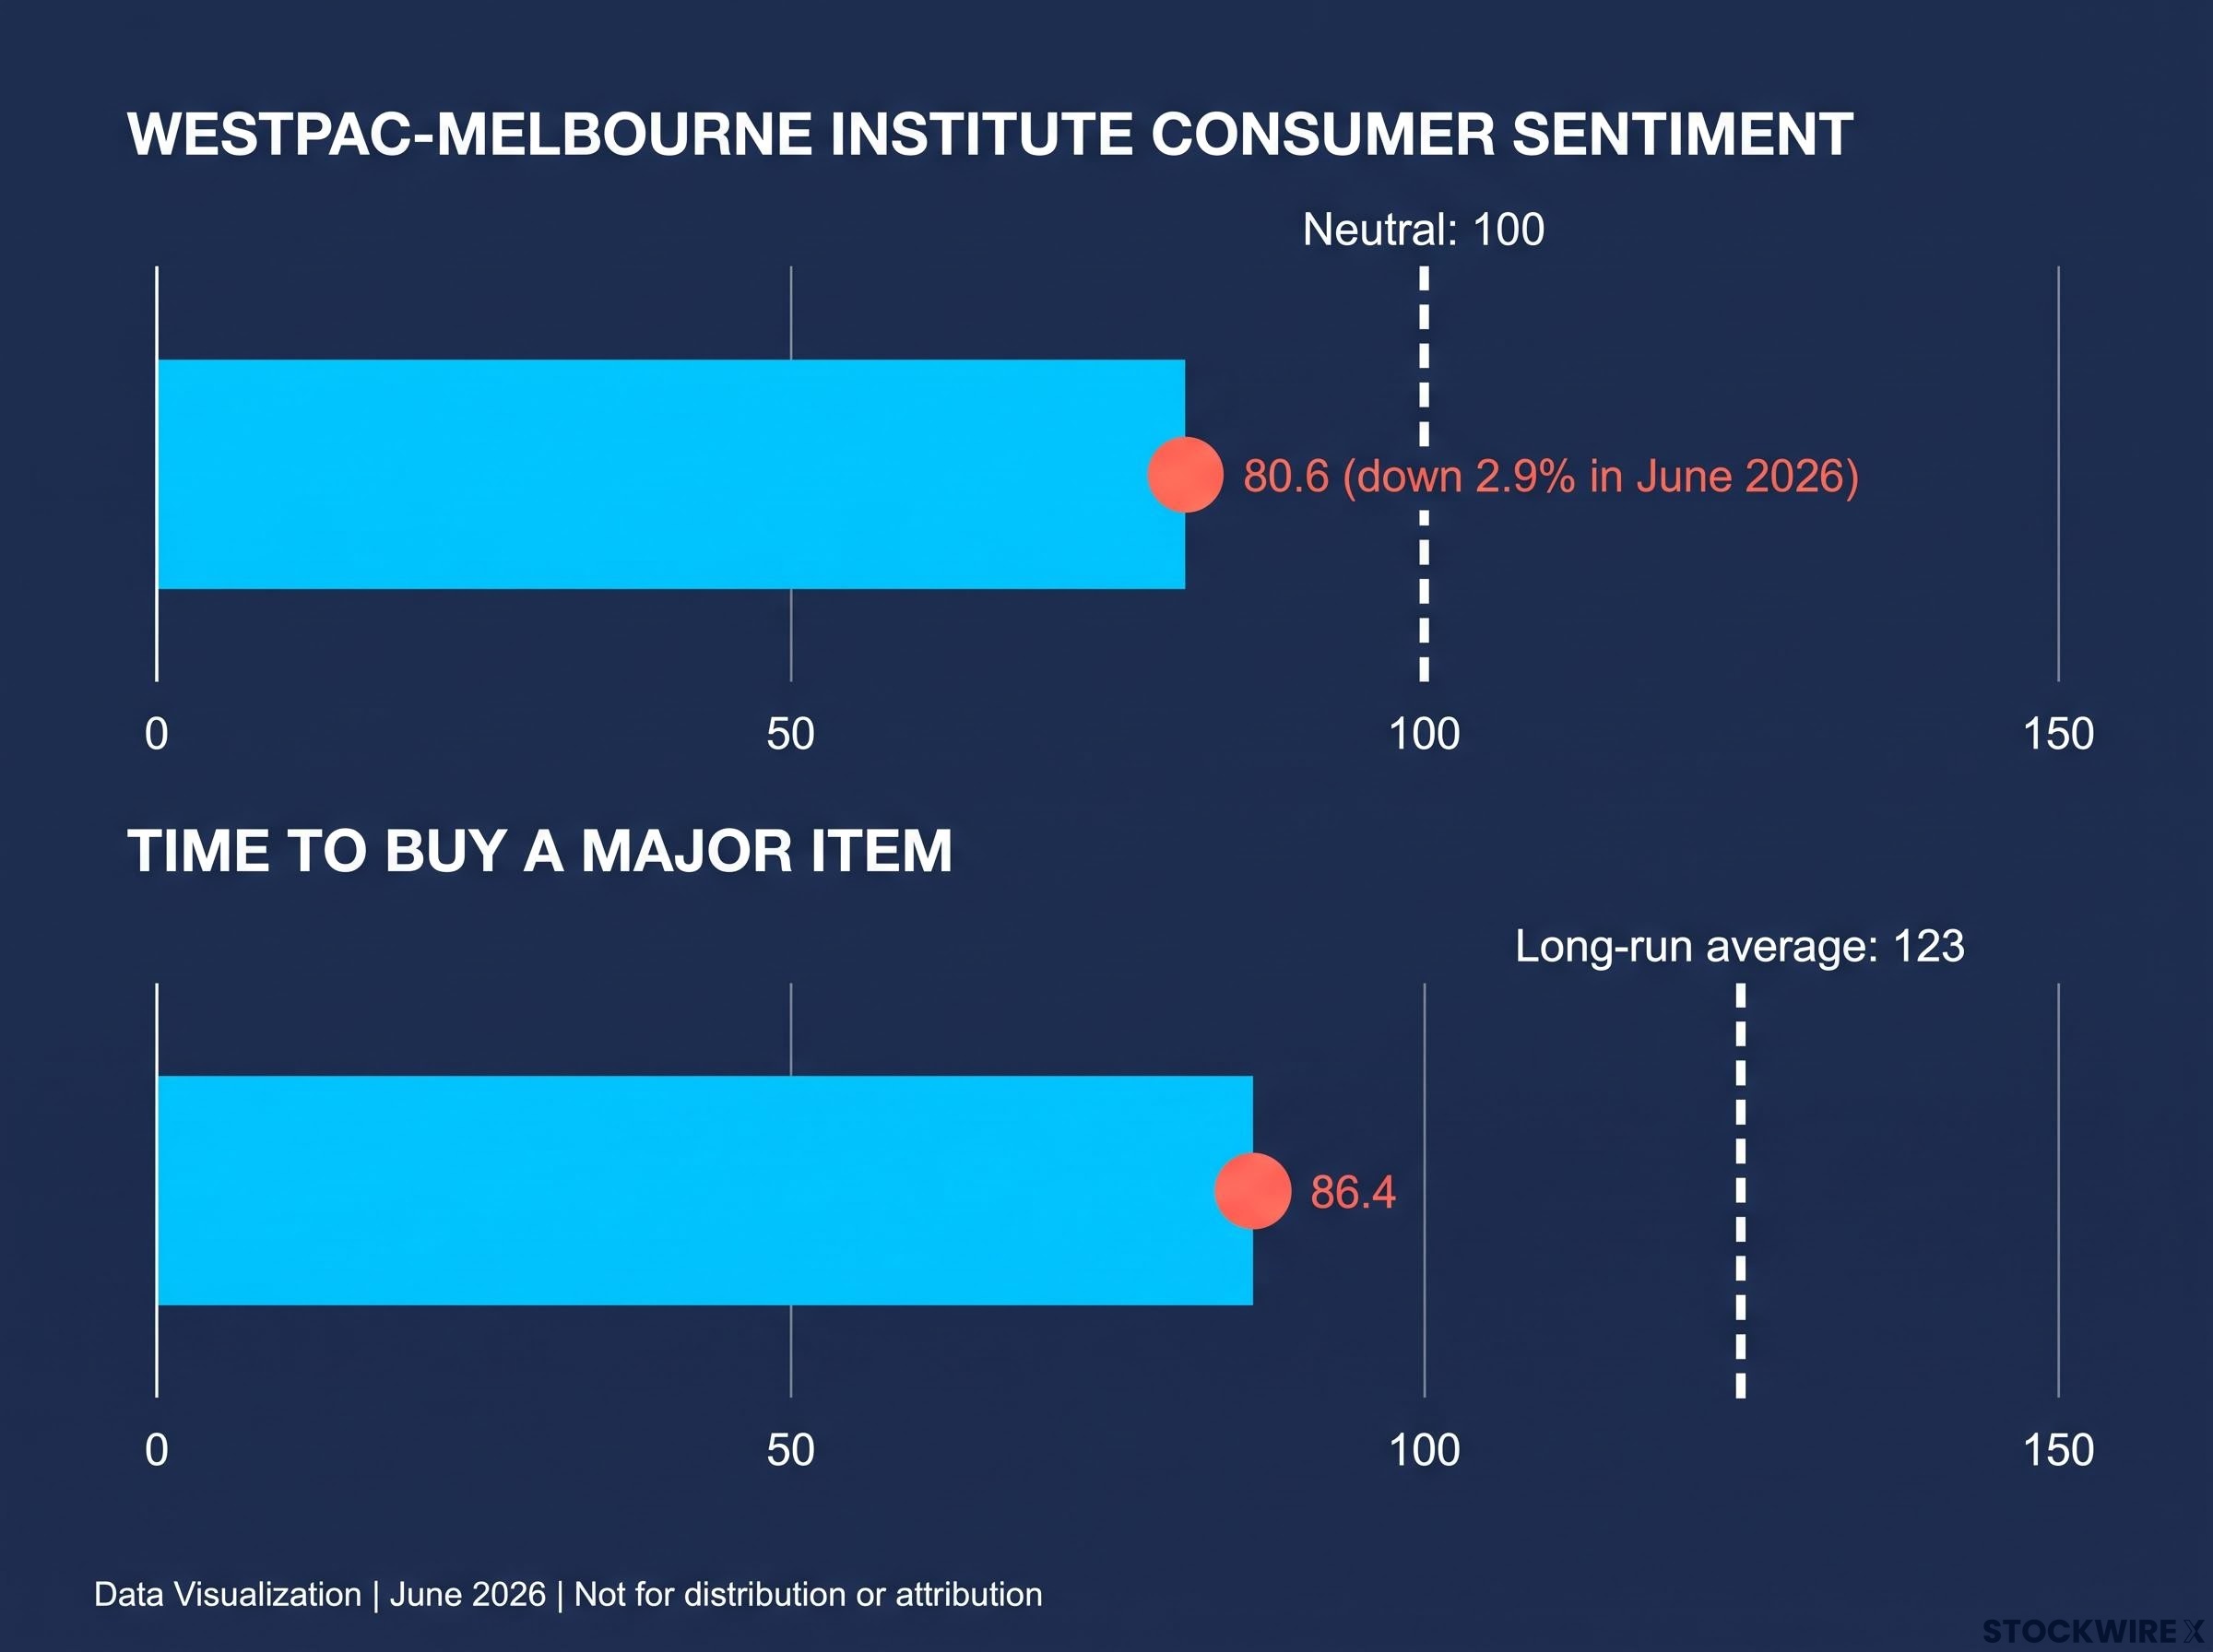
The consumer sentiment index reads 80.6. The long-run neutral is 100. The sub-index measuring willingness to buy a major item sits at 86.4 against a long-run average of 123. Australians are not spending, and the mechanism behind that reluctance is not found in their pay slips.
The driver is the balance sheet. Housing wealth has begun to shrink, and for a country where residential property constitutes the dominant store of household wealth, paper losses on a home translate quickly into real changes in how families approach discretionary spending. With the RBA still fighting inflation from above the target band and mortgage rates elevated after 75 basis points of hikes in 2026, the policy tools needed to arrest the slide are not yet available. The question is whether this combination of falling values, weak sentiment, and constrained monetary response is a soft patch or the opening of something more serious.
Here is the causal chain, mapped from the housing data now emerging through the spending evidence already appearing in retail earnings, to what this configuration means for investors with exposure to Australian consumer-facing sectors. The recession risk framing is the correct one to apply here: not because a downturn is certain, but because the transmission mechanism is already running.
The property numbers that started this
National dwelling prices fell 0.4% in June 2026, the largest monthly decline since December 2022. That single month extended the drawdown from the March 2026 peak to 0.9% nationally. In Sydney, the damage was sharper: prices dropped approximately 3.3% over the June quarter, the most visible capital-city expression of a trend that is now broadening rather than narrowing.
The confirming signals stack up quickly:
- National monthly decline of 0.4%, the steepest in three and a half years
- Peak-to-current drawdown of 0.9% from March 2026
- NAB home loan applications down 15% over the most recent three-month period (NAB’s own corporate data)
Reuters has characterised the current period as the worst housing slowdown since the pandemic, citing lower auction clearance rates, fewer buyers attending open homes, and a broader slump in property sales volumes.
The price data alone would tell a story of correction after a prolonged boom. What makes it harder to dismiss is the demand side.
When approvals sit idle
Across the residential construction pipeline, prospective builders and buyers who already hold valid financing and building approvals are choosing not to proceed. A premium builder recently noted that their pipeline had shrunk from roughly twelve months of committed work down to just a handful of weeks, even though many of their clients had financing in place and all the necessary approvals to proceed.
This is not a liquidity-constrained correction. Buyers who can proceed are electing not to. That distinction matters: a confidence-driven slowdown does not respond linearly to rate adjustments, which complicates the standard recovery playbook. When sentiment, not serviceability, is the binding constraint, calling the bottom becomes materially harder.
When big ASX news breaks, our subscribers know first
How a falling home value empties a shopping basket
The wealth effect is the transmission channel between a property price index and a shopping receipt. When housing wealth falls, consumption falls with it, particularly in discretionary categories, even where household income and mortgage repayments are unchanged. The mechanism is straightforward: roughly two-thirds of Australian households own their homes, residential property is the dominant asset on most household balance sheets, and automated valuation tools mean families see their paper losses in near real-time.
Research cited by Bloomberg estimates that a 1% rise in housing wealth lifts consumption by approximately 0.16% over the long run. The reverse applies when prices fall. That elasticity figure has not been independently confirmed, but the direction and the logic are consistent with Reserve Bank of Australia (RBA) research on housing and spending.
A concrete example makes the mechanism intuitive. Consider a home that was recently estimated at $1.5 million and is now valued at $1.2 million. Nothing about the household’s solvency has changed, and the mortgage schedule remains identical. Yet absorbing a $300,000 reduction in paper wealth reshapes how that family thinks about committing to a kitchen renovation, booking an overseas trip, or replacing the car.
Consumer sentiment fell to 80.6 in June 2026, far below the neutral level of 100.
| Sub-index | Current reading | Long-run average |
|---|---|---|
| Westpac-Melbourne Institute Consumer Sentiment | 80.6 (down 2.9%) | 100 |
| “Time to Buy a Major Item” | 86.4 | 123 |
The gap between the “Time to Buy a Major Item” sub-index and its long-run average is not a minor confidence wobble. It is a structural pullback in discretionary intent, and it tells you the wealth effect is already transmitting through the economy before the next round of retail earnings confirms it.
The consumer sentiment sub-indexes carry more diagnostic weight than the headline figure alone: the forward-looking measures for economic expectations over the next 12 months and five years both fell to their weakest combined reading since November 2022, a configuration that typically precedes the earnings deterioration now appearing in retail results.
Myer’s warning and what it tells investors about discretionary retail broadly
Myer provided the clearest earnings-level confirmation in June 2026. The department store’s share price fell approximately 10% after management warned of a consumer spending slump across June and July, explicitly citing housing market weakness as a contributing factor.
The severity of the miss makes the signal harder to dismiss. Following its acquisition of apparel brands from Premier Investments, Myer entered the period with an approximately 11% revenue tailwind that should have provided meaningful support to the trading result. Trading activity nonetheless came in materially short of what the business had planned for.
Three retail stress indicators emerged from the update:
- Share price decline of approximately 10% following the trading warning
- June and July sales significantly below internal expectations despite the revenue tailwind
- Widespread promotional discounting required to move inventory, compressing margins
When a retailer with 11% revenue tailwinds still misses internal expectations badly enough to warn the market, the underlying demand environment is doing substantial negative work. That tells you this is not a Myer execution failure.
A sector-level read, not just one company’s problem
The conditions Myer reported, falling foot traffic, heavy discounting to clear stock, housing-linked sentiment drag, are structural across sales-driven discretionary retail formats. Department stores, homewares retailers, and apparel chains all depend on households feeling confident enough to spend on things they want rather than things they need.
Margin compression from promotional intensity is a sector-wide dynamic. Full-price demand for discretionary items has weakened, and retailers are now competing on price rather than product. For investors holding positions in consumer discretionary names, Myer is the diagnostic instrument, not the disease.
JB Hi-Fi’s FY26 Q3 result offered a more nuanced read on the ASX discretionary sector than the Myer warning alone: comparable sales remained mildly positive, but the result was carried by online channels and value-seeking reallocation rather than broad-based consumer confidence, which means stock selection within the sector matters more than a wholesale rotation call.
Why the RBA cannot simply cut its way out of this
The standard monetary policy response to a housing-led consumer slowdown is rate cuts. The RBA does not have that option.
Annual headline CPI printed at 3.8% through to June 2026, coming in under the 4.0% forecast but remaining outside the 2-3% target band. The underlying measure held at 3.6%, with housing and food identified as the dominant contributors to stickiness. Among developed economies, Australia’s core inflation rate is one of the most elevated.
The RBA’s May 2026 Statement on Monetary Policy confirmed the Board’s decision to raise the cash rate to 4.35% and assessed that inflation would remain above the 2-3% target band for an extended period, citing higher fuel prices and mortgage costs as direct drags on household spending capacity.
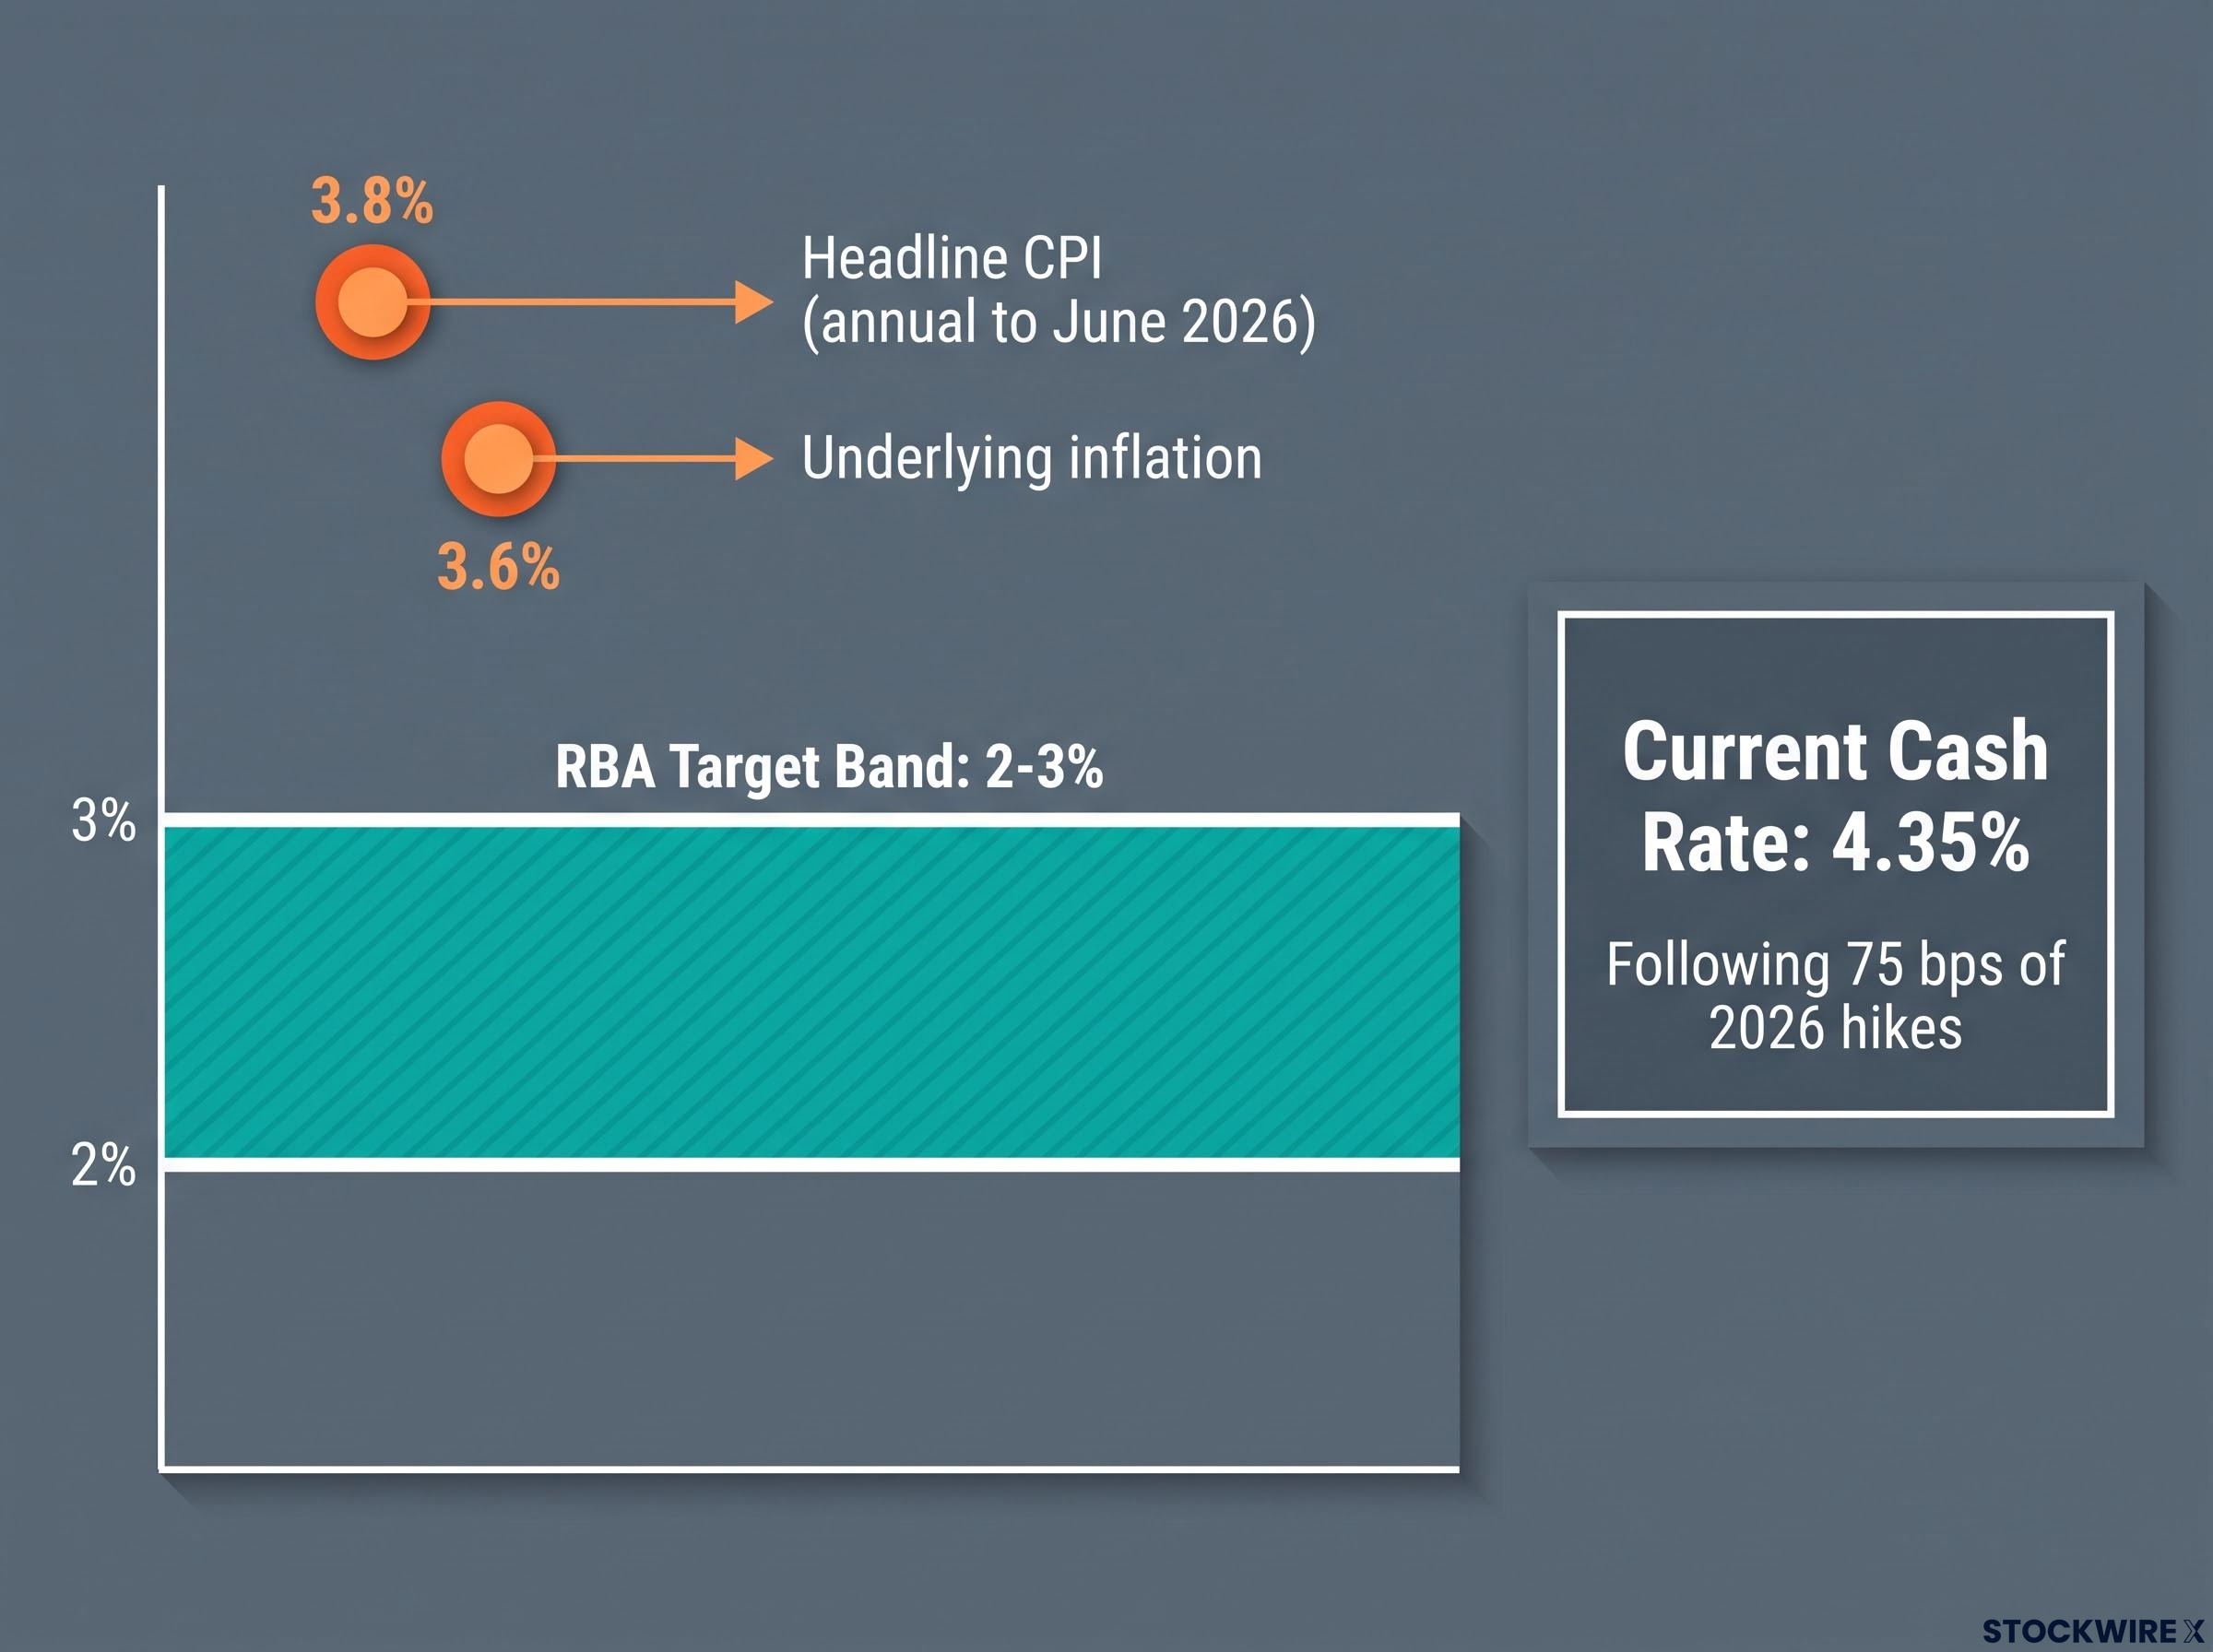
Australian core inflation remains among the highest in the developed world, constraining the RBA’s scope for easing even as housing and consumer data weaken.
| Indicator | Current reading | RBA target / neutral |
|---|---|---|
| Cash rate | 4.35% | N/A (following 75 bps of 2026 hikes) |
| Headline CPI (annual) | 3.8% | 2-3% |
| Underlying inflation | 3.6% | 2-3% |
The dilemma is genuine, not a communication failure. The same 75 basis points of rate rises implemented to fight inflation in 2026 are now contributing directly to the housing weakness and consumer confidence decline that is dragging on growth. Market pricing at the time of writing pointed to roughly one additional hike priced in by December 2026, with August expected to be a hold. Rate relief is not the near-term base case.
The structural problem deepens the bind. Many of the inflation pressures the RBA is fighting are supply-side and imported: global fuel costs, supply chain disruptions, and administered price increases. Higher rates fall disproportionately on indebted and lower-income households without addressing those primary sources of price pressure. The Treasurer has confirmed that the fuel excise relief measure will not be renewed, which will push fuel costs higher once it lapses and add further pressure to both CPI readings and household budgets.
For investors, the read is direct: rate cuts are not a near-term circuit-breaker for housing or consumer sentiment. Any further deterioration in property prices or retail spending will have to be absorbed by earnings rather than offset by central bank easing.
Recession risk: probability, not inevitability
Commonwealth Bank expects GDP growth to slow from approximately 2.5% at end-2025 to approximately 1.5% by end-2026, reflecting the combined drag from rate hikes and tax changes flowing through housing and household spending. That is a material slowdown, but it is still positive growth in the baseline forecast.
Australia’s aggregate GDP figure obscures a per capita recession that has been running beneath the surface: total output continues to expand on the back of population growth, but real output per person has barely moved, a distinction that matters when assessing the true severity of the spending contraction now visible in retail earnings.
What converts a slowdown into a recession is the amplification channel. The wealth effect, if price declines deepen beyond the current single-digit range nationally, compounds through consumer sentiment into employment expectations and income confidence. That is the non-linear risk.
Risk amplifiers:
- Wealth effect deepening if housing declines extend well beyond single digits
- Additional rate hikes if inflation proves sticky above target
- A negative external shock (global recession, commodity price disruption, geopolitical escalation)
Risk stabilisers:
- Labour market remains relatively tight with no systemic stress in current data
- Banking system appears sound with no evidence of large-scale arrears problems
- GDP growth forecast remains positive, not negative, in the baseline
The honest read is that recession is the tail risk, not the base case, but the tail is fatter than it was twelve months ago. The conditions that would thicken it further, deeper price falls, another hike, an external shock, are all live possibilities rather than hypothetical scenarios. Investors who treat recession as inevitable will exit prematurely from positions that remain viable. Those who dismiss it entirely will be caught in sectors with non-linear earnings risk if the tail materialises.
The calibration matters: the evidence supports a defensive tilt, not a full retreat.
Where to position in an economy running at low tide
The causal chain runs from housing wealth to consumer sentiment to discretionary spending to retail earnings to GDP risk. Investors who understand which sectors sit in the path of that transmission can position before earnings warnings arrive rather than after.
Discretionary retail carries the most immediate earnings risk. Persistent discounting, margin compression, and housing-linked sentiment drag make this the highest-risk category for near-term earnings surprises. Myer is the live example, not the exception. Residential construction and building materials represent the second-order housing risk: falling approvals, lower commencements, and the behavioural demand freeze among approved-but-paused buyers will weigh on forward order books.
Banks: income without ignoring the volume risk
At the time of writing, NAB shares were changing hands around $41, a meaningful retreat from the roughly $48 peak reached in January. The unfranked dividend yield is approximately 4%, which grosses up to around 5-5.5% once franking credits are included, giving income-focused holders a degree of return support.
But slower housing credit growth and weaker mortgage demand are volume headwinds. The absence of systemic arrears stress means the dividend is supported for now; further housing deterioration is the key risk to watch. Banks are fundamentally sound, not fundamentally cheap.
| Sector | Outlook | Key risk | Key consideration |
|---|---|---|---|
| Discretionary retail | Weak | Margin compression from promotional discounting | Housing sentiment drag has already reached earnings (Myer warning) |
| Residential construction / materials | Weak | Demand freeze among approved-but-paused buyers | Forward order book collapse already reported by premium builders |
| Banks | Mixed | Slower housing credit growth and mortgage demand | Dividend yield (~5-5.5% franked) supported while arrears remain low |
| Defensives / essentials | Relatively better-placed | Input cost inflation (fuel, wages) | Revenue tied to what households must spend, not what they choose to spend |
In a wealth-effect-driven slowdown, the most important positioning move is reducing exposure to sectors where revenue depends on households feeling richer than they currently do, and increasing weight in sectors where revenue is tied to what households must spend regardless of sentiment. Utilities, essential retail, and healthcare offer more predictable earnings in a low-confidence environment.
Defensive positioning in stagflation differs from the playbook that worked during the GFC or COVID corrections: bonds face simultaneous pressure from elevated rates, and the assets that held value were floating-rate instruments and cash equivalents rather than traditional duration-heavy hedges.
What the data tells investors to do before the next shoe drops
The causal chain is assembled: housing wealth falls, consumer sentiment contracts, discretionary spending weakens, retail earnings warn, the RBA cannot cut because inflation remains above target, and GDP growth slows to a level where any further shock raises the probability of a technical recession.
The base case remains a slow patch rather than a confirmed downturn. But the evidence already supports a defensive tilt rather than waiting for confirmation. Reducing exposure to discretionary spending and housing-linked sectors while building weight in defensives and income-generating holdings with lower sensitivity to consumer confidence is the positioning response this data supports.
The key variable to monitor is the depth of price declines relative to the current single-digit national figure. If falls deepen materially from here, the probability assessment changes and the positioning response becomes more urgent. The monthly CoreLogic dwelling price data and the next RBA rate decision are the two most immediate leading indicators.
This article is for informational purposes only and should not be considered financial advice. Investors should conduct their own research and consult with financial professionals before making investment decisions. Past performance does not guarantee future results. Financial projections are subject to market conditions and various risk factors.