You know the moment. A headline lands in your feed, you pull up the chart, and the asset has already run. Twenty percent, fifty percent, sometimes more. Now you are standing at the decision point every retail trader knows intimately: are you catching the next leg up, or are you about to become the exit liquidity for someone who bought in six months ago?
That question sits at the centre of the retail trader trap, and the data on how it usually resolves is not comfortable. Retail traders now account for roughly 18% to 25% of U.S. equity volume by standard measures, with peaks near 36% during volatile stretches of 2025, according to JPMorgan analysis. Yet the average retail equity investor has trailed the S&P 500 for 15 consecutive years in Dalbar’s series. In 2024 alone, that gap reached 8.48 percentage points.
The infrastructure pulling everyday investors into markets has never been more accessible. The performance record has rarely looked worse.
After reading this, you will recognise the specific sequence of events that tends to precede a late retail entry, understand why that sequence exists and who profits from it, and hold a practical mental shift you can apply before the next hype cycle reaches for you. This is about claiming a structural advantage, not absorbing another warning.
What the money spot illusion actually is (and why it feels so convincing)
Think back to the last time you entered a trade that felt obvious. The asset had proven itself. It dipped, then recovered, and that recovery read as permission. Your conviction was high. That feeling, the sense that the evidence was finally clear enough to act on, is precisely the trap.
Navin Prithyani, founder of Urban Forex, calls this the “money spot illusion.” It is the cognitive error where a visible, media-covered rally gets treated as confirmation that an asset is worth entering. In reality, that visibility is evidence that informed participants have already entered. You are not seeing an opportunity forming. You are seeing the aftermath of one that has largely closed.
The attention economy accelerates the whole thing. News coverage naturally gravitates toward assets already in motion, which creates a self-reinforcing loop:
The psychology of investing adds a measurable cost on top of every structural friction already working against retail traders: Barber and Odean’s research attributed a 6.5-percentage-point annual underperformance gap almost entirely to transaction costs and behavioural overreaction rather than poor stock selection.
- The asset moves, generating price action worth reporting
- Media covers the move, treating recent highs as the reference point
- Retail capital enters, drawn by coverage of gains that have already happened
By the time a story is fully formed enough to reach you through mainstream channels, the early positioning is done. Bitcoin cycles are the cleanest example. Each cycle produces its wave of headline coverage close to the price peak, drawing retail volume in precisely when institutional accumulation has mostly concluded.
The behavioral wiring that makes late entries feel rational
Two mental habits do the heavy lifting here. Overconfidence bias convinces you that your read on the situation is sharper than it is. Recency bias then persuades you that recent price appreciation is forward-looking evidence rather than a record of what has already occurred.
The result is a systematic misjudgement. At the point of entry, you consistently underestimate the gap between what the market has already delivered and what you are expecting it to deliver next. Behavioral economist Richard Thaler has documented how present bias and loss aversion distort these decisions, while researchers Brad Barber and Terrance Odean have shown how overconfidence pushes traders to extrapolate recent returns into the future.
Investors who chase strong recent performance and sell during drawdowns leave a substantial portion of available returns on the table. Dalbar’s long-horizon work suggests average investors forfeit close to a third of their potential returns through this timing behaviour, directional evidence of how costly extrapolating recent gains can be.
Here is the uncomfortable read. The conviction you feel when entering a hyped trade is not proof of sound judgement. It is often the most reliable signal that the conditions for a late-stage entry have already been met.
When big ASX news breaks, our subscribers know first
How institutional players use retail FOMO to manage their own inventory
From the outside, this looks like exploitation. From the institutional desk, it is routine inventory management conducted against a predictable counterparty. Walking through the sequence makes the difference clear.
It begins with accumulation. When retail volumes surge, as they did near the 36% peak in 2025 U.S. equity trading, institutions and high-frequency trading firms use that abundant liquidity to work large orders through fragmented markets with minimal price impact. Heavy retail participation is exactly the cover a large buyer wants, because it lets size move quietly.
Then comes distribution. By the time a narrative is fully established in the media and retail volumes peak, institutional accumulation has largely wrapped up. The same players now distribute inventory into strong retail buying, selling into the demand the headlines created.
The final stage is the one that stings. Once retail participants are concentrated on the long side, adverse news or a sharp engineered price drop can trigger margin calls, forcing retail to sell. That capitulation frees up supply, letting institutional buyers re-enter at lower prices.
| Phase | Retail condition | Institutional action | Outcome for retail |
|---|---|---|---|
| Accumulation | Low awareness, coverage building | Work large orders quietly into rising volume | Absent or entering early positions |
| Distribution | Peak FOMO, heavy long positioning | Sell inventory into retail demand, then trigger forced selling | Buys the top, then capitulates on the drop |
This is not a fringe interaction. High-frequency trading firms account for an estimated 50% to 60% of U.S. equity trading volume, which means your order flow interacts primarily with sophisticated, speed-advantaged counterparties. And the liquidity pool is deep: Cboe data shows retail-attested average daily volume on its EDGX exchange rose 47.3% year-over-year in 2025, with retail representing 30.4% of all EDGX volume.
High-frequency trading firms build their edge on exactly the conditions retail FOMO creates: elevated intraday volume, widening bid-ask spreads, and predictable order flow from participants entering at emotionally driven moments rather than structurally informed ones.
The 2021 meme-stock episodes involving GameStop and AMC show the dynamic is not absolute. Concentrated, coordinated retail activity temporarily overwhelmed conventional risk models, forcing hedge funds to cover short positions at heavy losses. It is the exception that proves the rule.
The read you should take from this is direct. Your entry into a hyped trade is not incidental to the institutional trade. In many cases, it is the exact event the institutional trade was structured to anticipate.
What the performance data actually shows across markets and time
The case builds one dataset at a time. Start with equities. Dalbar’s series shows the average retail investor has trailed the S&P 500 for 15 consecutive years, with the 2024 shortfall of 8.48 percentage points ranking as the second-largest gap of the past decade. That is not a single bad year. It is a documented, persistent pattern.
Move to derivatives, and a regulator in another jurisdiction tells the same story. Data from the Securities and Exchange Board of India (SEBI) found that roughly 93% of individual traders in India’s derivatives market lost money between FY22 and FY24, with aggregate losses exceeding 1.8 lakh crore rupees. Different market, different rules, same outcome.
Academic studies sharpen the picture further.
| Market context | Data source | Performance gap | Time period |
|---|---|---|---|
| U.S. equity investors | Dalbar | 8.48 points below S&P 500 | 2024 |
| Indian derivatives traders | SEBI | ~93% incurred losses | FY22-FY24 |
| Separately managed accounts | University of Augsburg | -1.64% net alpha per year | Study period |
A University of Augsburg study reported that pure retail separately managed accounts underperformed by 1.64% per year in Vanguard net alpha and 2.58% per year in Carhart alpha, while institutional accounts generated positive net alpha of 0.79% (figures noted as unverified, treated here as directional). A Singapore Management University options study found that “simple strategy” retail traders posted a mean daily return of negative 0.068 and a Sharpe ratio of negative 0.174, an illustration of how sharply the derivatives gap can bite.
The structural odds against retail traders extend well beyond behavioral timing: ESMA data confirms over 70% of retail CFD and leveraged product accounts incur net losses, and the margin mechanism removes the one genuine advantage retail participants hold, the freedom to wait out a drawdown without forced selling.
Now the finding that reframes everything. A 2023 paper in the Journal of Financial and Quantitative Analysis showed that retail order imbalance positively predicts short-term returns. Retail traders are often directionally correct, yet they still lose. Long-short strategies built on extreme retail order imbalance earned annualised returns of negative 14.8% among heavily retail-traded stocks versus 6.6% among others.
Retail traders are frequently right about direction and still unprofitable. Transaction costs, bid-ask spreads, and behavioral timing convert reasonable intuitions into negative net outcomes.
That distinction matters for you personally. The gap is not primarily a story about retail traders being unintelligent. It is a story about structural frictions, costs, timing and leverage, turning sound instincts into losses. Which means the fix is structural, not analytical.
Reframing your position in the market before the next cycle arrives
If the problem is structural, so is the solution. The goal is not to become better at spotting trends. It is to stop being the liquidity that trend-following institutions require. That means shifting from reactive, headline-driven entries to a process you commit to before the emotion arrives.
These practices are not a checklist to memorise. They are one coherent philosophy: remove the discretionary, emotional entry decision that the money spot illusion is designed to exploit.
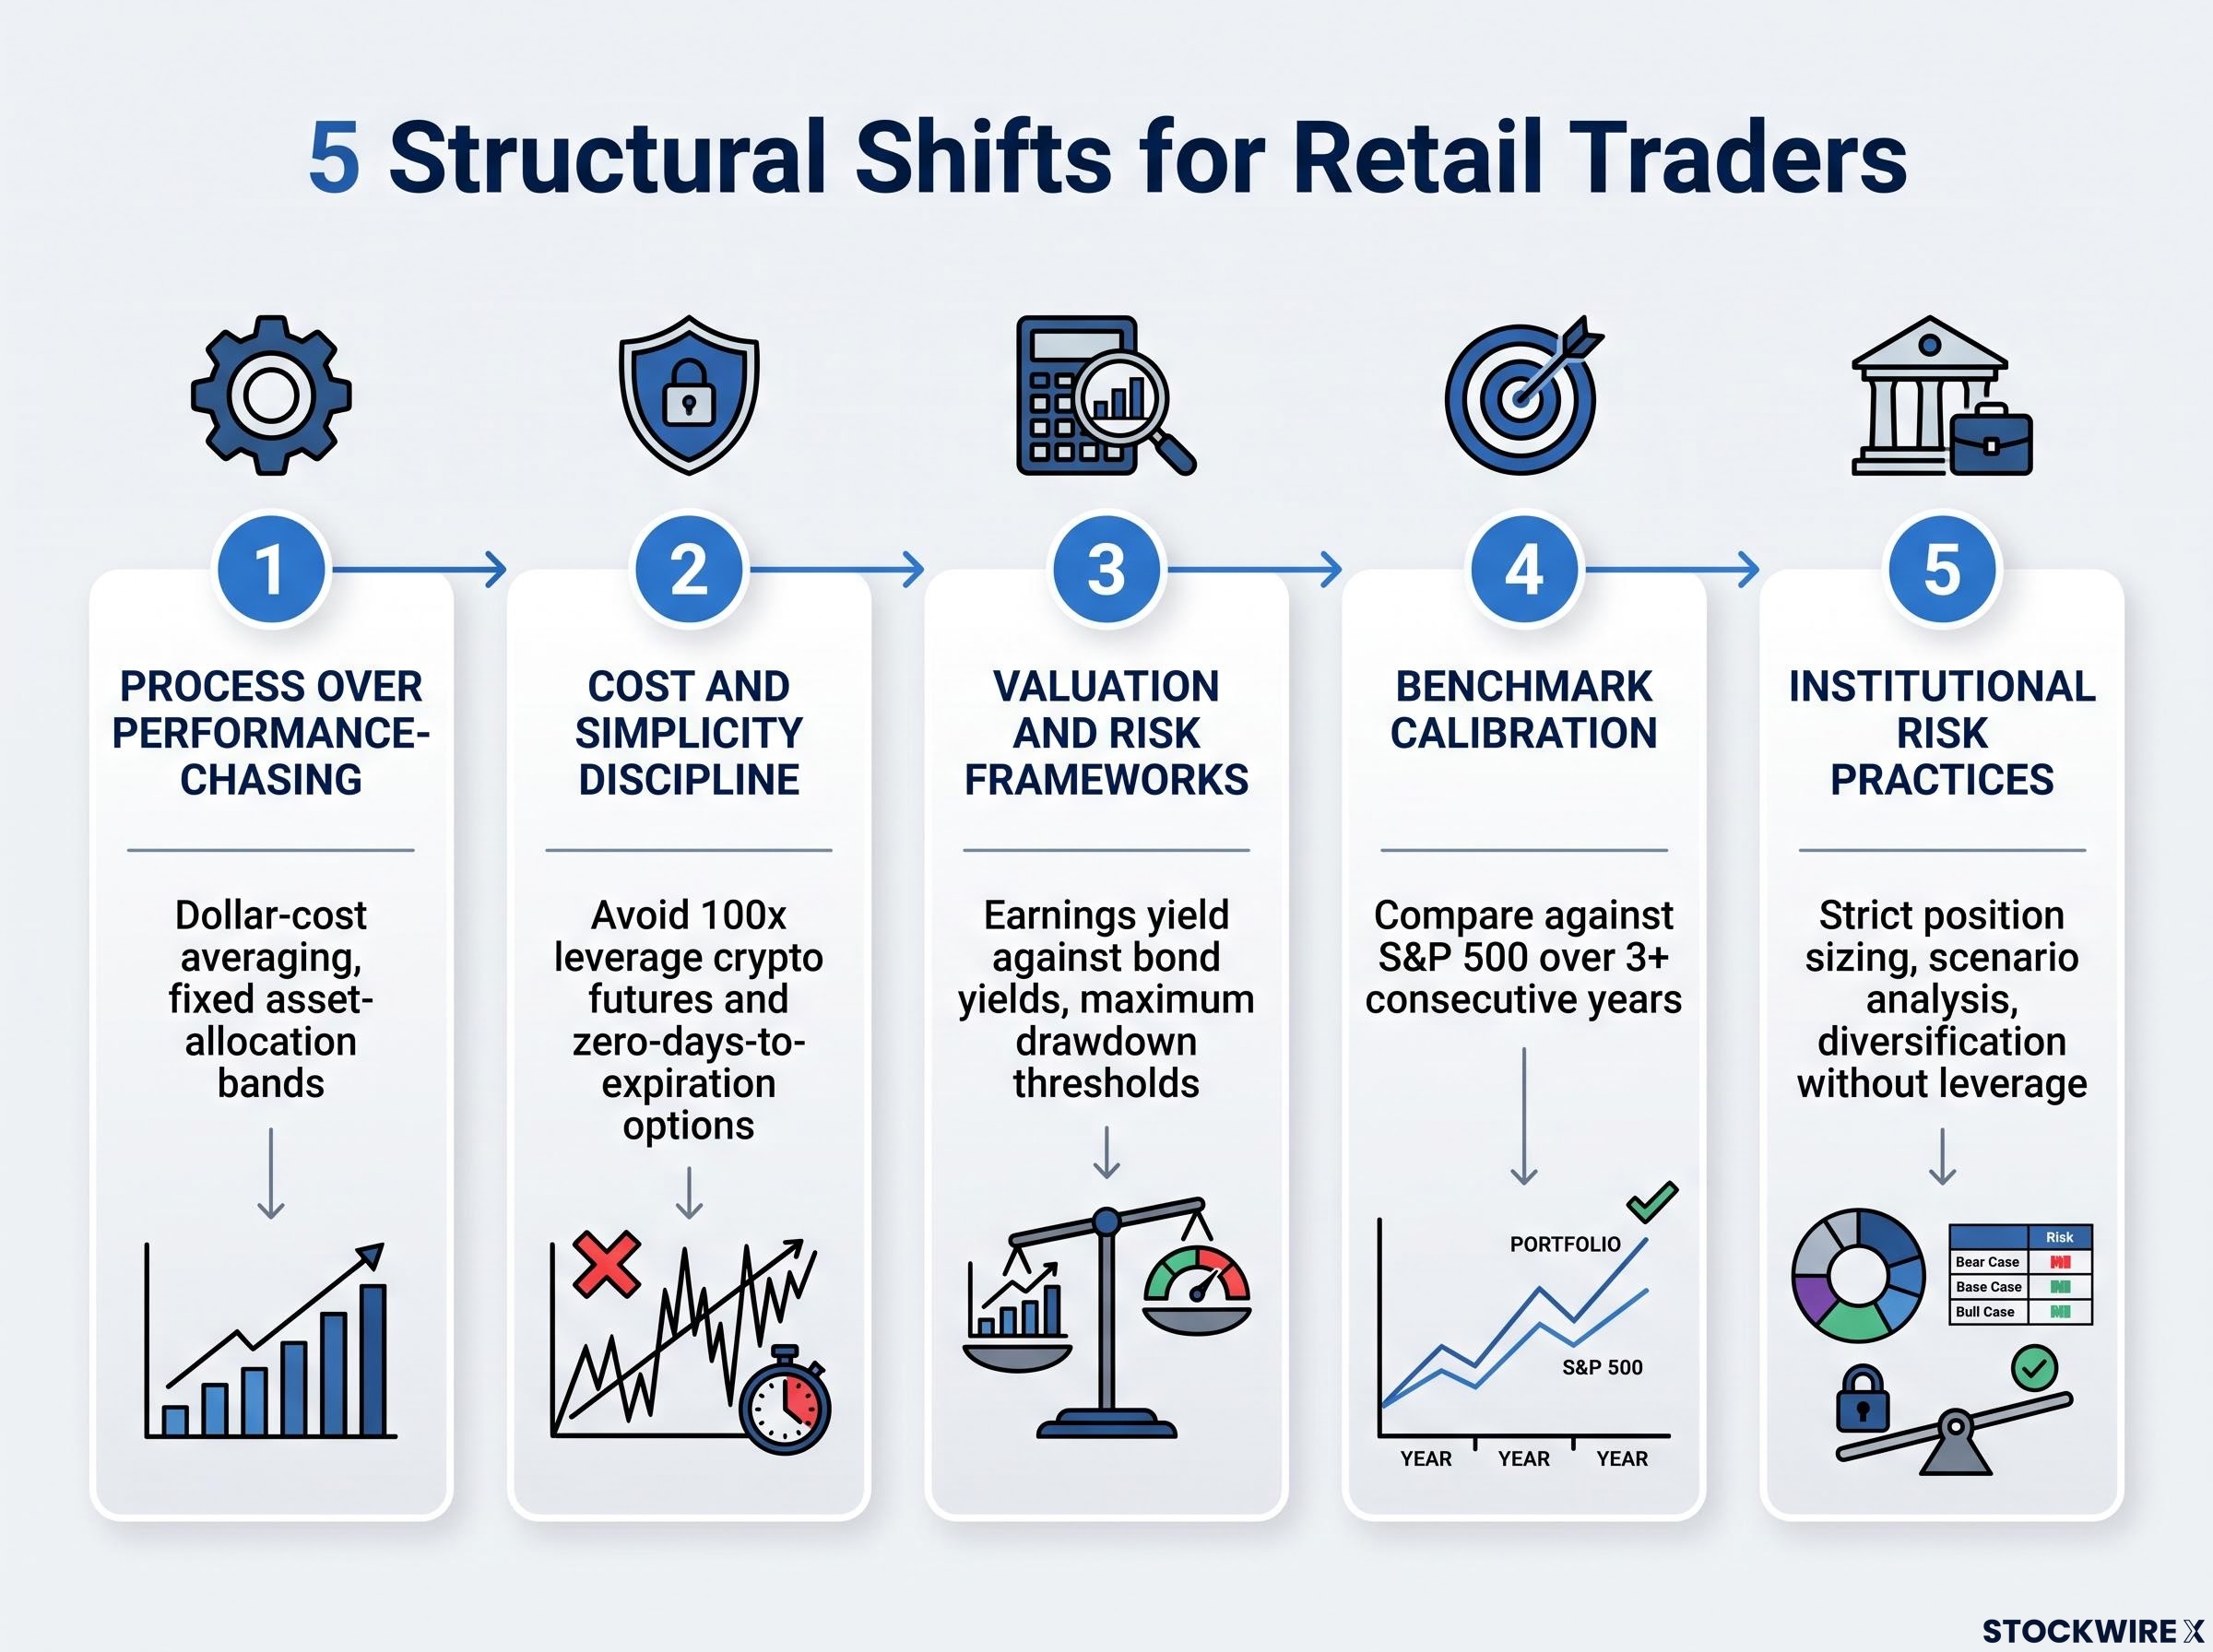
Five structural shifts that change your role in the market
- Process over performance-chasing. Adopt rules-based strategies like dollar-cost averaging and fixed asset-allocation bands. These remove the entry-timing decision from the emotional loop, which is exactly the decision the illusion targets.
- Cost and simplicity discipline. Avoid frequent trading in high-spread names and steer clear of leveraged products such as crypto perpetual futures offering 100x leverage or zero-days-to-expiration options. Low-cost index funds sidestep the frictions that quietly erode retail returns.
- Valuation and risk frameworks. Replace narrative-driven entries with simple valuation checks, such as earnings yield against bond yields, and hard risk limits like maximum drawdown thresholds. Pre-trade checklists and cooling-off periods directly counter the money spot illusion.
- Benchmark calibration. Compare your results against a relevant benchmark. If active trading has trailed the S&P 500 for three or more consecutive years, the evidence base for continuing is negative, and passive or semi-passive strategies become the structurally rational default.
- Institutional risk practices without the complexity. Borrow the parts that work, strict position sizing, scenario analysis, diversification, without the over-leveraged models that lead to forced liquidations. Avoiding leverage removes the forced-selling vulnerability institutions exploit during adverse news.
The asymmetry is worth holding onto. The meme-stock episodes show retail can disrupt institutional positions when acting in concert and with timing. Outside those rare moments, the structural edge belongs to the counterparty with lower costs, faster execution, and no emotional decision loop.
Adopting these practices does not mean leaving markets. It means changing which role you play in the cycle, moving from the predictable late-entry counterparty to a participant whose behaviour is far harder to anticipate and exploit.
This article is for informational purposes only and should not be considered financial advice. Investors should conduct their own research and consult with financial professionals before making investment decisions. Past performance does not guarantee future results.
The cycle will repeat. The only variable is which side of it you are on.
The media-driven FOMO cycle is not a flaw in financial markets. It is a structural feature that persists because it serves institutional inventory management, and it will keep recurring across asset classes and hype cycles.
The retail trader trap is not a trap for everyone in markets. It is specifically a trap for participants who enter reactively, without a pre-committed process, and without awareness of where they sit in the institutional cycle.
The data offers genuine grounds for confidence, not defeat. Retail order imbalance predicts short-term returns. Meme-stock episodes proved retail can move institutional positions. Low-cost systematic retail strategies hold up. Retail traders are not inherently disadvantaged. They are disadvantaged when they behave in the predictable, emotionally driven pattern the illusion is built to trigger.
So the next time a headline creates that familiar pull toward an already-moving asset, you now have a lens for what that moment actually is, and a set of practices for meeting it differently. The cycle arrives regardless. Which side you stand on is the part you control.
For readers ready to build a portfolio around the structural case presented here, our dedicated guide to active vs passive investing covers the cost arithmetic, tax-efficiency advantages, and core-satellite portfolio construction that translate the evidence into a concrete allocation decision.