Why Flight Centre’s Share Price Rose on an Earnings Downgrade
3 hrs ago
Most investors scan a JB Hi-Fi quarterly update for the headline sales number, form a view on the stock, and move on. That is the least valuable way to use it. JB Hi-Fi’s FY26 third-quarter result is one of the earliest real-economy reads on Australian household spending that arrives before the ABS publishes official data, which means the result carries positioning implications well beyond a single company’s share price. The tension right now is specific: official ABS discretionary spending data shows softness, yet a major electronics and home goods retailer is posting positive comparable sales growth. Those two data points are not contradicting each other. They are describing different layers of the same consumer dynamic, and understanding which layer matters more is what drives positioning decisions across ASX discretionary stocks. What follows breaks down the composition of the result, explains why transaction data outweighs sentiment surveys, maps the read-through to specific subsectors, and delivers a portfolio posture calibrated to what mid-2026 data actually supports.
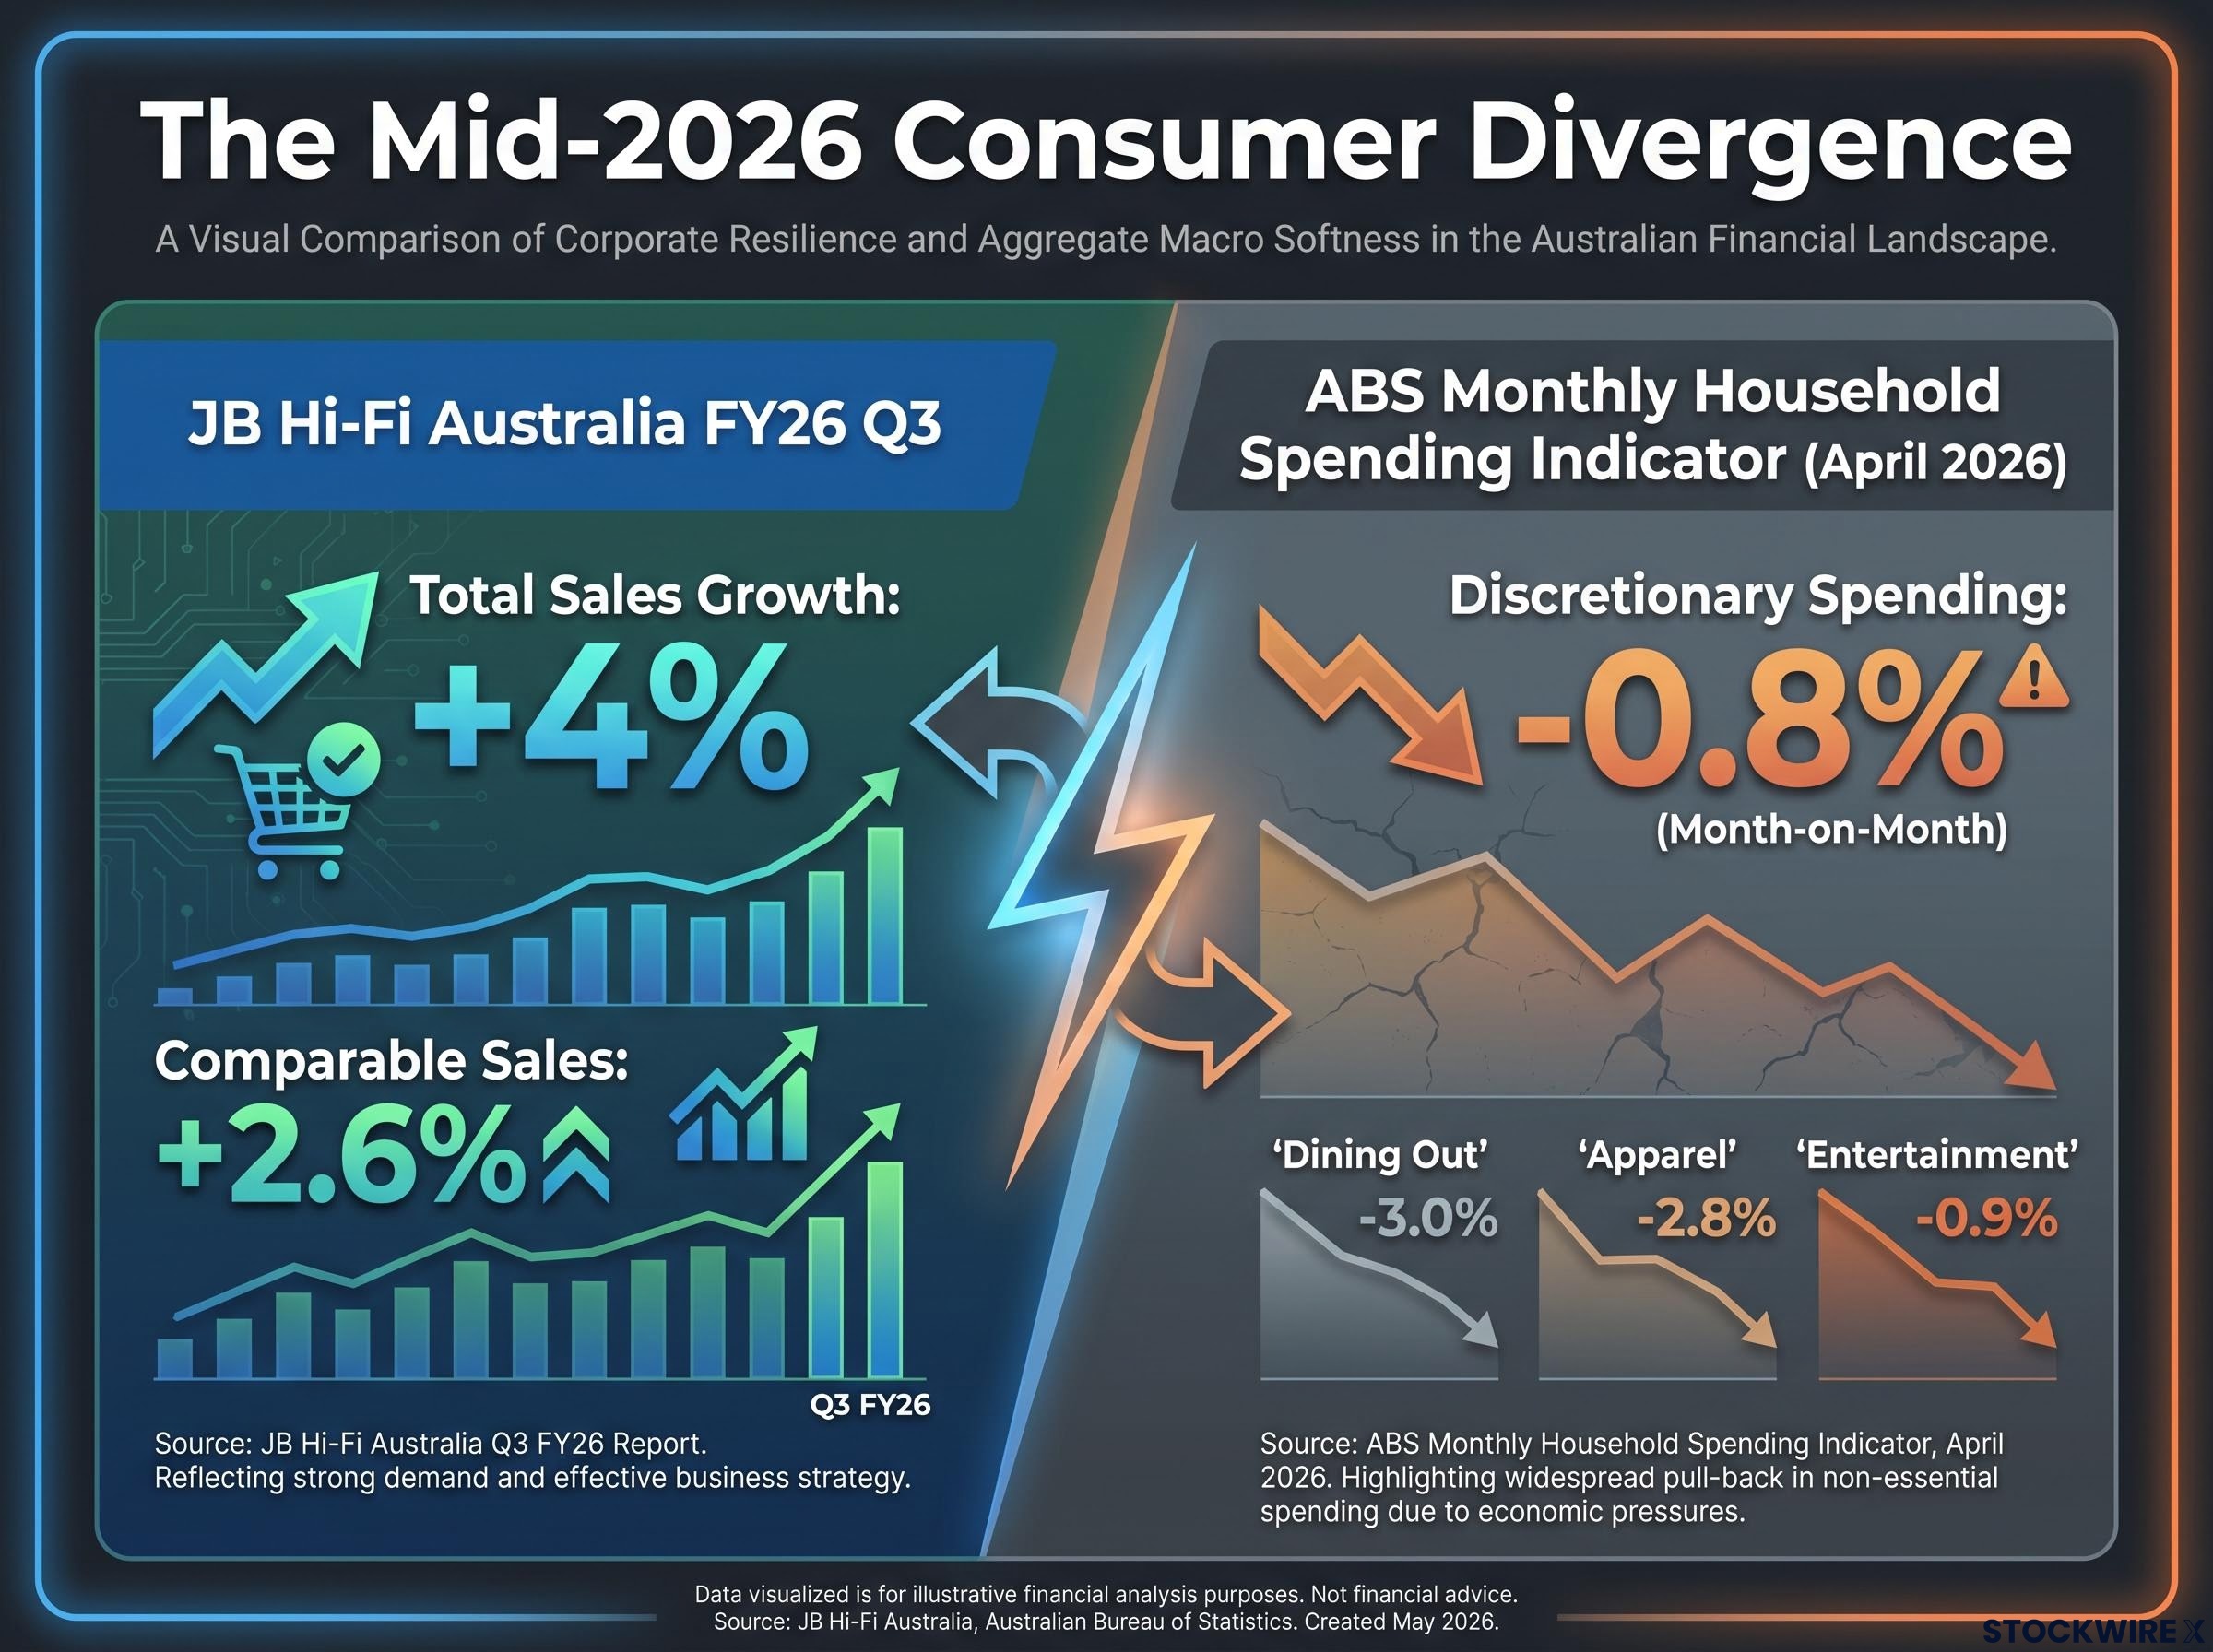
JB Hi-Fi Australia delivered approximately 4% total sales growth in the FY26 third quarter, with comparable sales up approximately 2.6%. New Zealand recorded double-digit growth. Online channel penetration continued to expand at a similar pace.
The headline is positive. It is also clearly a deceleration from stimulus-era peaks and prior quarters. This is resilient-but-normalising growth, not a boom signal.
The share price reaction on the update day was contained, reflecting margin concerns and competitive commentary rather than a pure top-line reading. That gap between a solid revenue number and a muted market reaction tells you something the headline alone does not.
A 4% total sales figure sounds clean. But when online and New Zealand are both growing at double-digit rates, they are doing meaningful lifting work inside the aggregate. Strip those out and the core Australian physical-store consumer signal is softer than the total implies.
This matters for two reasons. First, channel mix shift toward online can flatter total sales without reflecting a broad-based Australian consumer uplift. Second, online growth may not carry equivalent margin dynamics, so strong total sales can coexist with earnings pressure. A revenue beat that comes primarily from a lower-margin channel is a different signal than one driven by foot traffic.
When reading any JB Hi-Fi update, five metrics give you the cleanest signal:
Retail transaction data captures what households actually do with their money. Survey-based sentiment measures, the kind that generate consumer confidence headlines, capture what households say they intend to do. During periods of financial stress, those two things diverge meaningfully. People feel pessimistic but keep spending selectively, or feel optimistic but defer large purchases. Revealed preference, the economic term for behaviour you can observe in real transactions, is a more reliable signal than stated intention.
The gap between what surveys show and what transaction data reveals is a recurring feature of rate cycle dynamics in Australian consumer discretionary, where sentiment can surge on cut expectations alone before any actual easing flows through to household budgets.
Actual purchasing behaviour in discretionary categories is a more reliable confidence signal than survey-based sentiment indices.
Electronics and home goods sit at the first tier of expenditure households cut when budgets tighten. You do not defer a grocery shop, but you defer a new television. That makes movements in this category a leading rather than lagging indicator of consumer stress. When a major discretionary retailer posts positive comparable sales while official aggregate data shows softness, it tells you households are protecting some discretionary spend through reallocation and value-seeking rather than shutting down entirely. That is a meaningfully different portfolio signal than a clean consumer collapse.
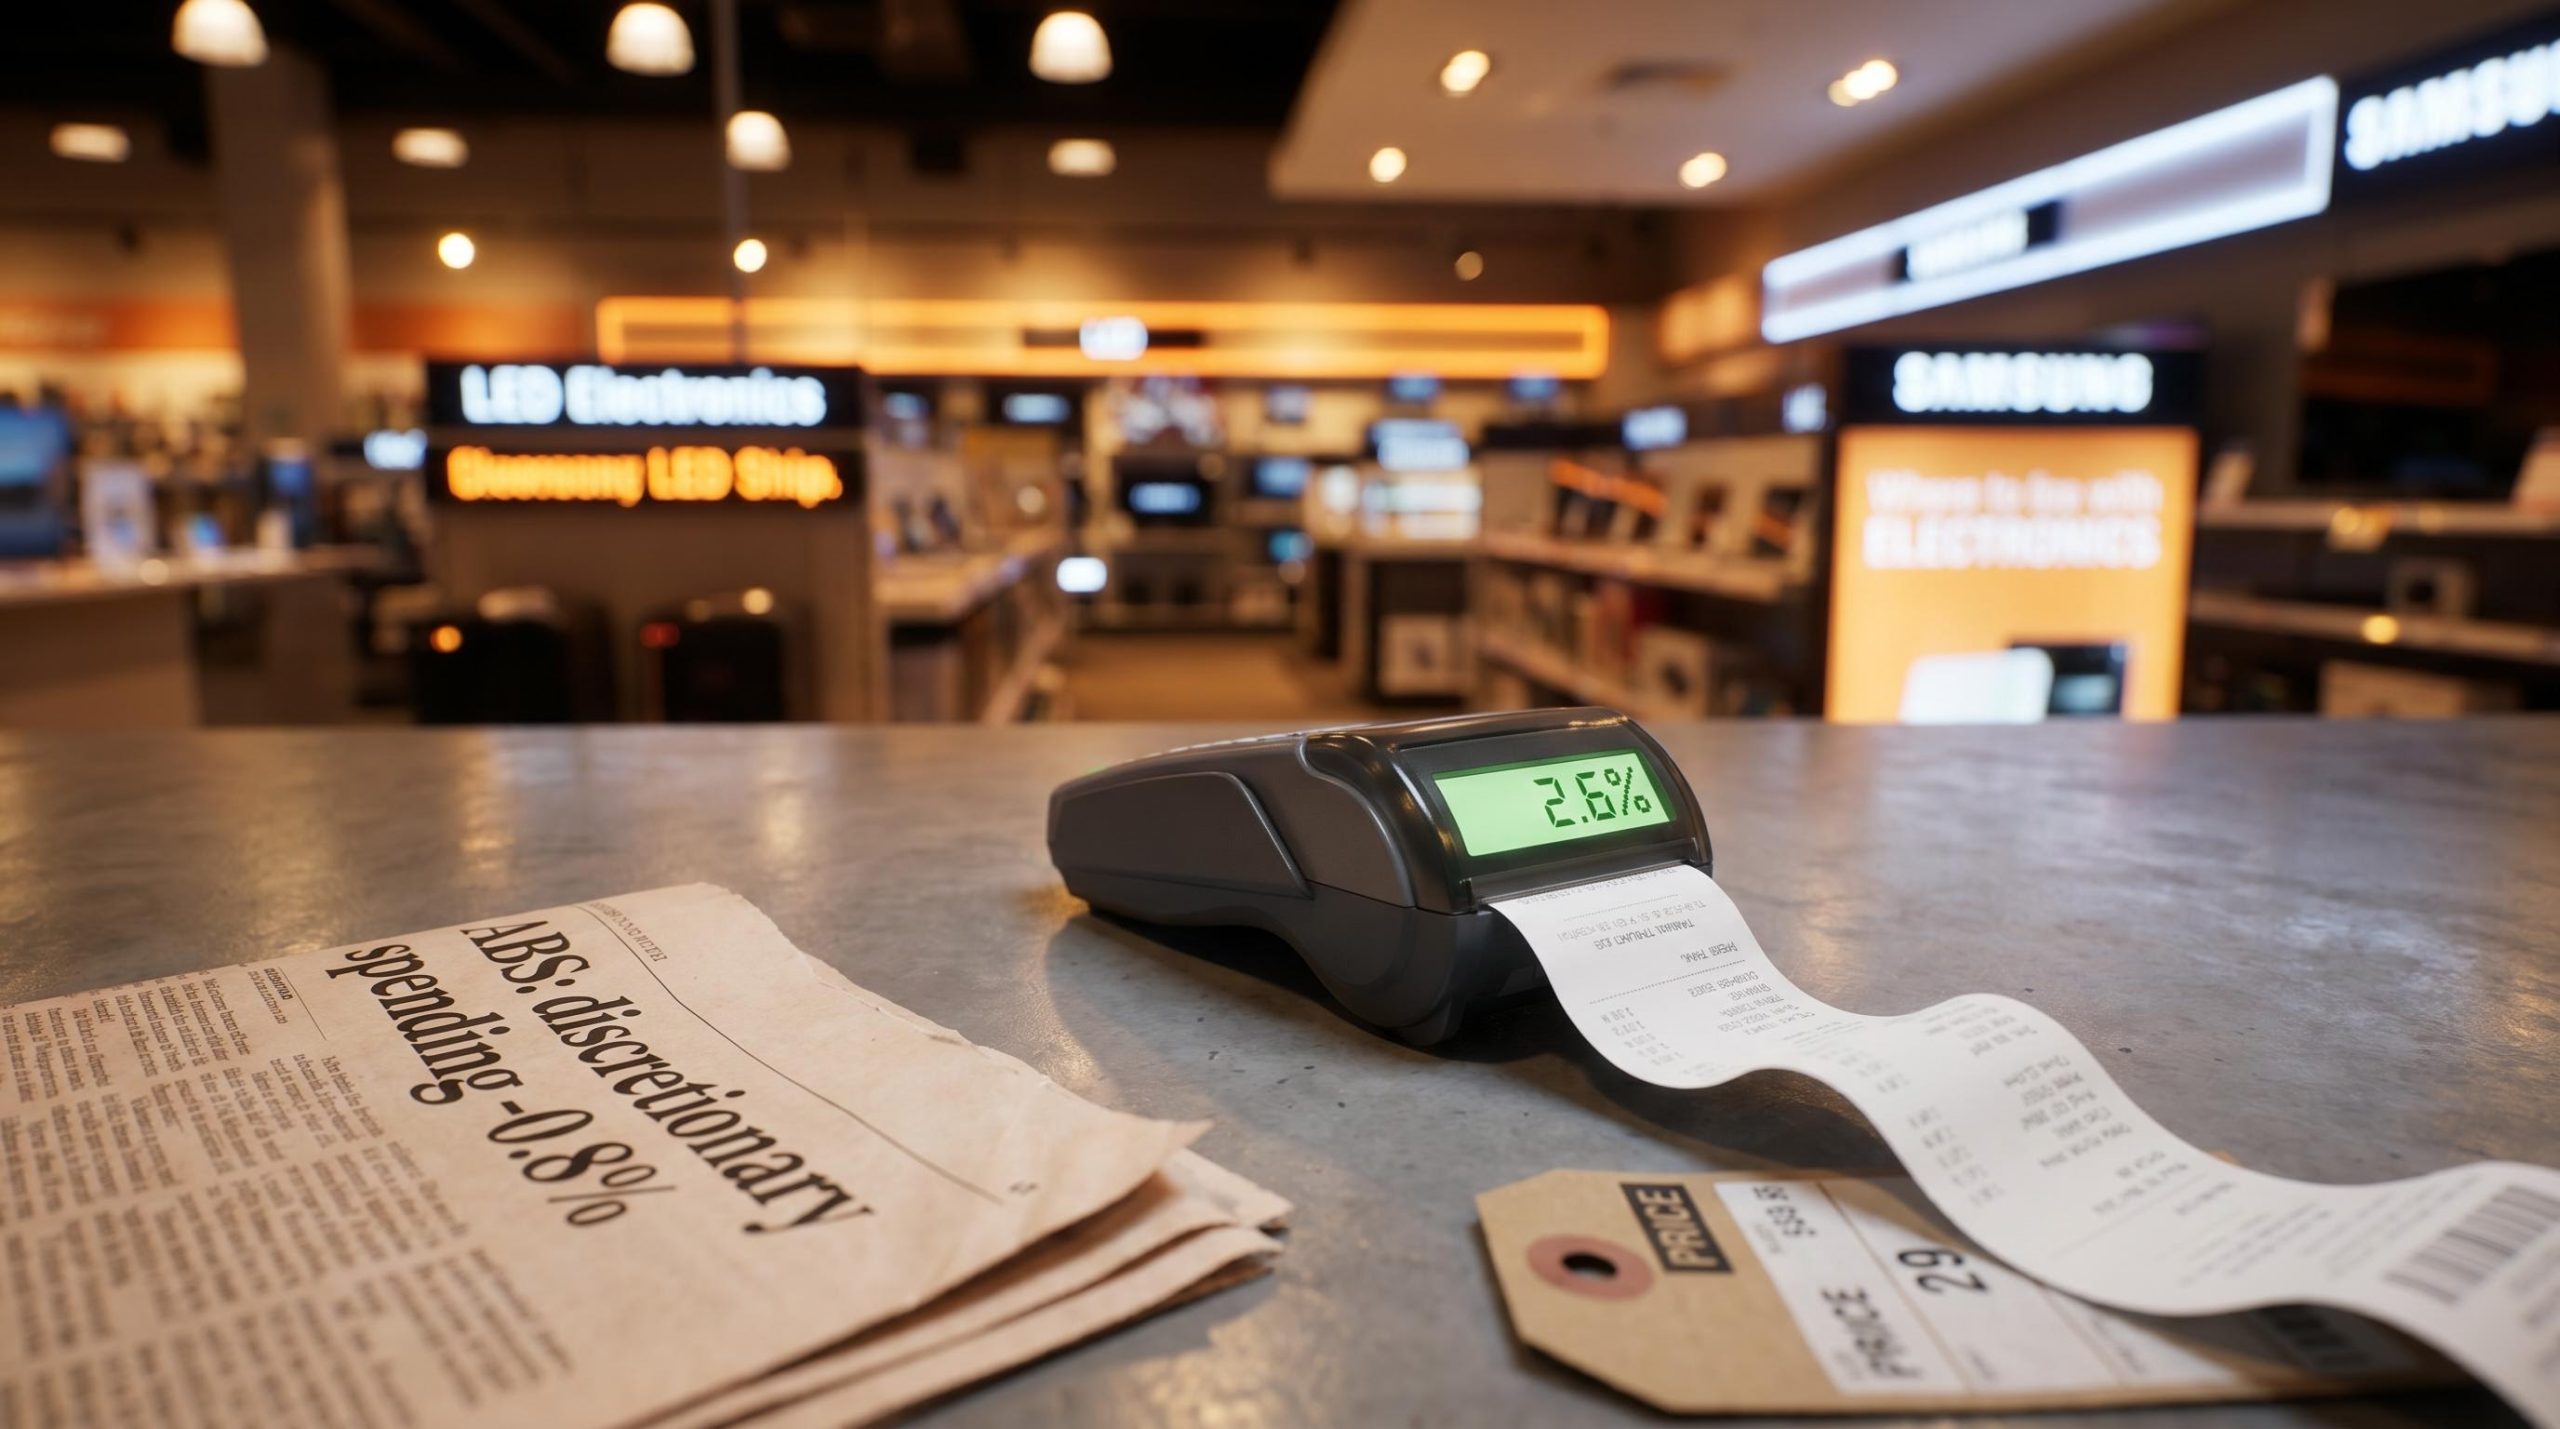
JB Hi-Fi updates arrive earlier than ABS official statistics, giving investors a timing advantage. The ABS Monthly Household Spending Indicator showed discretionary spending fell approximately 0.8% month-on-month in April 2026 in seasonally adjusted terms, while essential categories held up better. That bifurcation between essential and discretionary spend is exactly the environment where transaction data from a leading discretionary retailer carries more diagnostic weight than a headline confidence survey.
The ABS Monthly Household Spending Indicator confirmed that household spending fell in April 2026, with discretionary categories absorbing the bulk of the pressure while essential spending held comparatively firm, providing the official baseline against which JB Hi-Fi’s transaction data can be read.
| Retail transaction data captures | Survey-based sentiment captures |
|---|---|
| Actual dollars spent, by category and channel | How consumers say they feel about the economy |
| Shifts in basket size and product mix | Stated intentions to spend or save |
| Real-time read on trade-down or trade-up behaviour | Backward-looking emotional framing |
| Leading indicator of category-level demand | Often lags actual spending changes by weeks |
Here is the specific tension. The ABS says discretionary spending fell approximately 0.8% month-on-month in April 2026. JB Hi-Fi says comparable sales grew approximately 2.6% in the same broad period. Both can be true simultaneously, and the explanation matters more than either number in isolation.
JB Hi-Fi may be gaining market share from premium competitors. Cost-conscious households trading down from specialist electronics retailers or department stores into JB Hi-Fi’s value proposition keeps the company’s number positive even as aggregate category spend softens. Promotional intensity and lower-ticket volume attraction can sustain comparable sales while the broader spending pool contracts.
This combination is consistent with monetary policy that is biting but not uniformly. The RBA’s rate settings are clearly visible in macro indicators, where aggregate discretionary data is soft. But leading discretionary names have not rolled over, which argues the transmission is partial rather than complete. Households are adapting, reallocating spend, and value-seeking rather than capitulating.
The RBA’s tightening divergence from the Fed, ECB, and Bank of England places Australian households under unique pressure: retail spending contracted 0.8% month-on-month and consumer sentiment fell to 80.1 in April 2026, yet those same conditions produced the partial-cooling dynamic visible in JB Hi-Fi’s comparable sales rather than outright demand destruction.
For you, the implication is specific: rate cuts are unlikely to arrive urgently enough to trigger a wholesale consumer discretionary re-rating in the near term. The partial-cooling dynamic means the sector sits in a holding pattern, not a recovery and not a collapse. That shapes how aggressively you should rotate into discretionary exposure right now.
These are portfolio action frameworks, not share price calls on JB Hi-Fi specifically:
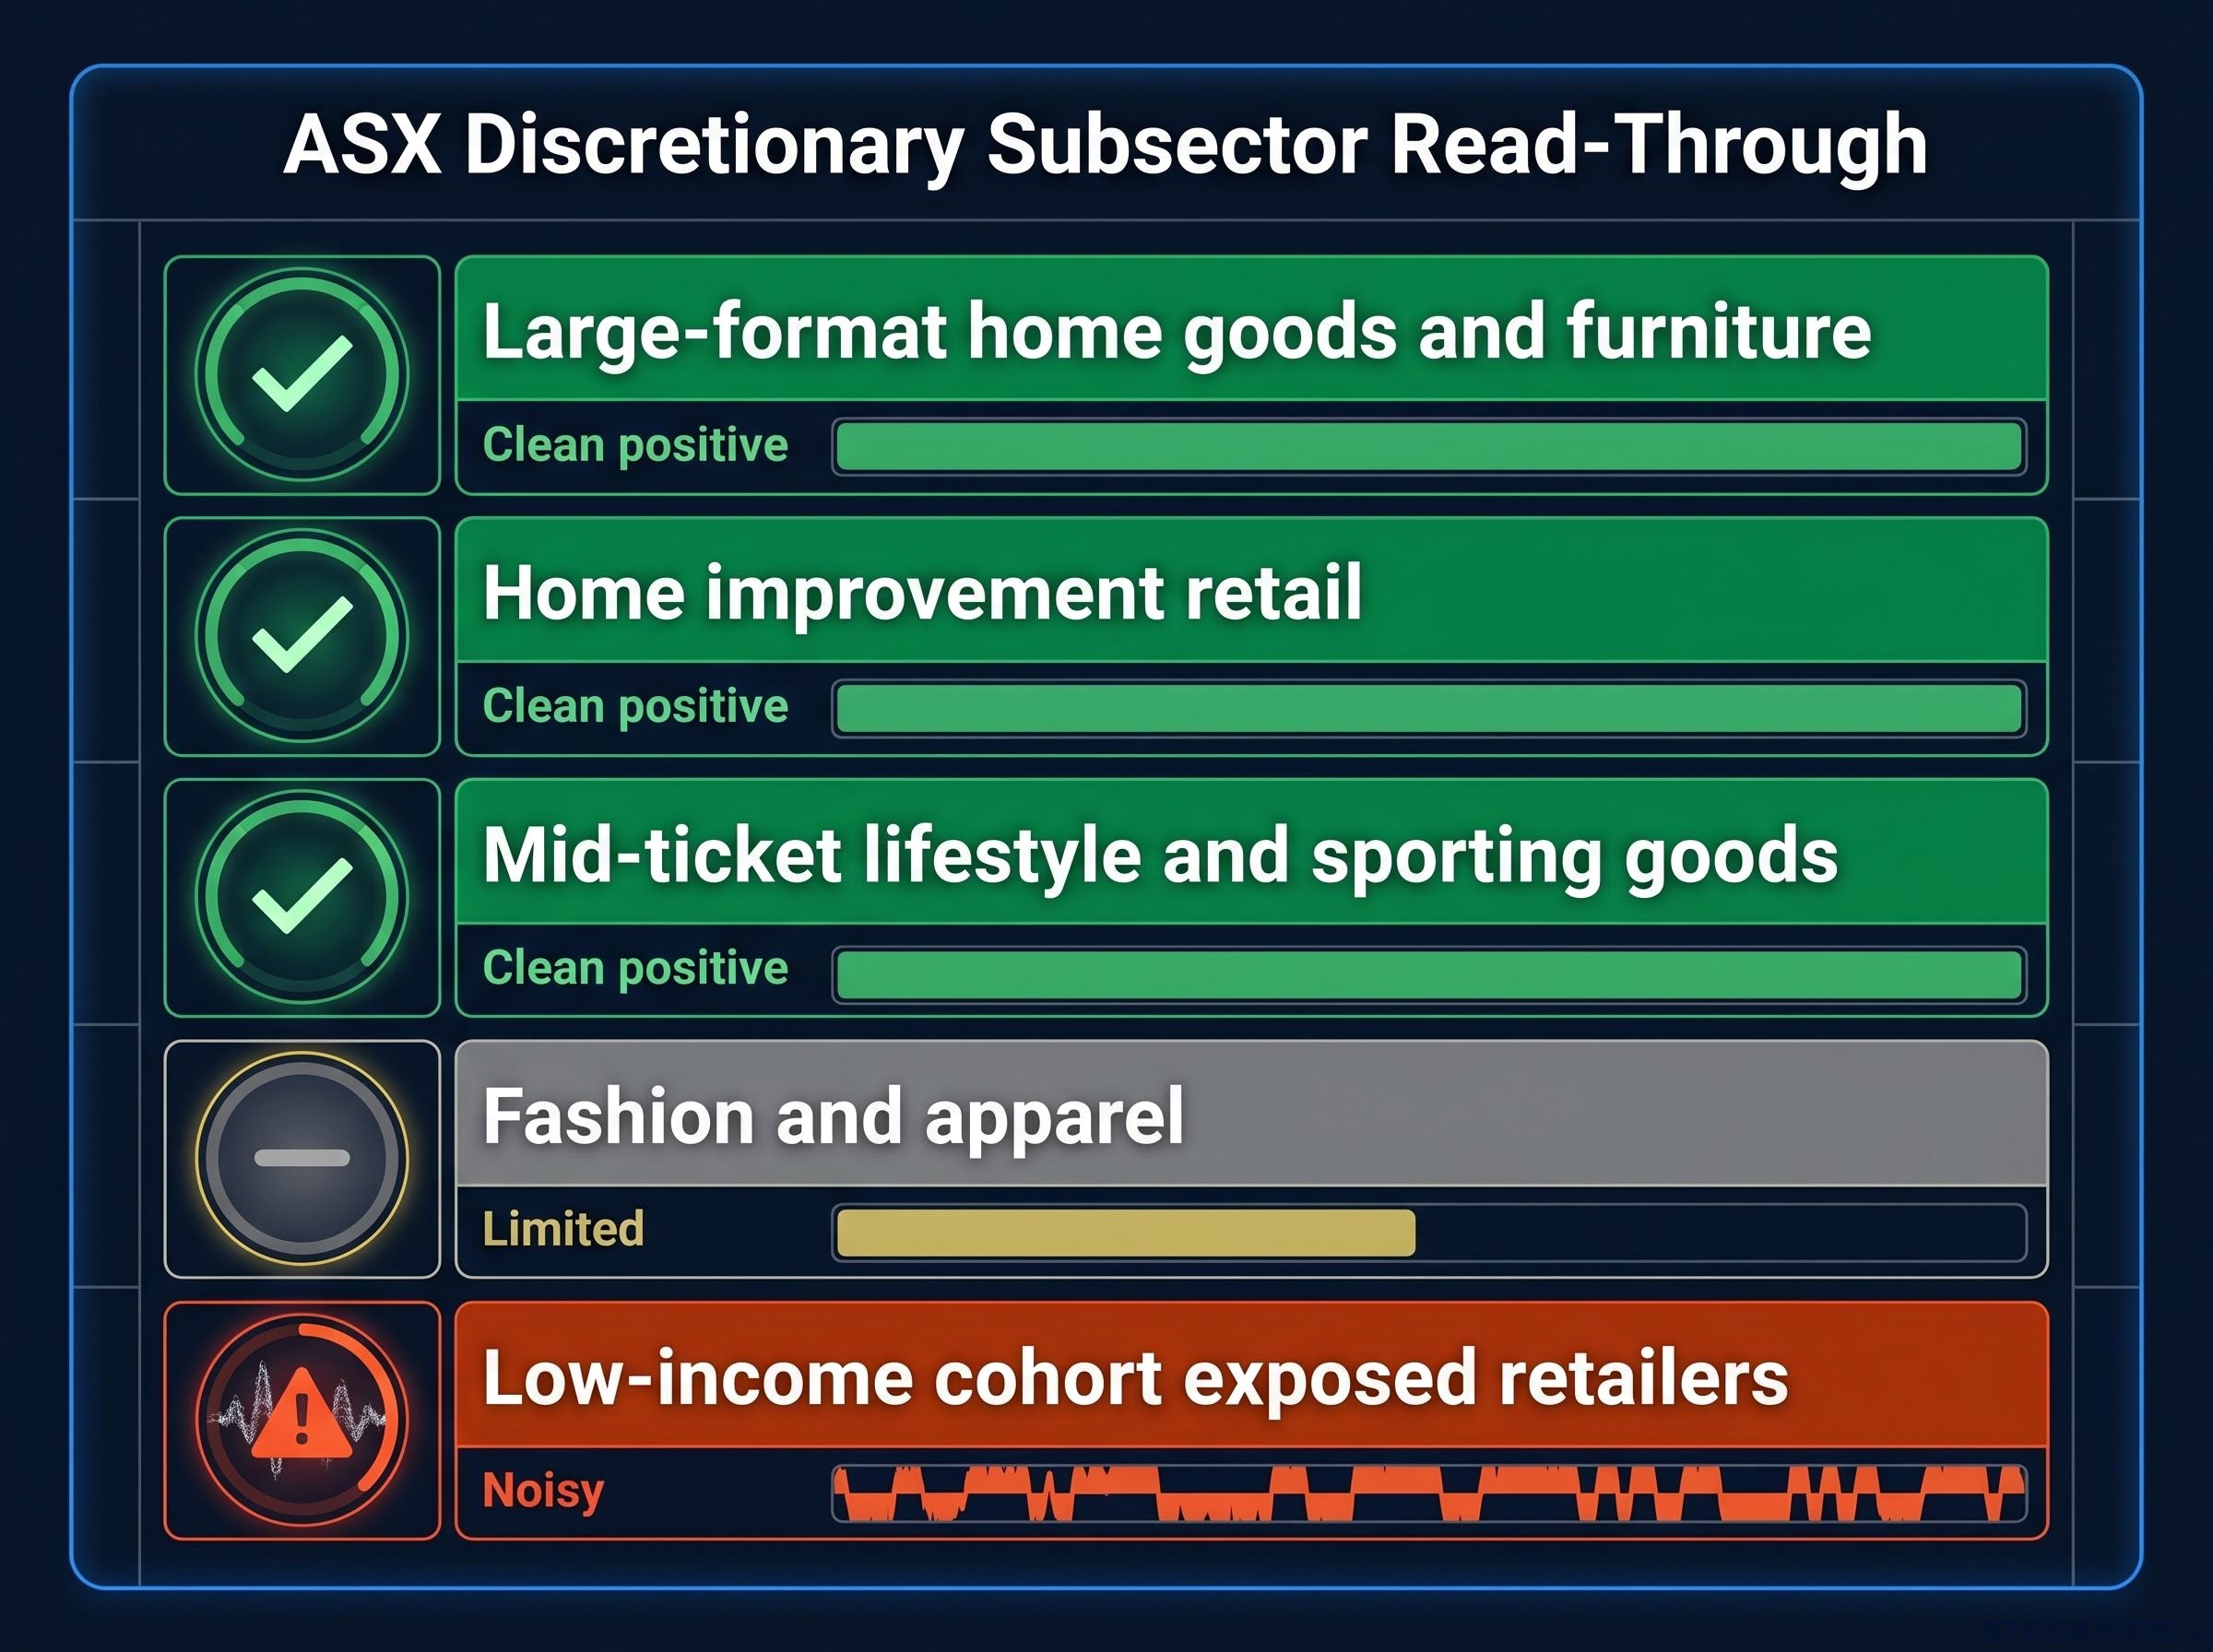
The S&P/ASX 200 Consumer Discretionary index contains names with wildly different exposure to the spending dynamic JB Hi-Fi’s result describes. The read-through is clean for some subsectors and noisy for others, and treating the signal as uniform is a common positioning error.
Sector breadth deterioration adds a further dimension to this picture: in the week ending 1 May 2026, consumer discretionary contributed 7 of the 22 ASX 200 constituents hitting fresh 52-week lows, even as the headline index fell just 0.65%, confirming that the partial-cooling dynamic is already visible at the individual stock level beneath the aggregate index.
| Subsector | Read-through quality and reasoning |
|---|---|
| Large-format home goods and furniture | Clean positive. Same household budget line as electronics; similar trade-up/trade-down dynamics. |
| Home improvement retail | Clean positive. Discretionary home spending correlates closely with consumer willingness to refresh or upgrade. |
| Mid-ticket lifestyle and sporting goods | Clean positive. Comparable demographic exposure and spend-category sensitivity. |
| Fashion and apparel | Limited. Driven by fashion cycles and seasonal inventory, not household budget reallocation patterns. |
| Low-income cohort exposed retailers | Noisy. Cost-of-living pressure hits this segment harder; JBH’s customer base skews differently. |
If your portfolio holds ASX names exposed to homewares, home improvement, or mid-ticket lifestyle, this result mildly reduces your downside risk scenario. If you hold fashion or very low-income exposed names, this result tells you relatively little and you need category-specific data instead.
A strong console launch quarter can produce outsized comparable sales figures that overstate the health of discretionary spending more broadly. Always check whether a product cycle is inflating the result before applying it to sector peers.
A contained share price reaction on a solid sales day is telling you something. JB Hi-Fi’s recent updates have produced this pattern: respectable top-line growth, muted or negative share price moves. The market is pricing margin concerns and competitive intensity that the revenue headline does not capture.
This is where company-specific factors and macro demand factors diverge, and conflating the two is a common portfolio construction error.
Company-specific factors shaping the stock reaction:
Genuine macro demand factors the result captures:
Channel mix shift toward online flatters total sales while compressing margins. Strong online growth may not translate into equivalent earnings growth, which means the result works well as a macro tool (consumers are still buying discretionary goods) but less well as an earnings forecast tool for JB Hi-Fi specifically.
When you use the update to set sector tone, you are asking one question: is the consumer falling apart? When you use it to build a JB Hi-Fi investment thesis, you are asking a different question: is this company converting revenue growth into profit growth? Holding both readings simultaneously, without confusing them, is where the analytical value sits.
The mid-2026 consumer picture is specific. Households are adapting rather than capitulating. Discretionary spend is being reallocated and protected in certain categories while contracting in aggregate. The ABS data confirms that aggregate demand pressure is real. Leading discretionary names have not yet shown it in comparable sales. The sector is in a cautious holding pattern.
The portfolio posture this supports: selective exposure to large-format home-related and mid-ticket lifestyle names is defensible. A wholesale re-rating of the consumer discretionary sector is not yet justified. Stock selection within the sector matters more than sector-level rotation calls right now. Do not position for a broad sector re-rating until rate cuts actually materialise and translate into measurable volume acceleration.
Investors exploring how the same consumer spending resilience visible in JB Hi-Fi’s comparable sales translates into physical retail property will find our full explainer on Australian retail REITs, which examines how Scentre Group and Vicinity Centres are achieving near-full occupancy, posting positive leasing spreads, and reaffirming FFO guidance in the same macro environment this article describes.
Treat JB Hi-Fi’s quarterly update as a macro data point that arrives earlier than official statistics, then calibrate sector exposure based on whether the result confirms or contradicts the prevailing consumer narrative.
Three triggers would change this cautious-but-selective posture:
This article is for informational purposes only and should not be considered financial advice. Investors should conduct their own research and consult with financial professionals before making investment decisions.
Past performance does not guarantee future results. Financial projections are subject to market conditions and various risk factors.
JB Hi-Fi’s quarterly update is most valuable not as a trading signal for JBH shares but as a calibration tool for positioning across the entire ASX consumer discretionary complex. The result tells you whether the consumer is falling apart, holding steady, or recovering, and it tells you earlier than the official data does.
The mid-2026 read is clear: resilient but normalising growth, partial rate transmission, a cautious sector tone, and selective subsector positioning. That is the output of applying this framework to the current data.
The next quarterly update will either confirm the normalisation trend or signal a directional shift. Investors equipped with the five-metric framework and the subsector read-through map covered above will interpret it faster and more accurately than those anchoring on the headline sales figure. The headline is where most people stop. The composition, the macro tension, and the subsector mapping are where the positioning edge sits.
Comparable sales growth measures revenue change across stores open for at least a year, stripping out the effect of new store openings. It is the single most reliable consumer health read in a retail update because it reflects genuine demand rather than network expansion.
JB Hi-Fi releases quarterly sales updates before the ABS publishes official household spending data, giving investors an early read on discretionary consumer behaviour. Because electronics and home goods are among the first categories households cut when budgets tighten, movements in JB Hi-Fi's comparable sales act as a leading indicator of broader consumer stress or resilience.
Retail transaction data captures what households actually spend, while sentiment surveys capture how they say they feel. During periods of financial stress, households often feel pessimistic but continue spending selectively, causing the two measures to diverge; revealed spending behaviour is generally considered a more reliable signal than stated intentions.
Large-format home goods, home improvement retail, and mid-ticket lifestyle and sporting goods names receive the cleanest positive read-through because they share similar household budget lines and demographic exposure to JB Hi-Fi. Fashion and apparel names, and retailers heavily exposed to low-income cohorts, receive limited or noisy signals from the same result.
The cautious-but-selective posture would change if rate cuts materialise alongside measurable volume acceleration in discretionary transactions, if two or more consecutive comparable sales beats emerge across multiple discretionary retailers, or if JB Hi-Fi reports sharp comparable sales deterioration combined with margin contraction, signalling genuine demand destruction rather than partial cooling.