A single earnings print from one Redmond software company halted a multi-day selloff that had been erasing billions from semiconductor valuations from Seoul to San Jose. The mechanism behind that reversal tells investors something important about how the AI trade actually functions in 2026.
In the days leading up to Microsoft’s FY26 Q4 results, released approximately 28-29 July 2026, two distinct fears were compressing technology and semiconductor equities simultaneously: investor doubt that AI capital expenditure was generating measurable financial returns, and mounting anxiety over China’s expanding presence in the memory chip market. These pressures were not the same risk, but they were hitting the same stocks. The earnings release addressed one of them directly and with precision.
Here is what the data actually shows about AI monetisation, why Azure consumption functions as the clearest available signal of billable AI demand, and what the 30 July session’s cross-market rebound tells you about the structural architecture of the AI equity trade, specifically how sentiment travels from hyperscaler earnings through to memory suppliers, GPU cloud providers, and Asian semiconductor names.
What Microsoft’s numbers actually said about AI monetisation
The headline figures were strong across every line. Microsoft reported FY26 Q4 revenue of $90.0 billion, up 18% year over year, operating income of $40.6 billion (also up 18%), and net income of $35.8 billion, up 31% on a GAAP basis. Diluted earnings per share came in at $4.81, a 32% GAAP increase.
| Metric | Q4 FY26 Value | YoY Change | Status |
|---|---|---|---|
| Revenue | $90.0B | +18% | Verified |
| Operating Income | $40.6B | +18% | Verified |
| Net Income (GAAP) | $35.8B | +31% | Verified |
| Diluted EPS (GAAP) | $4.81 | +32% | Verified |
Beating on revenue and EPS was necessary but insufficient. What the market needed was visibility into cloud and AI-specific consumption, the layer that tells you whether enterprise buyers are actually spending on AI workloads or whether the capex cycle is running ahead of demand.
The hyperscaler capex trajectory heading into Microsoft’s Q4 print was already at historically unprecedented scale, with Amazon, Microsoft, Alphabet, and Meta collectively spending $130 billion in Q1 2026 alone and full-year 2026 guidance reaching $725 billion, the baseline context that made the AI ROI question so analytically loaded before results landed.
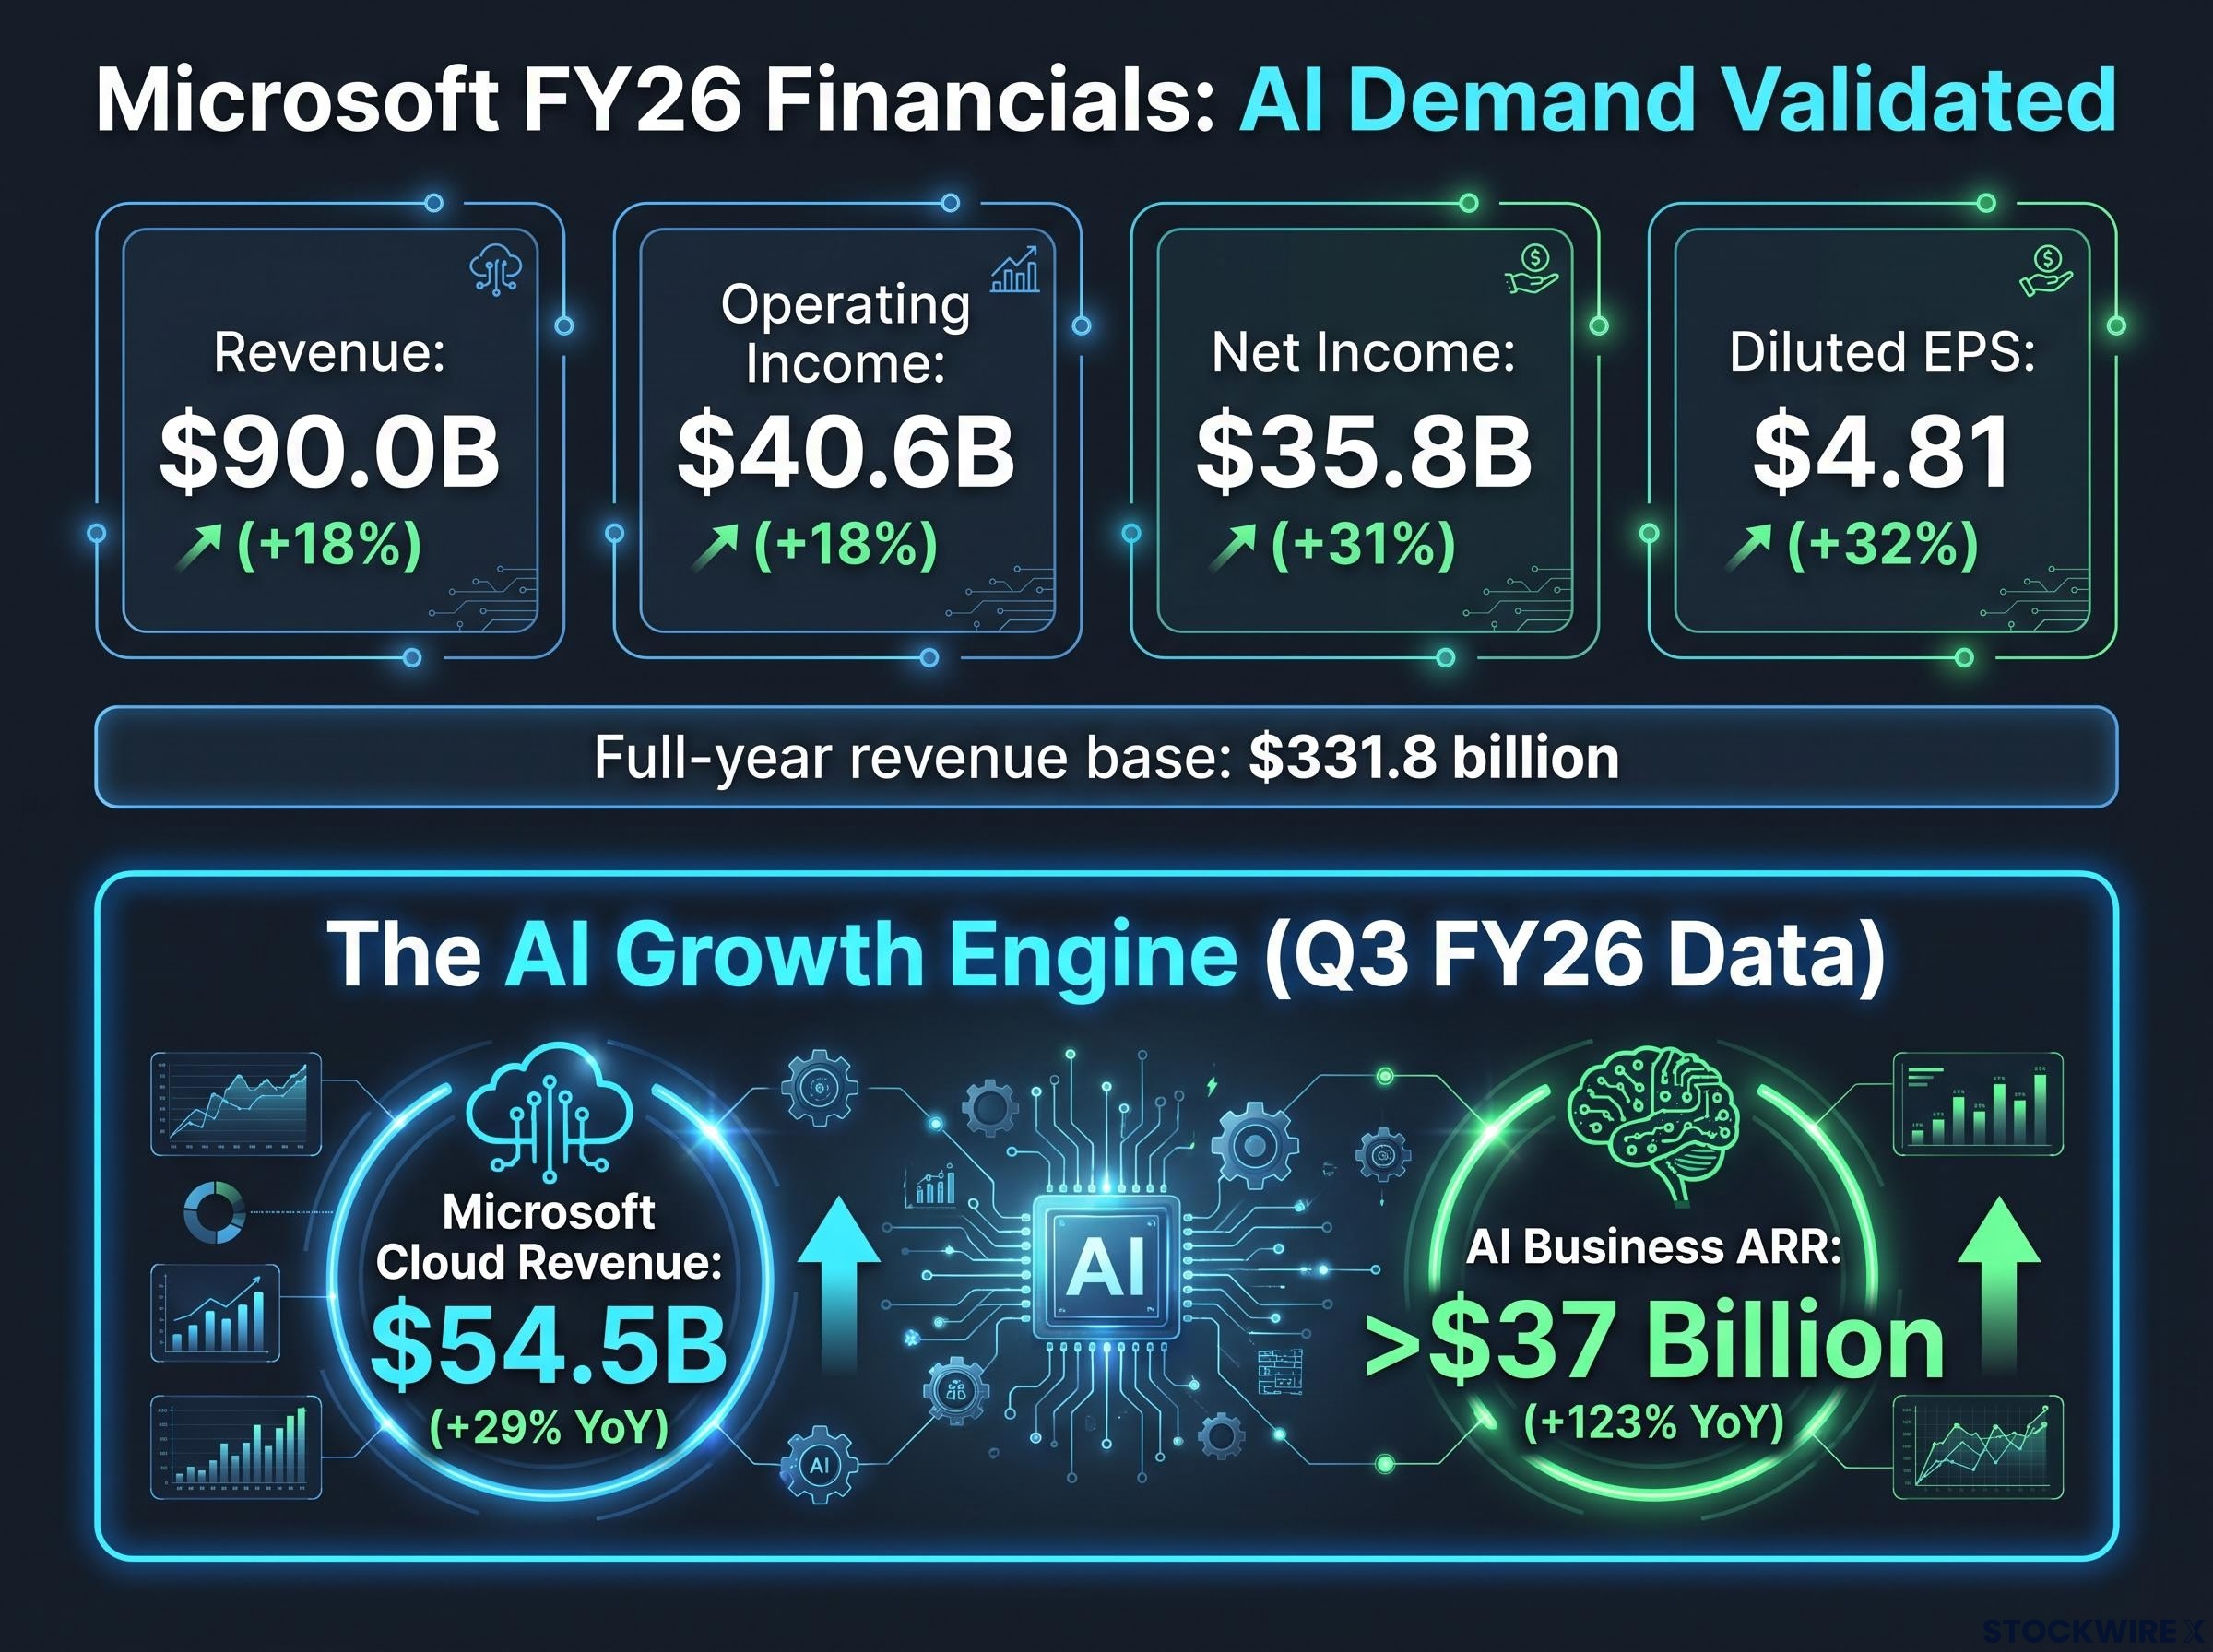
That visibility came from the most recent granular breakdown available. In FY26 Q3, Microsoft Cloud revenue reached $54.5 billion, up 29% year over year, while the AI business annual revenue run rate surpassed $37 billion, growing 123% year over year. The FY26 Q4 Azure-specific growth percentage was not yet published at the time of writing; once released, it will be the single most precise AI monetisation proxy in the report.
Reuters reporting on Microsoft’s Q4 FY26 results confirmed total revenue of $90 billion alongside 43% growth in the Azure cloud-computing business, corroborating the consumption-driven narrative that repositioned sentiment across the semiconductor supply chain on 30 July.
Microsoft management attributed the outperformance to “strong demand across the Azure platform and our first-party AI applications and services.”
That 123% year-over-year growth in AI business ARR is not a vanity metric. It tells you that enterprises are translating AI experimentation into recurring, contracted cloud spend at a pace that materially outstrips what the broader bear case on AI return on investment had assumed.
When big ASX news breaks, our subscribers know first
Why Azure consumption is the market’s real-time AI demand gauge
Enterprise AI workloads are overwhelmingly cloud-delivered. That single architectural reality is what makes Azure, AWS, and Google Cloud consumption the most direct measure of billable AI demand available to investors on a quarterly basis. When companies buy AI capabilities, they buy cloud compute and storage. The transaction shows up in billings data before it shows up anywhere else.
Not all AI demand proxies carry the same analytical weight. Consider the alternatives:
- Cloud billings (Azure, AWS, Google Cloud): High timeliness, direct link to monetised workloads, reported quarterly with revenue-grade precision
- GPU shipment data: Useful for supply-side tracking but lags demand by one to two quarters and does not distinguish between paid workloads and speculative inventory building
- Software licence counts: Measures adoption breadth but not consumption depth; a company can licence an AI tool and barely use it
- Management guidance: Forward-looking and subjective; useful as directional signal but not as a demand measurement
Microsoft’s reporting structure separates “Microsoft Cloud” revenue from “AI Business ARR,” giving investors a level of AI monetisation granularity that management commentary alone cannot provide. Higher capital expenditure directed into data centres and AI infrastructure, as noted in management commentary, functions as a leading indicator for subsequent cloud revenue and AI ARR growth.
For an investor evaluating whether AI infrastructure spending is generating returns, the Azure consumption trend is the closest available substitute for a direct profitability audit of the enterprise AI build-out. This quarter’s numbers made the case that returns are arriving.
The AI capex monetisation gap between Microsoft and Meta in the same earnings week illustrates why capex scale alone does not determine investor verdicts: Microsoft’s net income rose 31% while Meta’s fell 14%, a divergence that sharpens the analytical framework for reading any hyperscaler’s cloud consumption figures against its infrastructure spend.
How a single earnings print propagated through the semiconductor supply chain
The mechanism works in a specific sequence. When a hyperscaler beats on cloud AI metrics, the market draws a chain of inferences that reprice upstream suppliers within hours:
- Hyperscaler beats on cloud AI consumption and revenue metrics
- Market infers sustained compute and memory demand at the infrastructure layer
- Supply chain names reprice to reflect a validated capex cycle
- High-beta names amplify the move proportionally to their AI revenue concentration
On the 30 July session, reports from market data sources indicated that Microsoft advanced approximately 15.5%, while Micron Technology gained approximately 18.4%. The original source also cited a gain of approximately 26% for an entity listed as “SanDisk,” though SanDisk ceased to exist as a standalone public company after its 2016 acquisition by Western Digital; the reference likely pertains to Western Digital or a related entity, and investors should verify before treating the figure as confirmed. CoreWeave and Astera Labs were also cited as beneficiaries of the sentiment reversal.
Verification note: The specific price levels, percentage moves, and volume figures cited in market reporting for the 30 July session have not been independently corroborated from primary market data sources. They are presented here as reported figures pending confirmation.
The fact that memory and interconnect names moved more aggressively than Microsoft itself tells you that investors were not just repricing one company’s earnings. They were updating their probability estimates for the entire AI infrastructure capital expenditure cycle remaining intact. That is the amplification mechanism at work: platform-level validation triggers beta-weighted repricing across every company whose revenue depends on the continuation of that cycle.
The selloff that preceded the rebound, and why it matters analytically
The 30 July rebound did not occur in a vacuum. It was the second half of a two-phase episode, and understanding what drove the first half changes how you should read the recovery.
AI ROI anxiety: the fear Microsoft’s results directly answered
In the days leading up to the earnings release, investor concern was building that large-scale AI infrastructure spending by hyperscalers was not producing measurable financial returns. The scepticism was straightforward: billions flowing into data centres and GPU clusters, but where was the revenue to justify it?
Azure consumption data and AI ARR are the metrics that directly address this concern. The 123% year-over-year growth in AI business ARR and 29% growth in Microsoft Cloud revenue provided a substantive counter-argument. Not a promise of future returns, but evidence of current, recurring, billable demand.
Chinese memory competition: the risk that remains unresolved
Separately, growing output from Chinese memory chip manufacturers weighed heavily on South Korean equities and dragged down semiconductor names across global markets. This is a structural competitive risk to established U.S. and Korean producers, and it drove a portion of the July selloff independently of AI ROI concerns.
China memory chip competition has shifted from a projected future pressure to a capital-backed structural reality, with domestic DUV lithography entering initial deployment at leading fabs and CXMT’s $8.6 billion public equity raise providing the sustained funding runway that export controls were designed to prevent.
These were analytically distinct pressures operating on the same equities:
- AI ROI anxiety: Cyclical demand concern; directly addressable by hyperscaler consumption data; Microsoft’s results provided a counter-argument
- Chinese memory competition: Structural competitive risk; affects memory producers (SK Hynix, Micron, Western Digital) regardless of AI demand trends; not addressable by any single earnings release
The fact that the selloff had two distinct causes means the rebound’s durability depends on how the unresolved risk develops from here. Investors should not treat 30 July’s gains as a clean all-clear signal.
Cross-market architecture of the AI equity trade
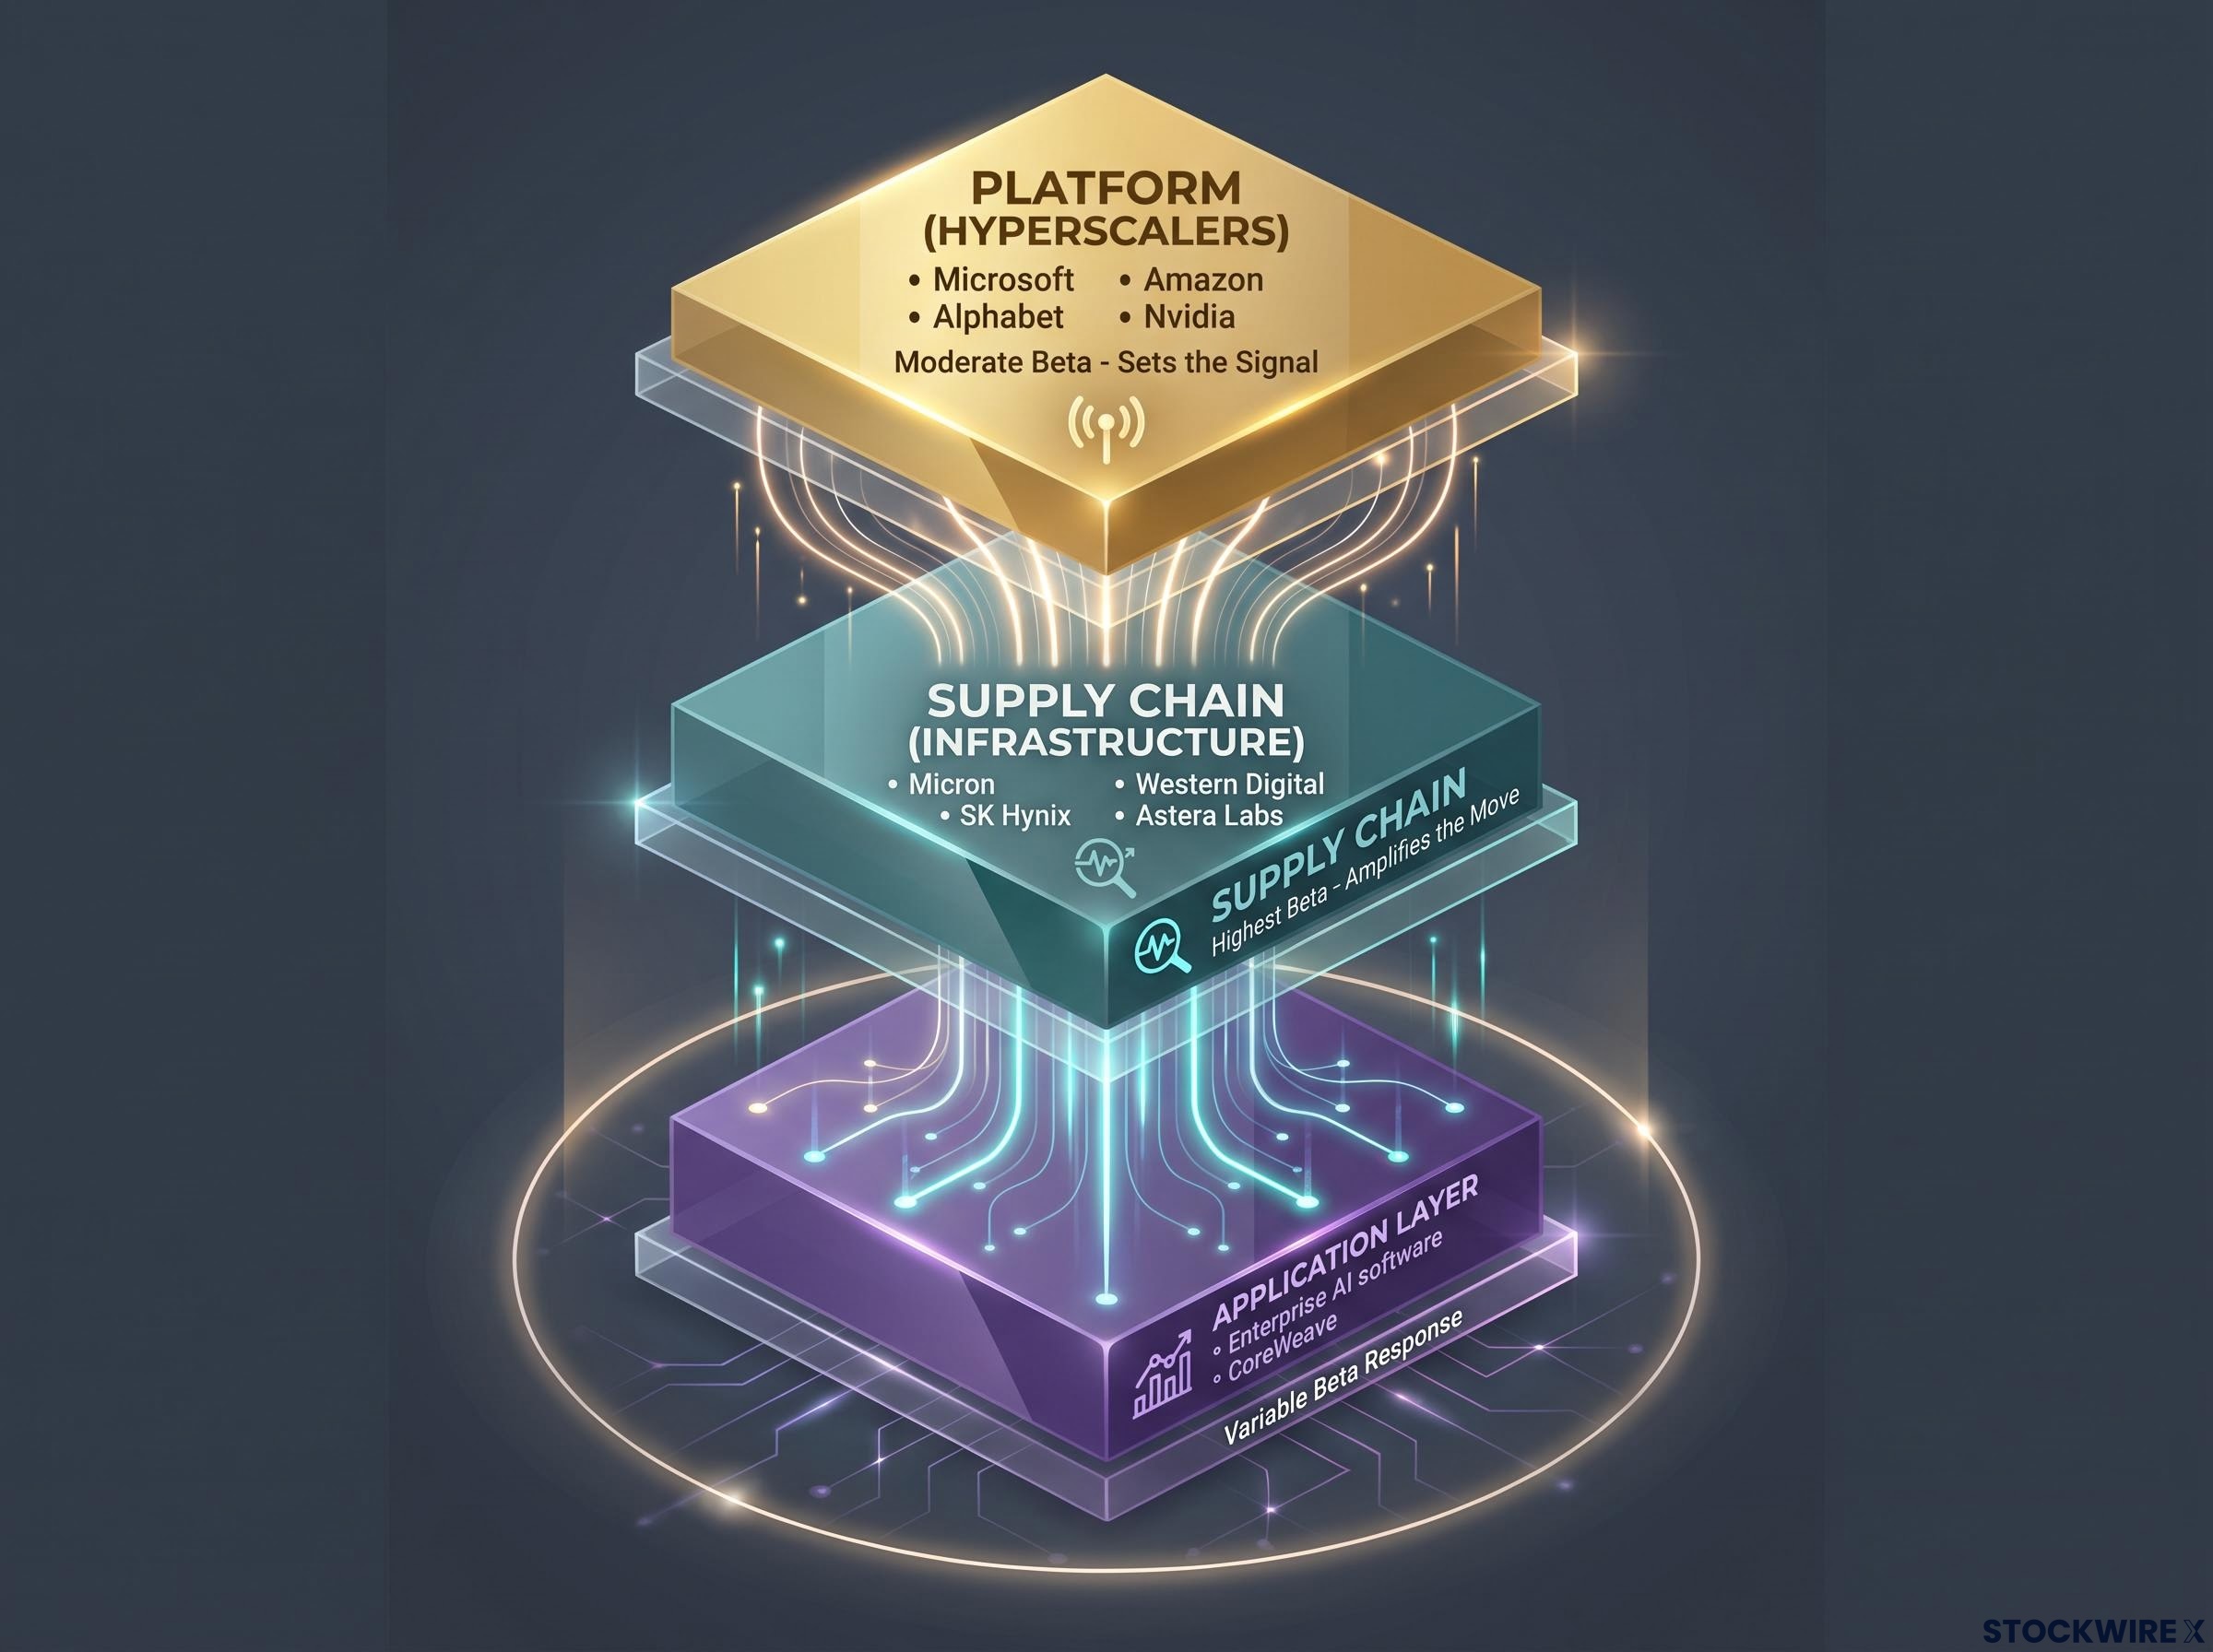
The July episode illustrates a structural pattern that recurs every earnings season. AI-linked equities operate in a three-tier hierarchy, and each tier responds to platform-level earnings events with different latency and different magnitude.
| Tier | Representative Names | Primary Sensitivity | Typical Beta Response |
|---|---|---|---|
| Platform (Hyperscalers) | Microsoft, Alphabet, Amazon, Nvidia | Cloud AI consumption, capex guidance | Moderate; sets the signal |
| Supply Chain (Infrastructure) | Micron, SK Hynix, Western Digital, Astera Labs | Compute and memory demand implied by platform results | Highest; amplifies the move |
| Application Layer | Enterprise AI software, GPU cloud providers (CoreWeave) | Broader AI adoption sentiment | Variable; depends on revenue concentration |
The supply chain tier, sitting in the middle, typically exhibits the highest beta response. Memory producers and interconnect vendors amplify platform-level signals because their revenue is almost entirely dependent on the continuation of the infrastructure build-out. When a hyperscaler validates that build-out with consumption data, the middle tier reprices fastest and furthest.
This structure extends geographically. The recovery in U.S. markets following Microsoft’s results on 30 July carried into Asian equity markets on 31 July 2026. SK Hynix, the primary high-bandwidth memory (HBM) supplier to Nvidia and accessible to U.S. investors via ADRs, is among the most directly linked names in this cross-market chain.
For investors holding or evaluating AI-adjacent positions, this three-tier structure means the most actionable information in any hyperscaler earnings release is not the headline EPS figure but the cloud AI consumption and capex guidance. Those are the variables that price the middle tier where the most volatile moves happen.
What the durability of this rebound actually depends on
A strong earnings print answered one question precisely and left a second one entirely open. The variables that determine whether 30 July’s gains represent sustained re-rating or a sentiment bounce that fades are specific and trackable:
- Azure Q4 specific growth percentage when published: this is the single most important forthcoming data point for validating the rebound’s analytical basis
- Subsequent hyperscaler earnings from Alphabet, Amazon, and Nvidia’s next reporting cycle, which will either corroborate or contradict the AI monetisation thesis
- Chinese memory production capacity and market share trends, which represent the structural competitive risk that no earnings release can resolve
- Capital expenditure guidance from hyperscalers in future quarters as a forward demand signal for the supply chain tier
Investors who treat 30 July’s gains as validation of the entire AI trade thesis are reading more into one earnings print than the data supports. The print answered the AI ROI question with real numbers: $37 billion-plus in AI business ARR growing at 123% year over year, embedded within a full-year revenue base of $331.8 billion (up 18%). That is not a one-quarter anomaly.
Azure concentration risk runs deeper than headline growth rates suggest: approximately 45% of Azure’s reported backlog is attributed to a single counterparty in OpenAI, meaning any further compute diversification by OpenAI represents a measurable revenue exposure that the strong Q4 print does not neutralise.
But the Chinese memory competition dynamic is a separate variable with its own timeline, and it requires tracking regulatory developments and production capacity data as distinct inputs from earnings season.
This article is for informational purposes only and should not be considered financial advice. Investors should conduct their own research and consult with financial professionals before making investment decisions.
Reading the next hyperscaler earnings cycle with sharper tools
The core analytical insight from this episode is structural, not seasonal. Hyperscaler cloud AI metrics, specifically consumption data, ARR, and capex guidance, are the variables that price the broader AI equity ecosystem. Understanding this relationship transforms earnings season from a reactive event into an anticipatory one.
Two risk layers sit beneath AI-linked equities at all times. The first, AI monetisation and whether spending is generating returns, is directly addressable by quarterly data. Microsoft’s AI ARR growing at 123% year over year at the FY26 Q3 mark is the benchmark figure that made the 30 July rebound defensible analytically, not just emotionally. The second, geopolitical and competitive dynamics such as China’s memory expansion, operates on a different timeline entirely and requires different inputs to track.
When the next major hyperscaler reports, look at the cloud AI consumption figures and capex guidance first, before the headline EPS. Those are the variables with the greatest cross-market pricing power, the numbers that will reprice Micron, SK Hynix, and every interconnect vendor in the supply chain tier before the analyst consensus note arrives.
The framework to carry forward: one earnings print can validate an AI demand cycle. It cannot resolve a structural competitive threat. Knowing which risk you are evaluating, and which metrics address it, is the difference between interpreting the market and reacting to it.
Forward-looking statements in this article are speculative and subject to change based on market developments and company performance. Past performance does not guarantee future results.