The most dangerous investment mistakes are not made in bad companies. They are made in great ones, at the wrong price. That single distinction has separated disciplined investors from frustrated ones for as long as markets have existed, and no stock illustrates it more precisely than Intel.
Investors who bought near Intel’s 2000 peak, around $75 per share, waited more than two decades for the stock to revisit those levels. The underlying business grew substantially in the interim. Revenue expanded. Profits scaled. The company remained a semiconductor leader. None of it mattered to the cohort that paid the wrong price.
Here is a concrete framework for separating two questions that investors routinely conflate: is this a good business, and is this a good price? The Intel valuation case gives you specific numbers, a parallel case study, and a portable decision rule you can apply to any dominant platform trading at peak-enthusiasm multiples today.
What Intel’s 2000 peak teaches about the difference between a great company and a great investment
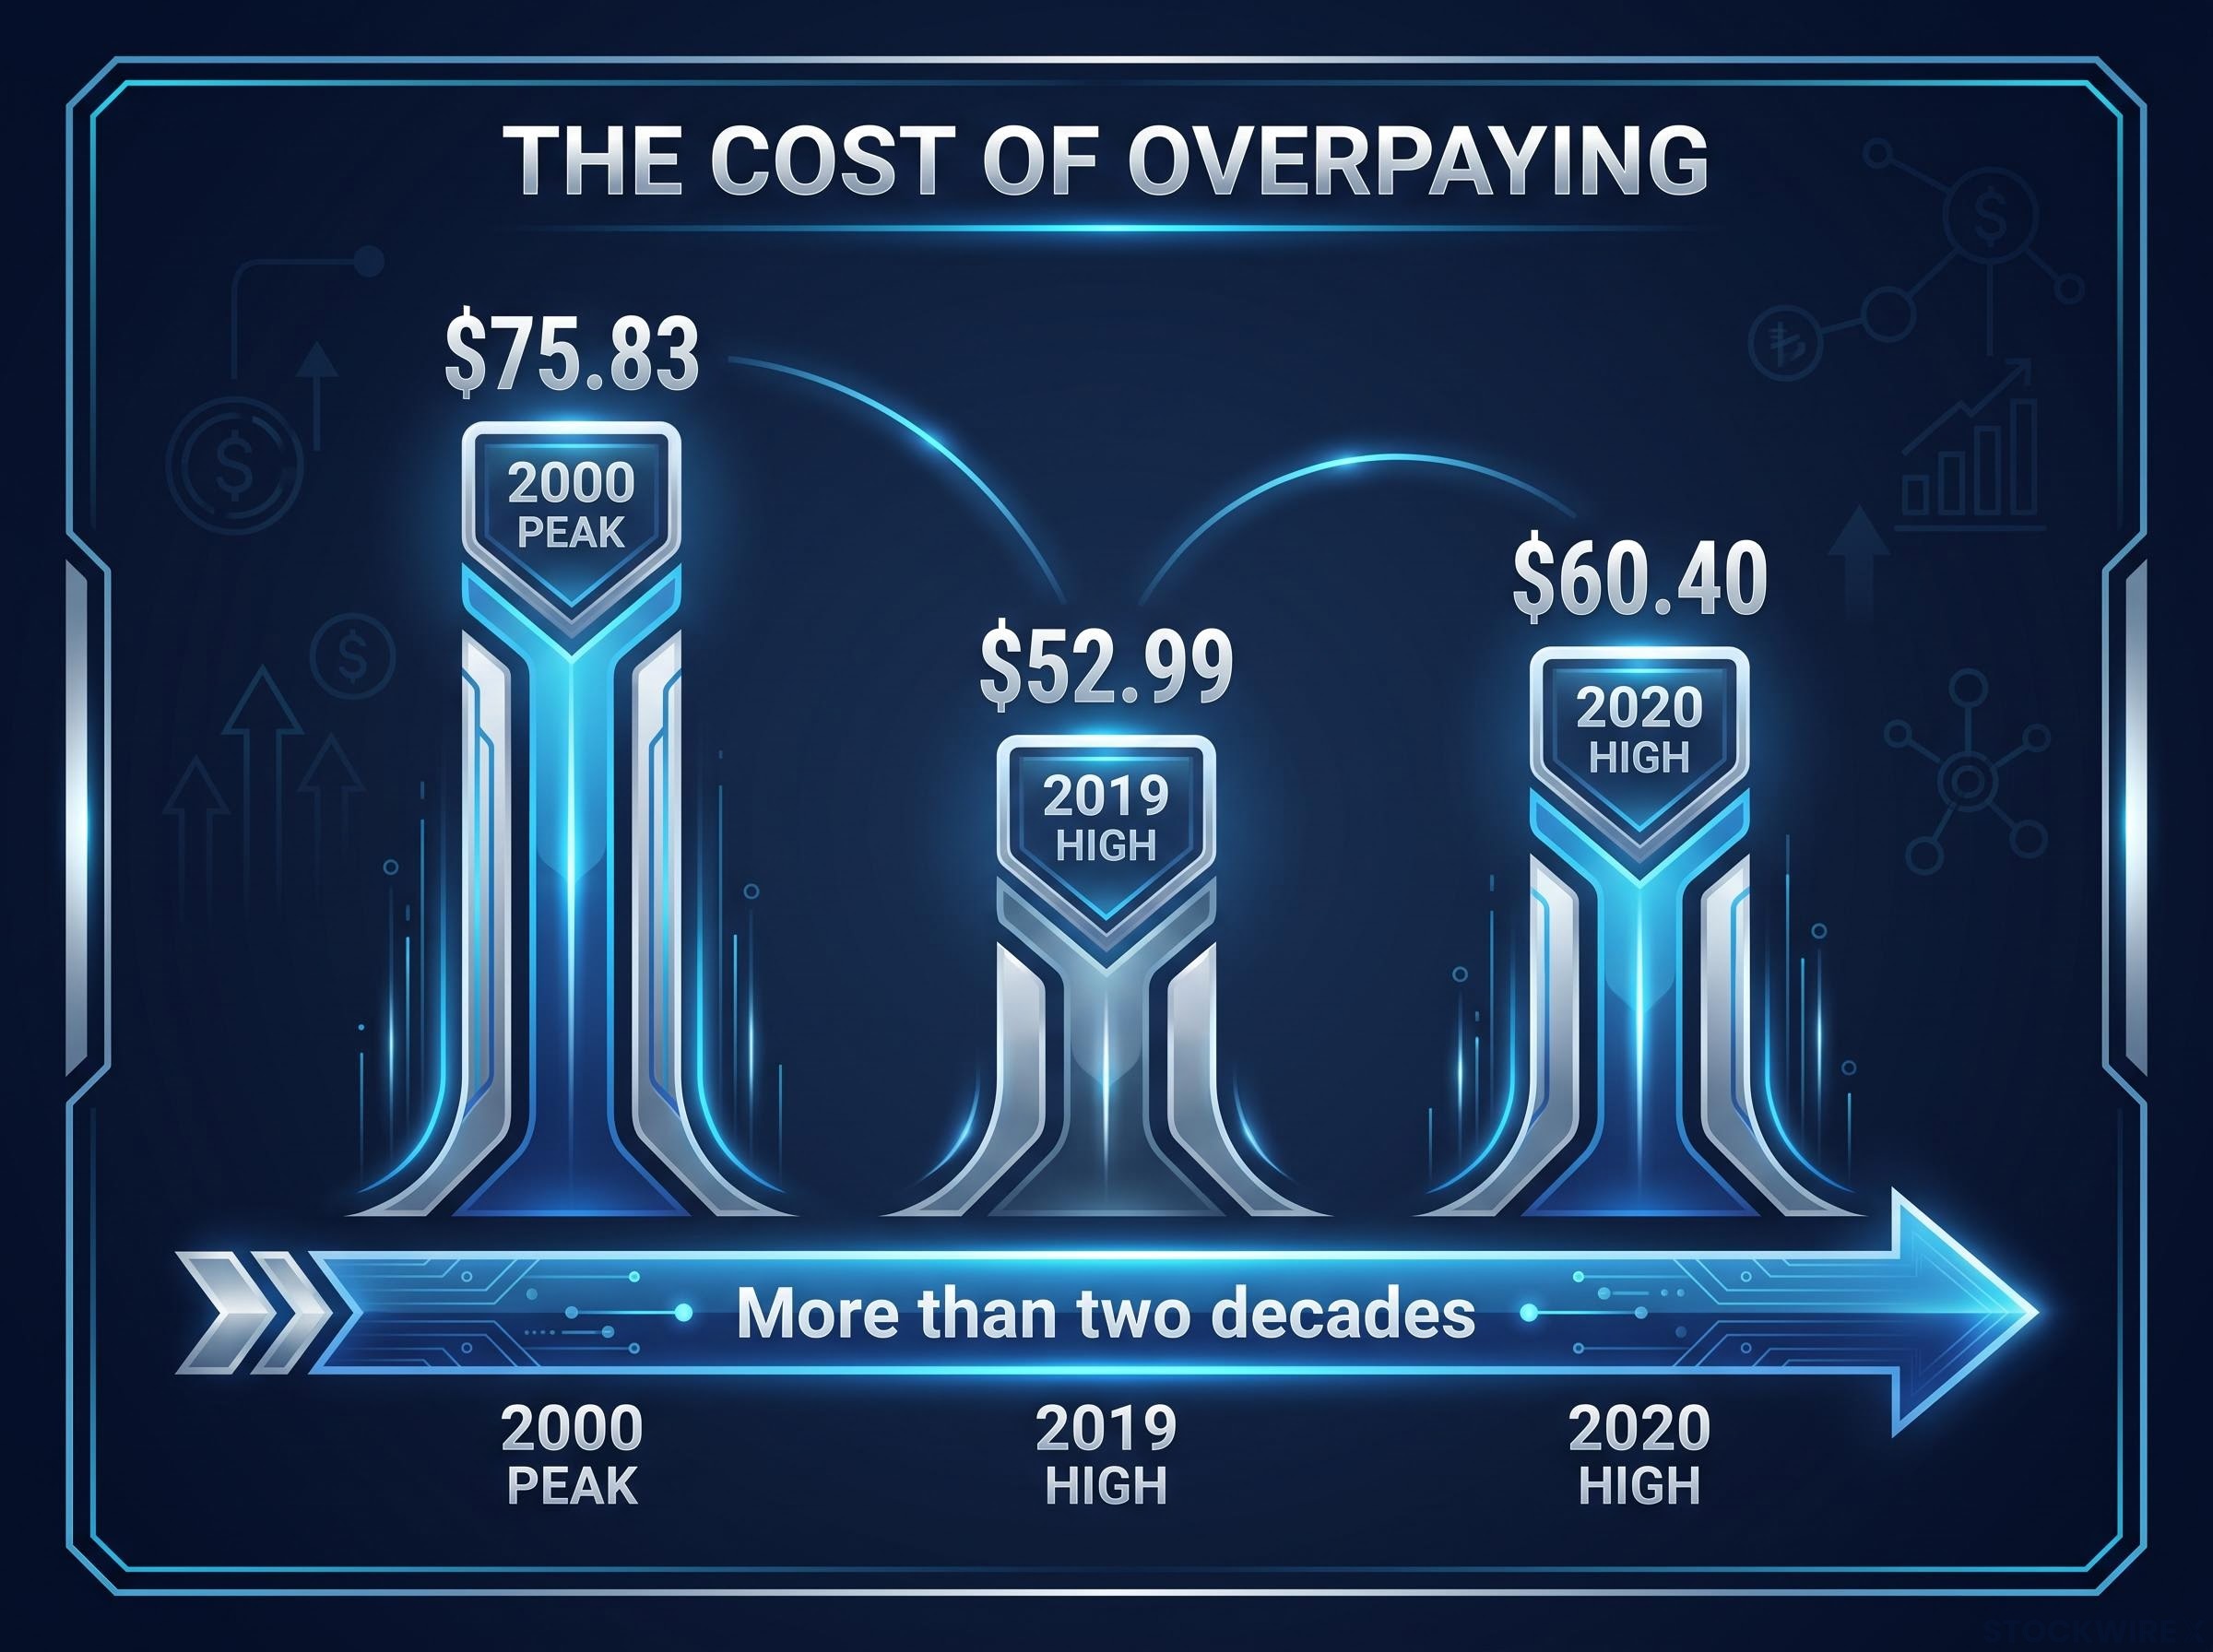
Intel reached an intraday high of approximately $75.83 per share in 2000, at the peak of dot-com enthusiasm. Here is what happened to investors who bought at that level:
- 2000 peak: approximately $75.83 per share (intraday high)
- 2019 annual high: approximately $52.99, still well below the 2000 peak
- 2020 annual high: approximately $60.40, still below the 2000 peak
More than two decades passed before the stock sustainably exceeded those levels.
The business kept growing while the stock stood still
This is the part that confounds investors who equate company quality with stock performance. In the years following 2000, Intel generated substantially more revenue and profit than it had at the peak. The underlying enterprise scaled across multiple product cycles. The business was, by most operational measures, a bigger and more profitable company a decade later.
Yet the stock went nowhere for the investors who bought at $75.
The mechanism is valuation compression. At the 2000 peak, Intel’s price embedded expectations so aggressive that years of genuine earnings growth were consumed merely “growing into” a price that had already been paid. Every year the stock sat below the purchase price was a year of compounding that did not happen. That is not a trivia fact about a dot-com relic. It is a direct cost measurement, and the size of the cost was proportional to how much was overpaid at entry.
Valuation compression is the mechanism that turns a correct business thesis into a poor investment outcome: WiseTech Global’s forward P/E contracted from approximately 86x to 34x between late 2025 and April 2026 while earnings estimates rose 29%, a real-time illustration of exactly what Intel investors experienced across decades.
When big ASX news breaks, our subscribers know first
Why Cisco belongs in the same conversation
If Intel’s history were an isolated anomaly, you could dismiss it. Cisco Systems makes that harder.
Cisco was another dominant infrastructure technology company at the dot-com peak: extreme valuation multiples, an unassailable competitive position, a business that by any operating measure grew and diversified materially in the decades that followed. Investors who bought at the 2000 highs waited well over twenty years for the stock to revisit those levels.
The cause was identical. Very high market-cap-to-sales and price-to-earnings ratios at the peak meant the stock had priced in a future so aggressive that the actual future, despite being genuinely strong, was not enough to justify what buyers had paid.
Two data points make a pattern. When both Intel and Cisco, among the most competitively positioned technology companies of their era, delivered multi-decade stock underperformance from peak prices, the conclusion is structural: a dominant market position offers no protection from overvaluation.
| Attribute | Intel | Cisco |
|---|---|---|
| 2000 peak valuation | Extreme P/E and market-cap-to-sales multiples | Extreme P/E and market-cap-to-sales multiples |
| Recovery timeline | More than two decades | Well over twenty years |
| Business growth after peak | Substantially higher revenue and profit | Material revenue growth and diversification |
| Cause of underperformance | Excessive entry valuation, not business failure | Excessive entry valuation, not business failure |
How to value a business rather than admire it
A discounted cash flow (DCF) model asks a single disciplined question: what is this business worth today, given a range of plausible futures and a specific annual return you require? A DCF takes projected future cash flows, the actual cash a company generates after reinvesting in itself, and discounts them back to the present at your required rate of return.
The terminal value assumption in a DCF model typically drives 60-80% of its total output, making intrinsic value estimation less a precision exercise and more a structured process for stress-testing which scenario the market price requires to be true.
Running three scenarios simultaneously is more informative than any single estimate. A conservative scenario tests what the stock is worth if execution disappoints. A midpoint scenario reflects consensus-level performance. An optimistic scenario asks what happens if nearly everything goes right.
The model applied to Intel uses a 10-year horizon with a 9% required annual return. That 9% figure is worth pausing on.
A 9% required return builds in no buffer for error. It sits close to the long-term historical return of the S&P 500, making it the floor at which committing capital starts to make sense rather than a conservative target. Treating this threshold as the benchmark is not pessimism; it is what distinguishes a rigorous valuation from an exercise in wishful thinking.
The terminal price-to-earnings (P/E) multiple, the valuation assigned to the business at the end of the ten-year period, spans 13x at the cautious end to 23x at the bullish end, with the midpoint anchored to the long-term S&P 500 average of roughly 15-16x. Better businesses earn a premium above that baseline; weaker ones sit below it. The model does not incorporate balance sheet debt, which represents a meaningful additional risk factor.
| Scenario | Revenue growth | FCF margin | Terminal multiple | Implied fair value |
|---|---|---|---|---|
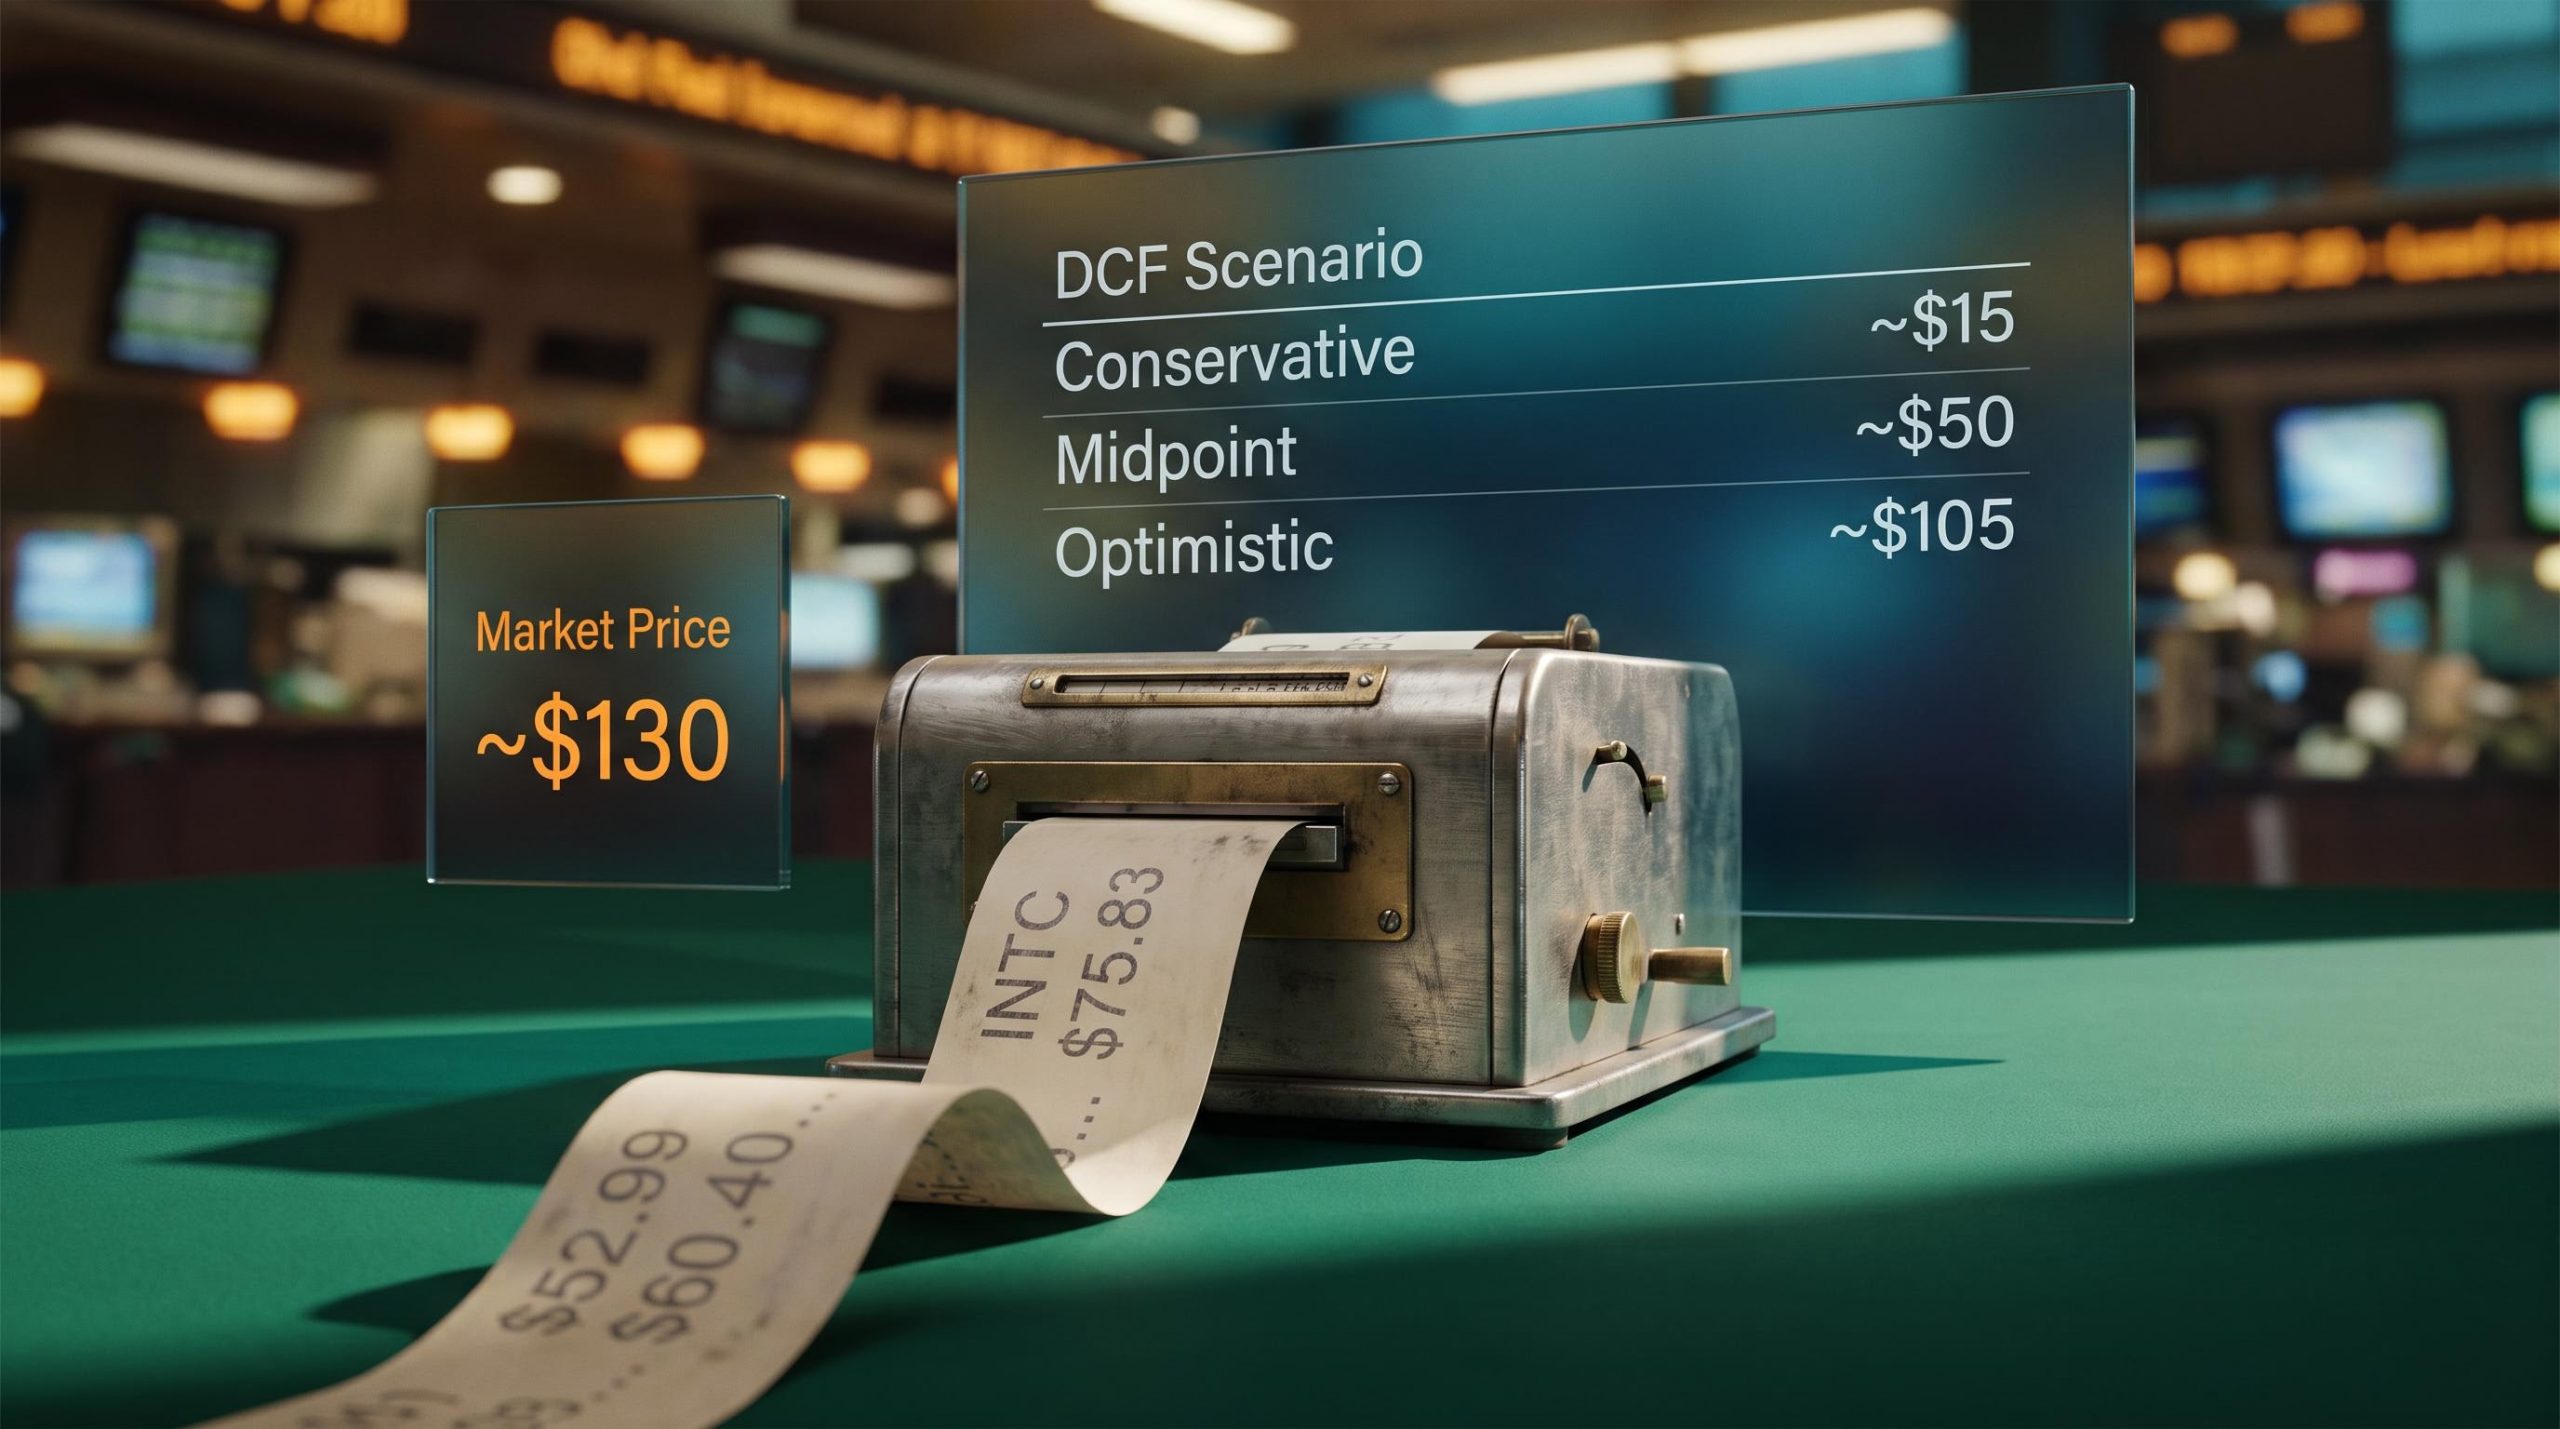
| Conservative | 5% per year | 8% | 13x | ~$15 per share |
| Midpoint | 8% per year | 17% | ~15-17x | ~$50 per share |
| Optimistic | 11% per year | 25% | 23x | ~$105 per share |
What the numbers say when you run Intel through that model
The original analysis was anchored at a share price of approximately $84, reflecting Intel’s trading level and analyst consensus as of approximately mid-2024. At that price, the model already signalled limited upside:
- Consensus forecasts at the time had Intel earning roughly $1 per share in the near term, with that figure climbing to around $4 per share across the following four years. Applying a 20x earnings multiple to that $4 projection implied a forward stock price of roughly $80, modestly below the prevailing $84 level. Over the same window, revenue was expected to grow from approximately $60 billion to roughly $77 billion.
Since mid-2024, Intel’s price has risen substantially. The stock now trades at approximately $130 per share, a figure that should be treated as approximate and not independently confirmed through a verified source at the time of writing.
The DCF model places midpoint fair value at roughly $50 per share and ceiling fair value at roughly $105 per share. With the stock trading in the $130 range, the market price has moved above even the most optimistic scenario the model can support. The gap between intrinsic value and current price has grown wider, not smaller.
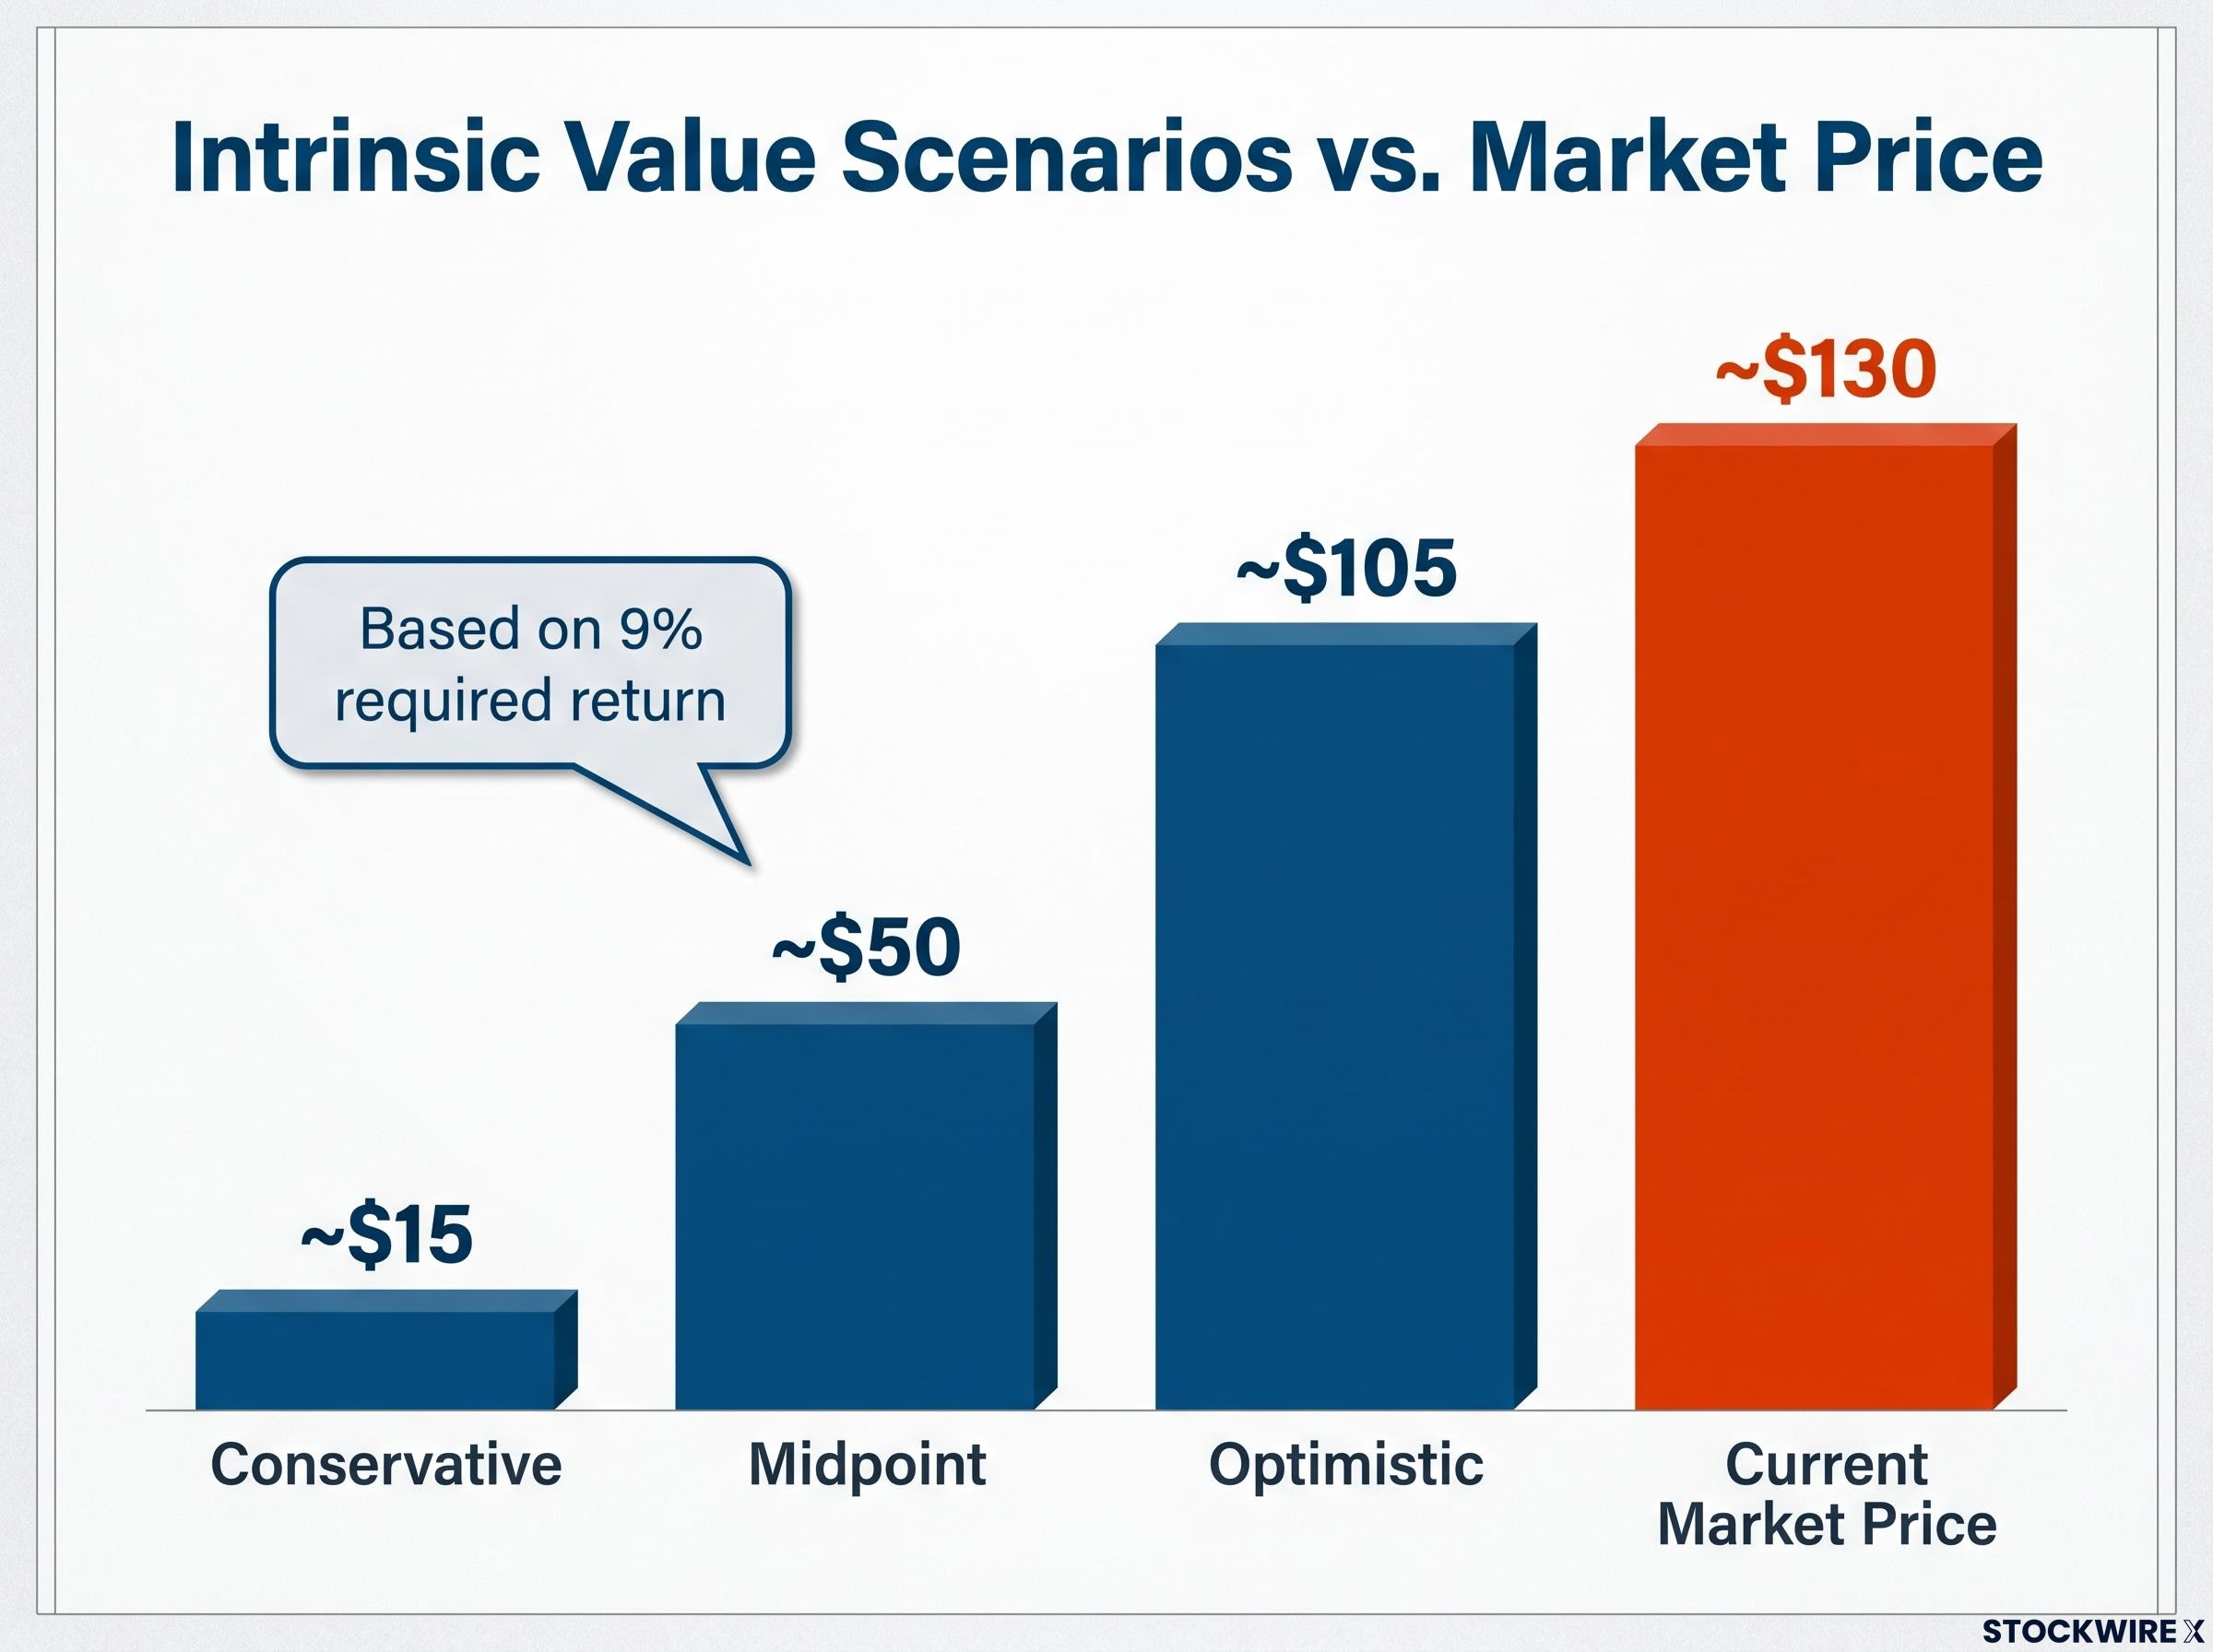
What this tells you is direct. The market is asking you to either accept returns below 9% annually, or to believe the optimistic scenario meaningfully underestimates Intel’s trajectory. If neither position feels comfortable, the price is telling you something the business fundamentals alone cannot.
This analysis references analyst consensus estimates with a mid-2024 vintage. These projections are subject to change based on market developments and company performance.
The hidden cost that valuation models do not automatically show you
Opportunity cost is the dimension of overpayment investors most consistently underweight. It is not merely the absence of gains in an overpriced position. It is the compounding that was available in alternatives and was foregone.
The three forms this cost takes are distinct and cumulative:
- Recovery time: Every year the stock sits below the purchase price is a year during which no new return is earned on that capital.
- Compounding foregone: Capital locked in a recovering position does not participate in broader market returns. The S&P 500’s long-term average of approximately 10% annually is the implicit benchmark for what that capital could have been doing.
- Psychological lock-in: Investors anchored to a purchase price frequently delay redeployment even when better prices elsewhere are visible, compounding the first two costs with a behavioural one.
Why “it’s a good company, I’ll hold” is not a free option
Holding through a multi-year recovery is not costless by default. It only becomes rational when the entry price included enough margin of safety to justify both the time commitment and the alternatives foregone.
Intel and Cisco are the two best-documented cases where the “hold until it recovers” thesis ultimately worked in the very long run, but at the cost of more than two decades of compounding that did not happen. The 9% required return in the DCF model is not an arbitrary hurdle. It represents what time-in-market at fair prices has historically delivered, and every year spent recovering toward fair value is a year of that compounding you cannot reclaim.
Applying the framework before you buy, not after
The framework forces you to answer two questions separately, not together. Is this a good business? And does the current price give you a margin of safety at a required return you find acceptable?
Here is the decision grid those three scenarios produce:
- All three scenarios below market price: The current price cannot be justified at a 9% required return under any plausible set of assumptions. That is a signal to avoid.
- Only the optimistic scenario near or above market price: The market has priced in the best plausible outcome. You are betting execution will be flawless and conditions will be ideal. Treat that as caution with explicit optimism dependency, not a green light.
- Midpoint or conservative scenario at or above market price: This is the zone of genuine margin of safety, where even a middling outcome delivers acceptable returns.
Intel in 1999-2000 held a dominant position in semiconductors comparable to Nvidia’s current position in AI chips. The parallel is structural, not predictive, but it is directly applicable to any current dominant-platform investment decision.
The Nvidia DCF valuation exercise runs the same three-scenario structure and produces an intrinsic value range of $73 to $738, a spread that reflects genuine uncertainty about whether current margins are a permanent baseline or a cyclical peak, and that maps the identical analytical challenge Intel presented at its 2000 peak.
The lesson is not Intel-specific. Any time you find yourself admiring a business and reaching for the buy button, the question is not whether the company is great. It is whether the price requires greatness to justify itself.
Before committing capital to any company you admire, run the scenarios, identify which one the current market price requires to be true, and decide whether you are comfortable betting that scenario is the base case. That is entry-price discipline, and it is the difference between a good company and a good investment.
What Intel’s history actually changes about how you evaluate dominant platforms today
Two of the most dominant technology companies of the dot-com era delivered more than two decades of stock underperformance from peak prices, despite building bigger, more profitable businesses throughout. The cause in both cases was the same: investors paid prices that embedded the most optimistic possible future, and the actual future, strong as it was, could not justify what they paid.
The three-scenario DCF model applied to Intel produces a midpoint fair value of approximately $50 and an optimistic fair value of approximately $105, against a market price of approximately $130 (approximate and unverified for 2026). Even the optimistic case falls short.
This discipline is not pessimism about great businesses. It is a structural protection against paying an admission price that guarantees years of compounding foregone, even when the underlying company delivers. Dominant market position and genuine business quality are necessary but not sufficient conditions for a strong investment. The entry price determines the return. The current elevated valuation environment across dominant technology platforms makes that discipline more relevant, not less.
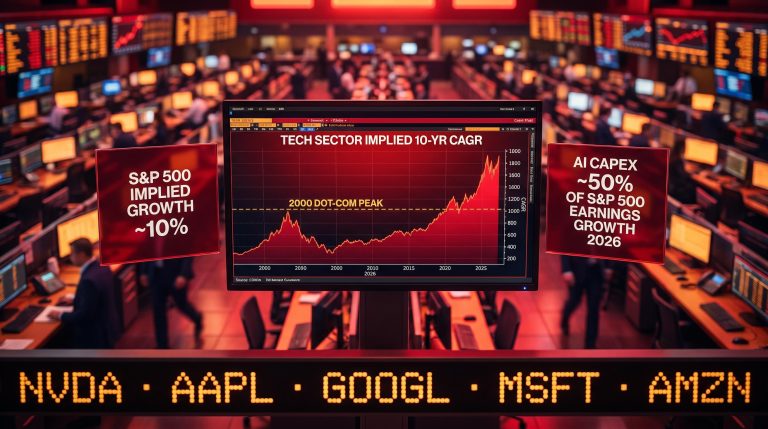
AI stock concentration in passive indexes has reached dot-com era levels, with the Magnificent Seven now representing approximately 34-35% of the S&P 500, meaning investors holding standard index funds carry meaningfully more thematic risk than prevailing narrative framing typically acknowledges.
The most dangerous investment mistake is not buying a bad company. It is paying an excellent price for an excellent company at the wrong moment.
This article is for informational purposes only and should not be considered financial advice. Investors should conduct their own research and consult with financial professionals before making investment decisions. Past performance does not guarantee future results. Financial projections are subject to market conditions and various risk factors.
—