


Intel achieved a revenue growth rate not seen in over 15 years, roughly doubled Wall Street’s earnings estimate, and then watched its stock surge 12-13% intraday before pulling back to a mid-single-digit gain by the close. That sequence, all within a single trading session, tells you something important about where this stock sits right now.
The same quarter that produced $16.1 billion in revenue and a $1.5 billion consensus beat also reported an $11 billion net loss. Those two facts are not contradictory; they coexist because of a specific accounting mechanism that most retail investors will not recognise from the headline numbers alone.
What follows here separates the accounting noise from the operational signal, walks through where growth is actually coming from at the segment level, and lays out the specific risks that explain why Wall Street did not simply chase the beat. The goal is a framework you can use to form your own view on whether Intel’s equity is worth owning at current prices.
What Intel actually reported in Q2 2026
The revenue number is the place to start. $16.1 billion, up 25% year-over-year, beating LSEG consensus estimates of roughly $14.4-15.1 billion by approximately $1.5 billion. That growth rate marks a pace of expansion Intel has not matched in over a decade and a half.
Then the earnings beat. Non-GAAP earnings per share came in at approximately $0.42, roughly double the consensus estimate of approximately $0.21. The company swung to an operating profit of approximately $1.88 billion, reversing an operating loss of more than $3 billion recorded in the equivalent quarter twelve months earlier. Operations threw off $7 billion in cash across the quarter.
Non-GAAP gross margin expanded to approximately 41.8%, up from approximately 28% one year ago. Management guided Q3 2026 revenue to $15.8-16.8 billion, above prior expectations, signalling confidence that the current trajectory holds.
Intel has now beaten its own guidance on revenue, gross margin, and earnings for seven consecutive quarters, a pattern that distinguishes systematic operational improvement from a single favourable quarter.
| Metric | Q2 2026 Actual | Consensus / Prior Year |
|---|---|---|
| Revenue | $16.1 billion | ~$14.4-15.1B (LSEG consensus) |
| Non-GAAP EPS | ~$0.42 | ~$0.21 (consensus) |
| Gross Margin (Non-GAAP) | ~41.8% | ~28% (Q2 2025) |
| Operating Profit | ~$1.88 billion | Loss exceeding $3B (Q2 2025) |
| Q3 2026 Revenue Guidance | $15.8-16.8 billion | Above prior expectations |
The breadth of this beat matters. Seven consecutive quarters of exceeding management’s own targets across revenue, margin, and earnings is not guidance sandbagging or a single favourable product cycle. It is a pattern, and if you are evaluating Intel stock, you should treat it as evidence of a systematic operational change rather than a one-quarter anomaly.
When big ASX news breaks, our subscribers know first
The $11 billion non-cash charge explained
The GAAP headline looks alarming: a net loss of approximately $11 billion, or $2.16 per share. That figure is driven almost entirely by a non-cash charge of approximately $12.5 billion.
The source of the charge is a mark-to-market adjustment on escrowed shares tied to Intel’s CHIPS Act Secure Enclave agreement with the U.S. government. In plain terms, Intel has an obligation to deliver shares to the government under this programme, and as the share price climbs, accounting rules require the recorded value of that liability to rise in step, producing a paper loss with no cash impact. Core operations were unaffected.
The gap between Intel’s $11 billion GAAP loss and its $0.42 non-GAAP EPS beat illustrates exactly why GAAP vs non-GAAP earnings require separate evaluation; the median non-GAAP EPS exceeds GAAP EPS by roughly 25-30% across the S&P 500, and technology sector gaps frequently reach 40-50%.
Intel’s CHIPS Act Secure Enclave agreement with the U.S. government established the share obligation structure that produces the mark-to-market accounting liability, making the terms of that arrangement directly relevant to understanding both the non-cash charge and the dilution risk it carries.
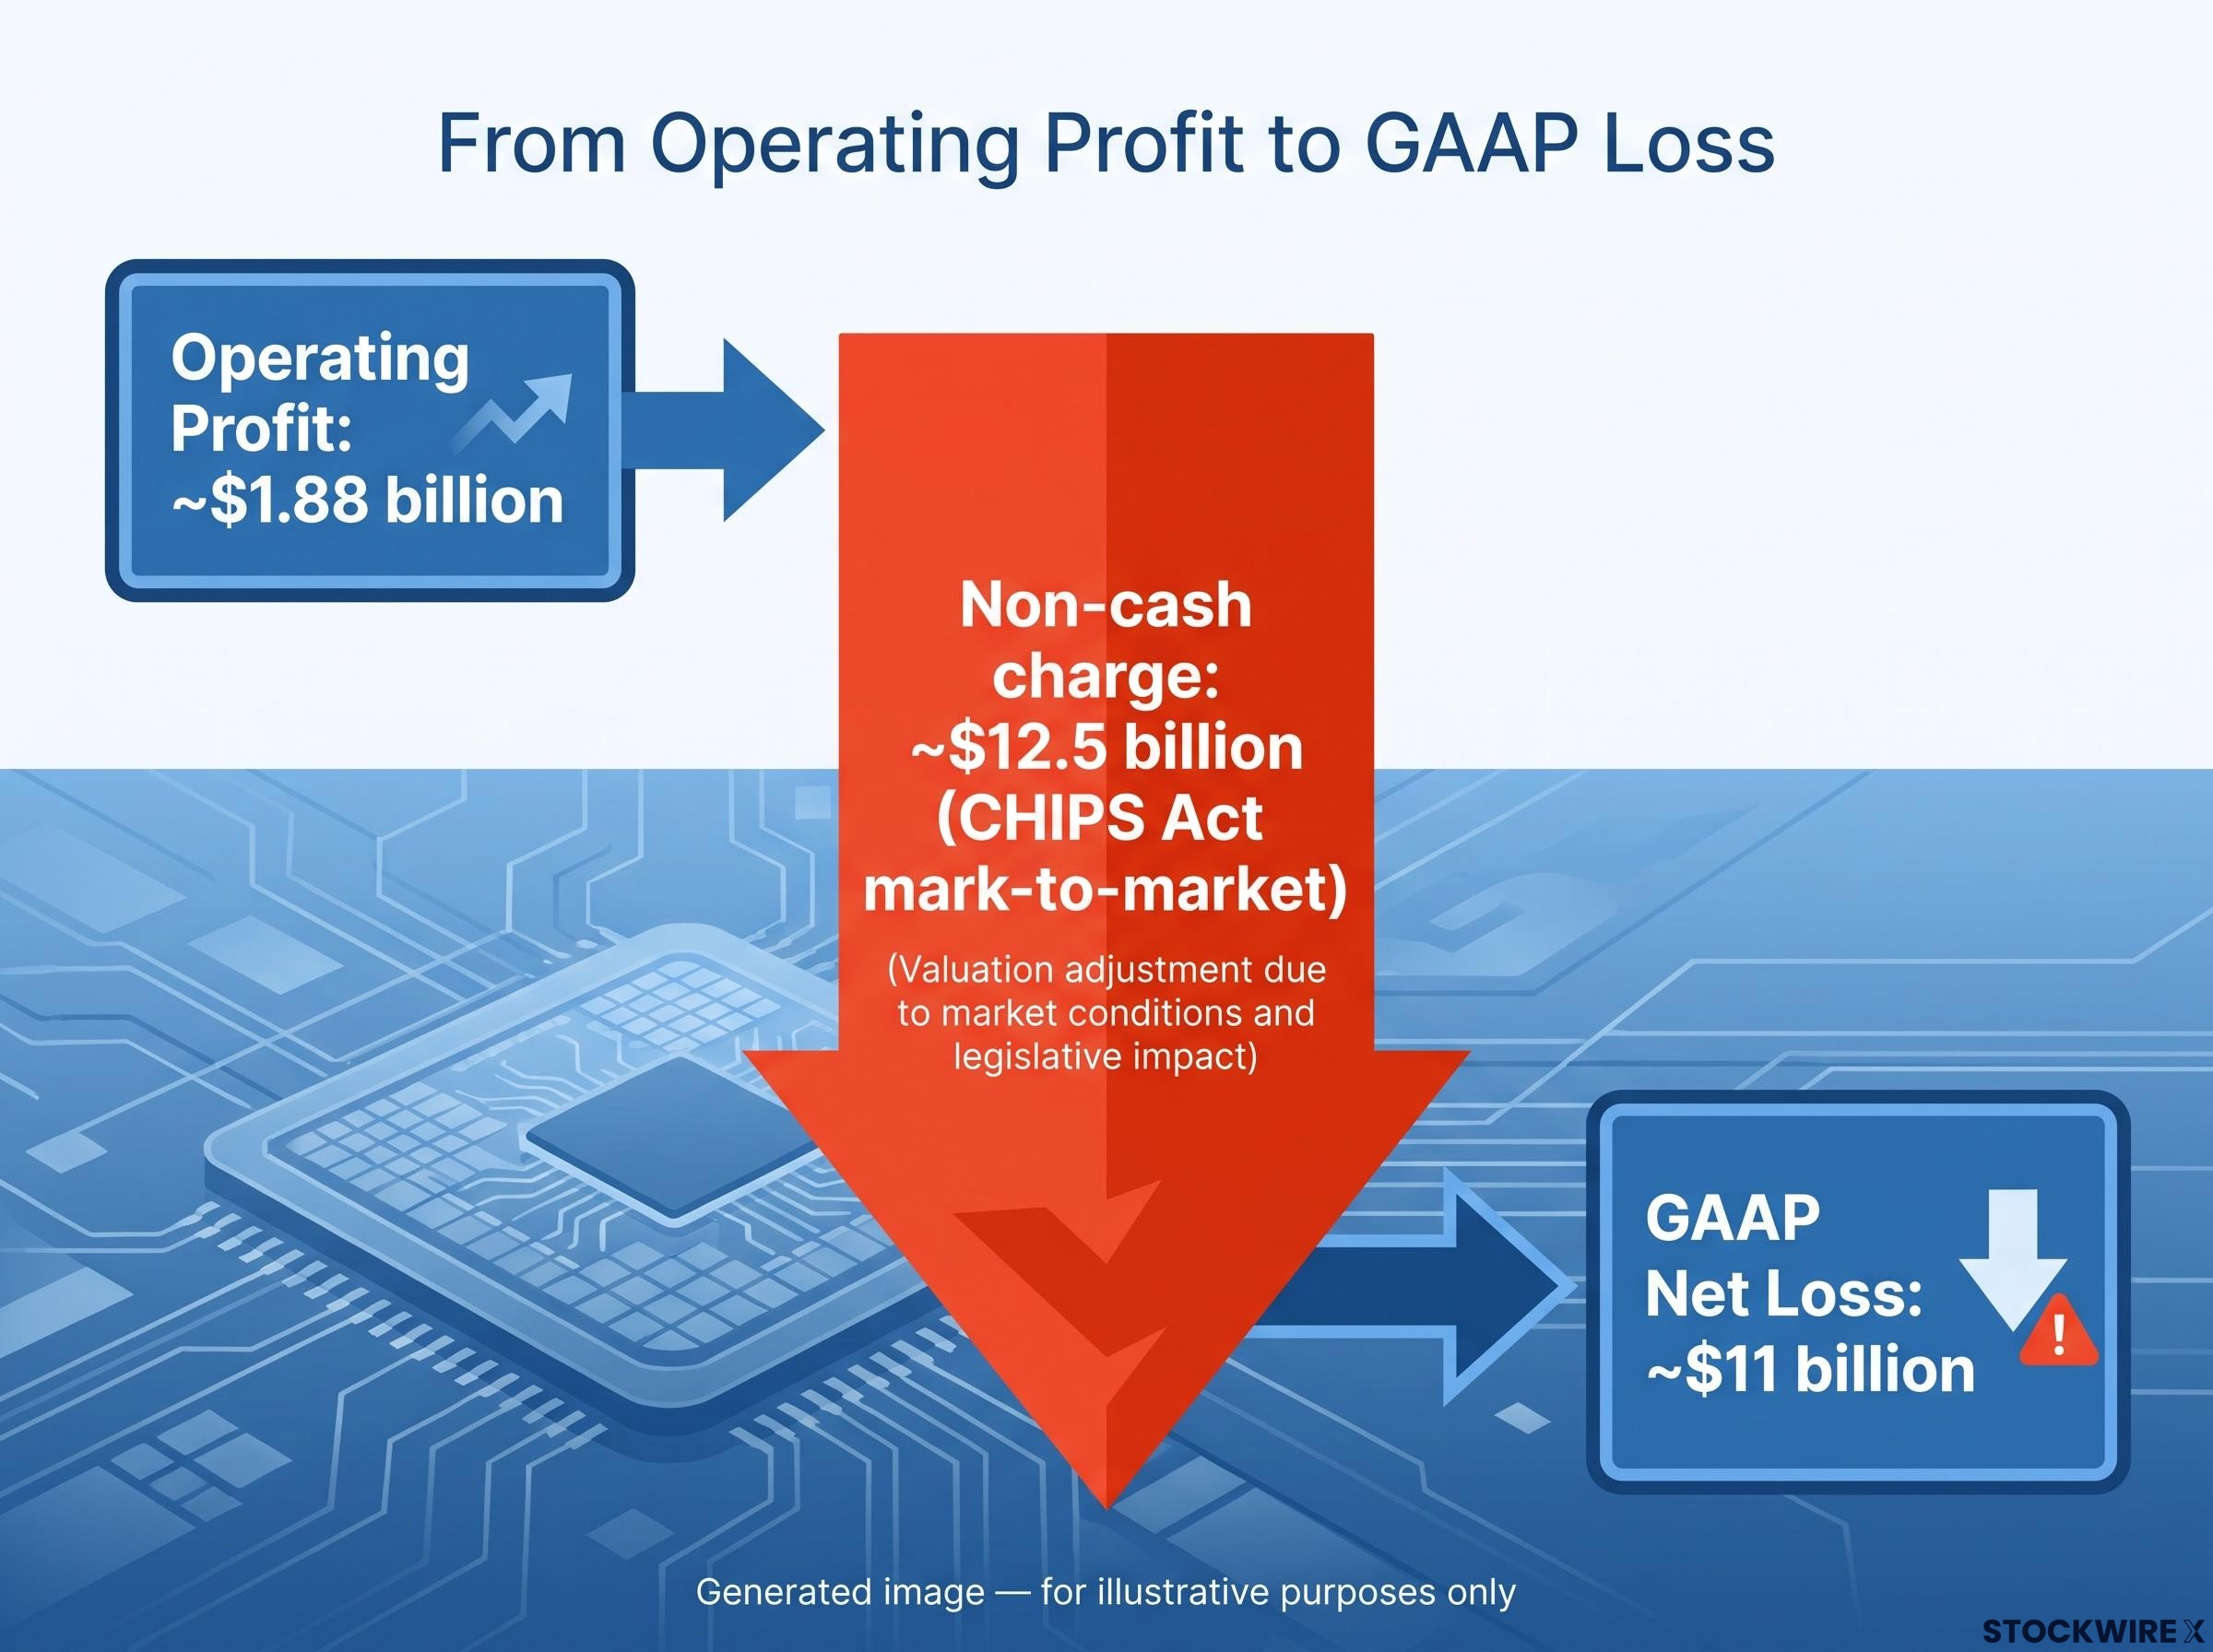
This is the accounting artifact that produces the apparent contradiction between a record operational quarter and a headline loss figure. Intel’s five-year average free cash flow is negative, and its one-year profit margin sits at approximately negative 20%, but that margin figure is substantially driven by non-cash charges of this type rather than by operating losses.
What the charge means for shareholders
Setting aside the accounting noise does not mean setting aside every implication. Two downstream consequences matter:
- Potential future dilution. The CHIPS Act share obligation represents equity that may be issued to the government, diluting existing shareholders. During the Q2 earnings call, the finance chief acknowledged that additional equity issuance remained an option for meeting future capital requirements, keeping dilution firmly on the table as a live risk.
- An unusual accounting feedback loop. A rising share price mechanically increases the mark-to-market liability on the obligation, so improved operational performance can counterintuitively push the reported GAAP loss higher rather than lower.
The GAAP loss is an accounting artifact you can set aside when evaluating operational performance. The dilution risk it represents is something you cannot, and that distinction is what separates an informed reading of these results from a superficial one.
Where the growth is actually coming from
Intel’s aggregate revenue number masks two very different internal economies. The segment breakdown reveals which parts of the business are generating real profit and which are consuming capital on a bet that has not yet proven itself.
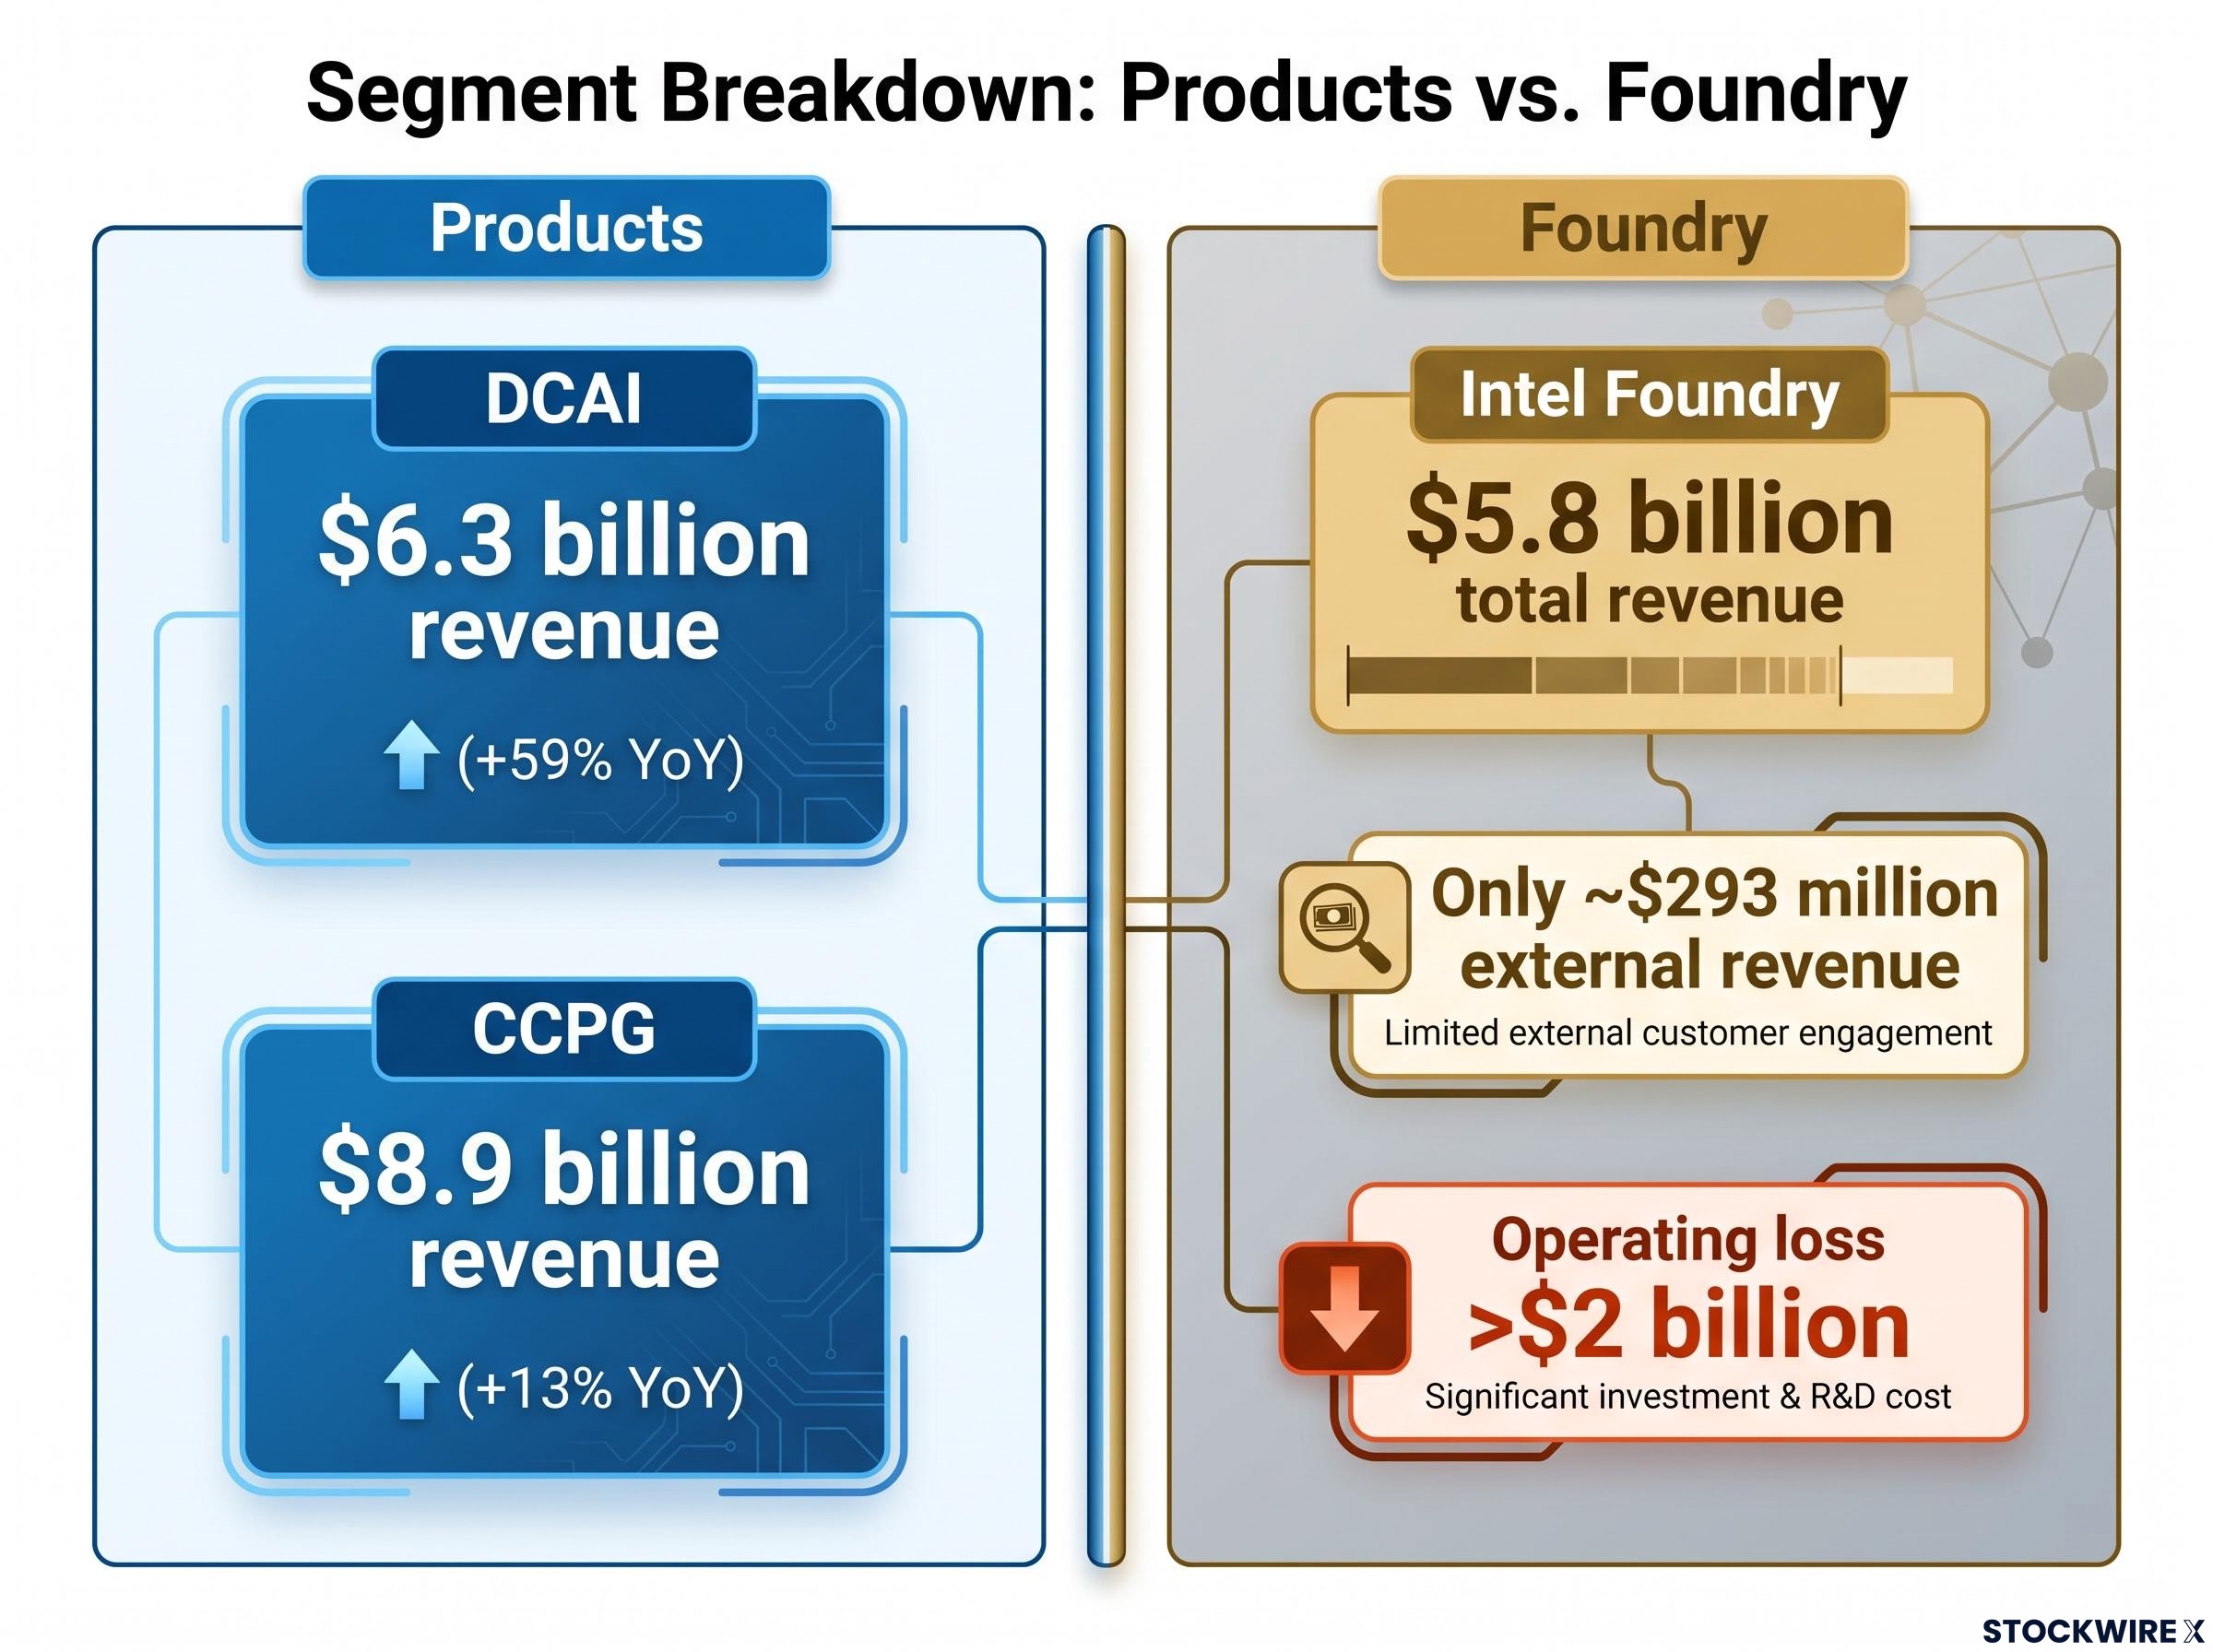
The standout is the Data Centre and AI (DCAI) segment: $6.3 billion in revenue, up 59% year-over-year, with a segment margin of approximately 40% and profits up roughly four times year-on-year. Demand for Intel’s newer Xeon platforms in AI server deployments drove the result, and management indicated that supply, not demand, is the primary constraint. That is a meaningful signal: according to management, available production capacity rather than customer appetite was the binding constraint on shipments.
Client Computing (CCPG) contributed $8.9 billion, up 13% year-over-year. The growth story here is value, not volume. Average selling prices for PC chips increased by approximately 27% as buyers favoured higher-specification AI-capable processors over entry-level alternatives. In a mature PC market, that kind of ASP expansion tells you Intel is monetising capability rather than riding a unit recovery.
Then Intel Foundry, where the numbers require closer scrutiny. Total foundry revenue reached $5.8 billion, up 31% year-over-year, but the composition changes the picture entirely.
Just approximately $293 million of the foundry’s $5.8 billion in revenue originated from third-party customers. The balance represented inter-divisional charges between Intel’s own business units.
The foundry division posted a quarterly operating loss in excess of $2 billion. Across the combined products division (DCAI, CCPG, and Physical AI), profit reached nearly $5 billion at a 32% margin. The products business is carrying the foundry, not the other way around.
| Division | Revenue | YoY Growth | Key Metric |
|---|---|---|---|
| DCAI | $6.3 billion | +59% | ~40% margin; supply-constrained |
| CCPG | $8.9 billion | +13% | ASPs +27%; AI PC mix shift |
| Intel Foundry | $5.8 billion | +31% | ~$293M external; loss >$2B |
What this segment breakdown tells you is that Intel has a genuinely profitable, AI-linked products business and a foundry division that remains a capital-intensive call option. Evaluating the aggregate revenue figure without separating these two realities gives you an incomplete picture of what you are actually buying.
Intel’s vertical silicon strategy, formalised across five Computex 2026 partnerships with Foxconn, Siemens, Hitachi, and others, represents the longer-range thesis behind the DCAI segment’s AI-linked growth: purpose-built processors embedded in industrial and life-sciences markets where regulatory switching costs create defensible revenue positions that commodity CPU competition cannot replicate.
The structural risks that explain the muted stock reaction
The stock’s same-day pullback was not irrational. Four structural risks weigh on Intel’s equity even after a record operational quarter:
- Foundry economics: The strategic thesis is appealing but the economic proof is absent.
- Capex and leverage: Capital intensity constrains how much operational improvement reaches shareholders.
- Dilution risk: Management has not ruled out future equity issuance.
- AI market positioning: Intel’s AI exposure is CPU-centric, not in the highest-margin accelerator market.
The foundry risk is the most visible. No major external chip customer, not Apple, Nvidia, Qualcomm, or AMD, has committed to large-scale use of Intel’s foundry at advanced nodes. The division generated approximately $293 million in external revenue while recording an operating loss exceeding $2 billion in a single quarter. Until a major customer commits, the foundry remains a cost centre, not a revenue driver.
The foundry’s external revenue picture shifted materially in mid-June 2026, when the Apple foundry deal provided the first named commitment at advanced nodes; that agreement covers entry-level silicon on the 18A process with volume production targeted for 2027, leaving the $293 million external revenue figure as the pre-deal baseline against which all subsequent progress will be measured.
Intel’s AI positioning deserves honest framing. The Q2 results show real AI-linked demand in CPUs and AI PCs, but this is structurally different from the GPU accelerator market where Nvidia dominates with substantially higher margins. Intel’s own accelerator products have not materially challenged Nvidia’s position. Where a valuation already prices in Intel as a dominant AI beneficiary, there is a real danger that the market’s assumptions outpace the portion of AI economics Intel can realistically capture.
Capital intensity and the equity return problem
The balance sheet and capex programme create a specific investor concern. This fiscal year, Intel is targeting capital expenditure above $20 billion for factory construction, with guidance pointing to further increases in the year ahead. Gross debt stands at roughly $70 billion, set against annual free cash flow of approximately $2.83 billion in the most recent fiscal year. Across the preceding five years, Intel’s average free cash flow has been negative; the business has only recently turned modestly cash generative.
This combination can produce an outcome that frustrates equity holders: the business improves operationally, but capex, debt service, and dilution absorb the value creation before it reaches per-share earnings. Speaking on the Q2 earnings call, the CFO left the door open to raising additional equity capital, confirming that share issuance remains a practical possibility rather than a remote contingency.
The muted stock reaction, in other words, is rational. Investors are discounting the possibility that Intel’s operational improvement gets absorbed by capital intensity and potential dilution before it reaches shareholders in the form of per-share value growth.
Who should be looking at Intel right now, and who should not
What Q2 2026 actually confirms
The operational inflection is genuine and broad-based. This is not cosmetic improvement or a single-quarter anomaly.
- DCAI’s 59% year-over-year growth and approximately 40% segment margin confirm AI-linked CPU demand as a structural driver, not a cyclical spike.
- Gross margin expansion from approximately 28% to approximately 41.8% year-over-year represents a fundamental cost and mix improvement, not a one-quarter accounting effect.
- Seven consecutive quarters of beating management guidance on revenue, margin, and earnings signal systematic execution, not sandbagged targets.
What remains an open question
The investment case hinges on three unresolved issues, and your risk tolerance determines whether they are acceptable or disqualifying.
- The foundry strategy is strategically compelling but economically unproven. External revenue of approximately $293 million against a quarterly operating loss exceeding $2 billion and no sizeable customer commitments at advanced nodes means the business case has yet to be commercially demonstrated.
- The capital structure presents a long runway before improvement reaches equity holders. $70 billion in debt against a capex programme exceeding $20 billion annually and only recently positive free cash flow raises a serious question about whether operational gains will translate into per-share value or be absorbed by debt service, spending, and dilution.
- Dilution is a live risk. The CHIPS Act share obligation and the CFO’s explicit on-record acknowledgement that further equity issuance has not been ruled out are documented positions from the earnings call, not speculation.
If you believe the foundry will win sizable external customers, AI-driven CPU demand sustains double-digit growth over multiple years, and management navigates capex and dilution without eroding per-share value, Intel fits a turnaround thesis. If you need those questions answered before committing capital, Q2 2026 has not answered them.
Reading Intel’s results without being misled by either the optimists or the bears
Two readings of Q2 2026 are misleading in equal measure. Reading only the $11 billion GAAP loss as evidence of failure misses the fact that it is an accounting artifact driven by a $12.5 billion non-cash charge. Reading only the revenue beat and margin expansion as evidence that the investment case is resolved misses the foundry losses, the capital intensity, and the dilution risk sitting in plain view on the balance sheet.
Q2 2026 confirms that the operational turnaround has genuine substance. The accounting loss does not reflect underlying business health. Neither the bull case nor the bear case has been settled by Q2 results alone.
Three forward variables will resolve the investment question more than any backward-looking metric:
- Foundry external customer commitments at advanced nodes. The $293 million in external foundry revenue is the single most important number to track in future quarters. Movement toward a major customer win would materially change the equity story.
- AI-linked CPU demand trajectory. Whether DCAI’s 59% growth rate sustains double-digit expansion through 2027 will determine if Intel’s AI positioning is a durable revenue driver or a peak-cycle phenomenon.
- Management’s capex and dilution decisions. How the company balances its $20 billion-plus annual capex programme and $70 billion debt load against shareholder dilution over the next two to three years will determine how much of the operational improvement actually reaches per-share value.
The 18A-P node milestone published in mid-June 2026 offered the most direct technical evidence ahead of volume ramp, confirming over 9% performance gains and 18% lower power consumption versus baseline 18A, with design-rule compatibility that lowers adoption friction for any customer evaluating a migration from the original node.
Intel at this stage is a turnaround story in material progress, not a recovery already complete. Whether equity holders ultimately capture that progress will be decided by competitive outcomes and capital allocation choices that the current numbers do not yet reveal.
This article is for informational purposes only and should not be considered financial advice. Investors should conduct their own research and consult with financial professionals before making investment decisions. Past performance does not guarantee future results. Financial projections are subject to market conditions and various risk factors.
—






