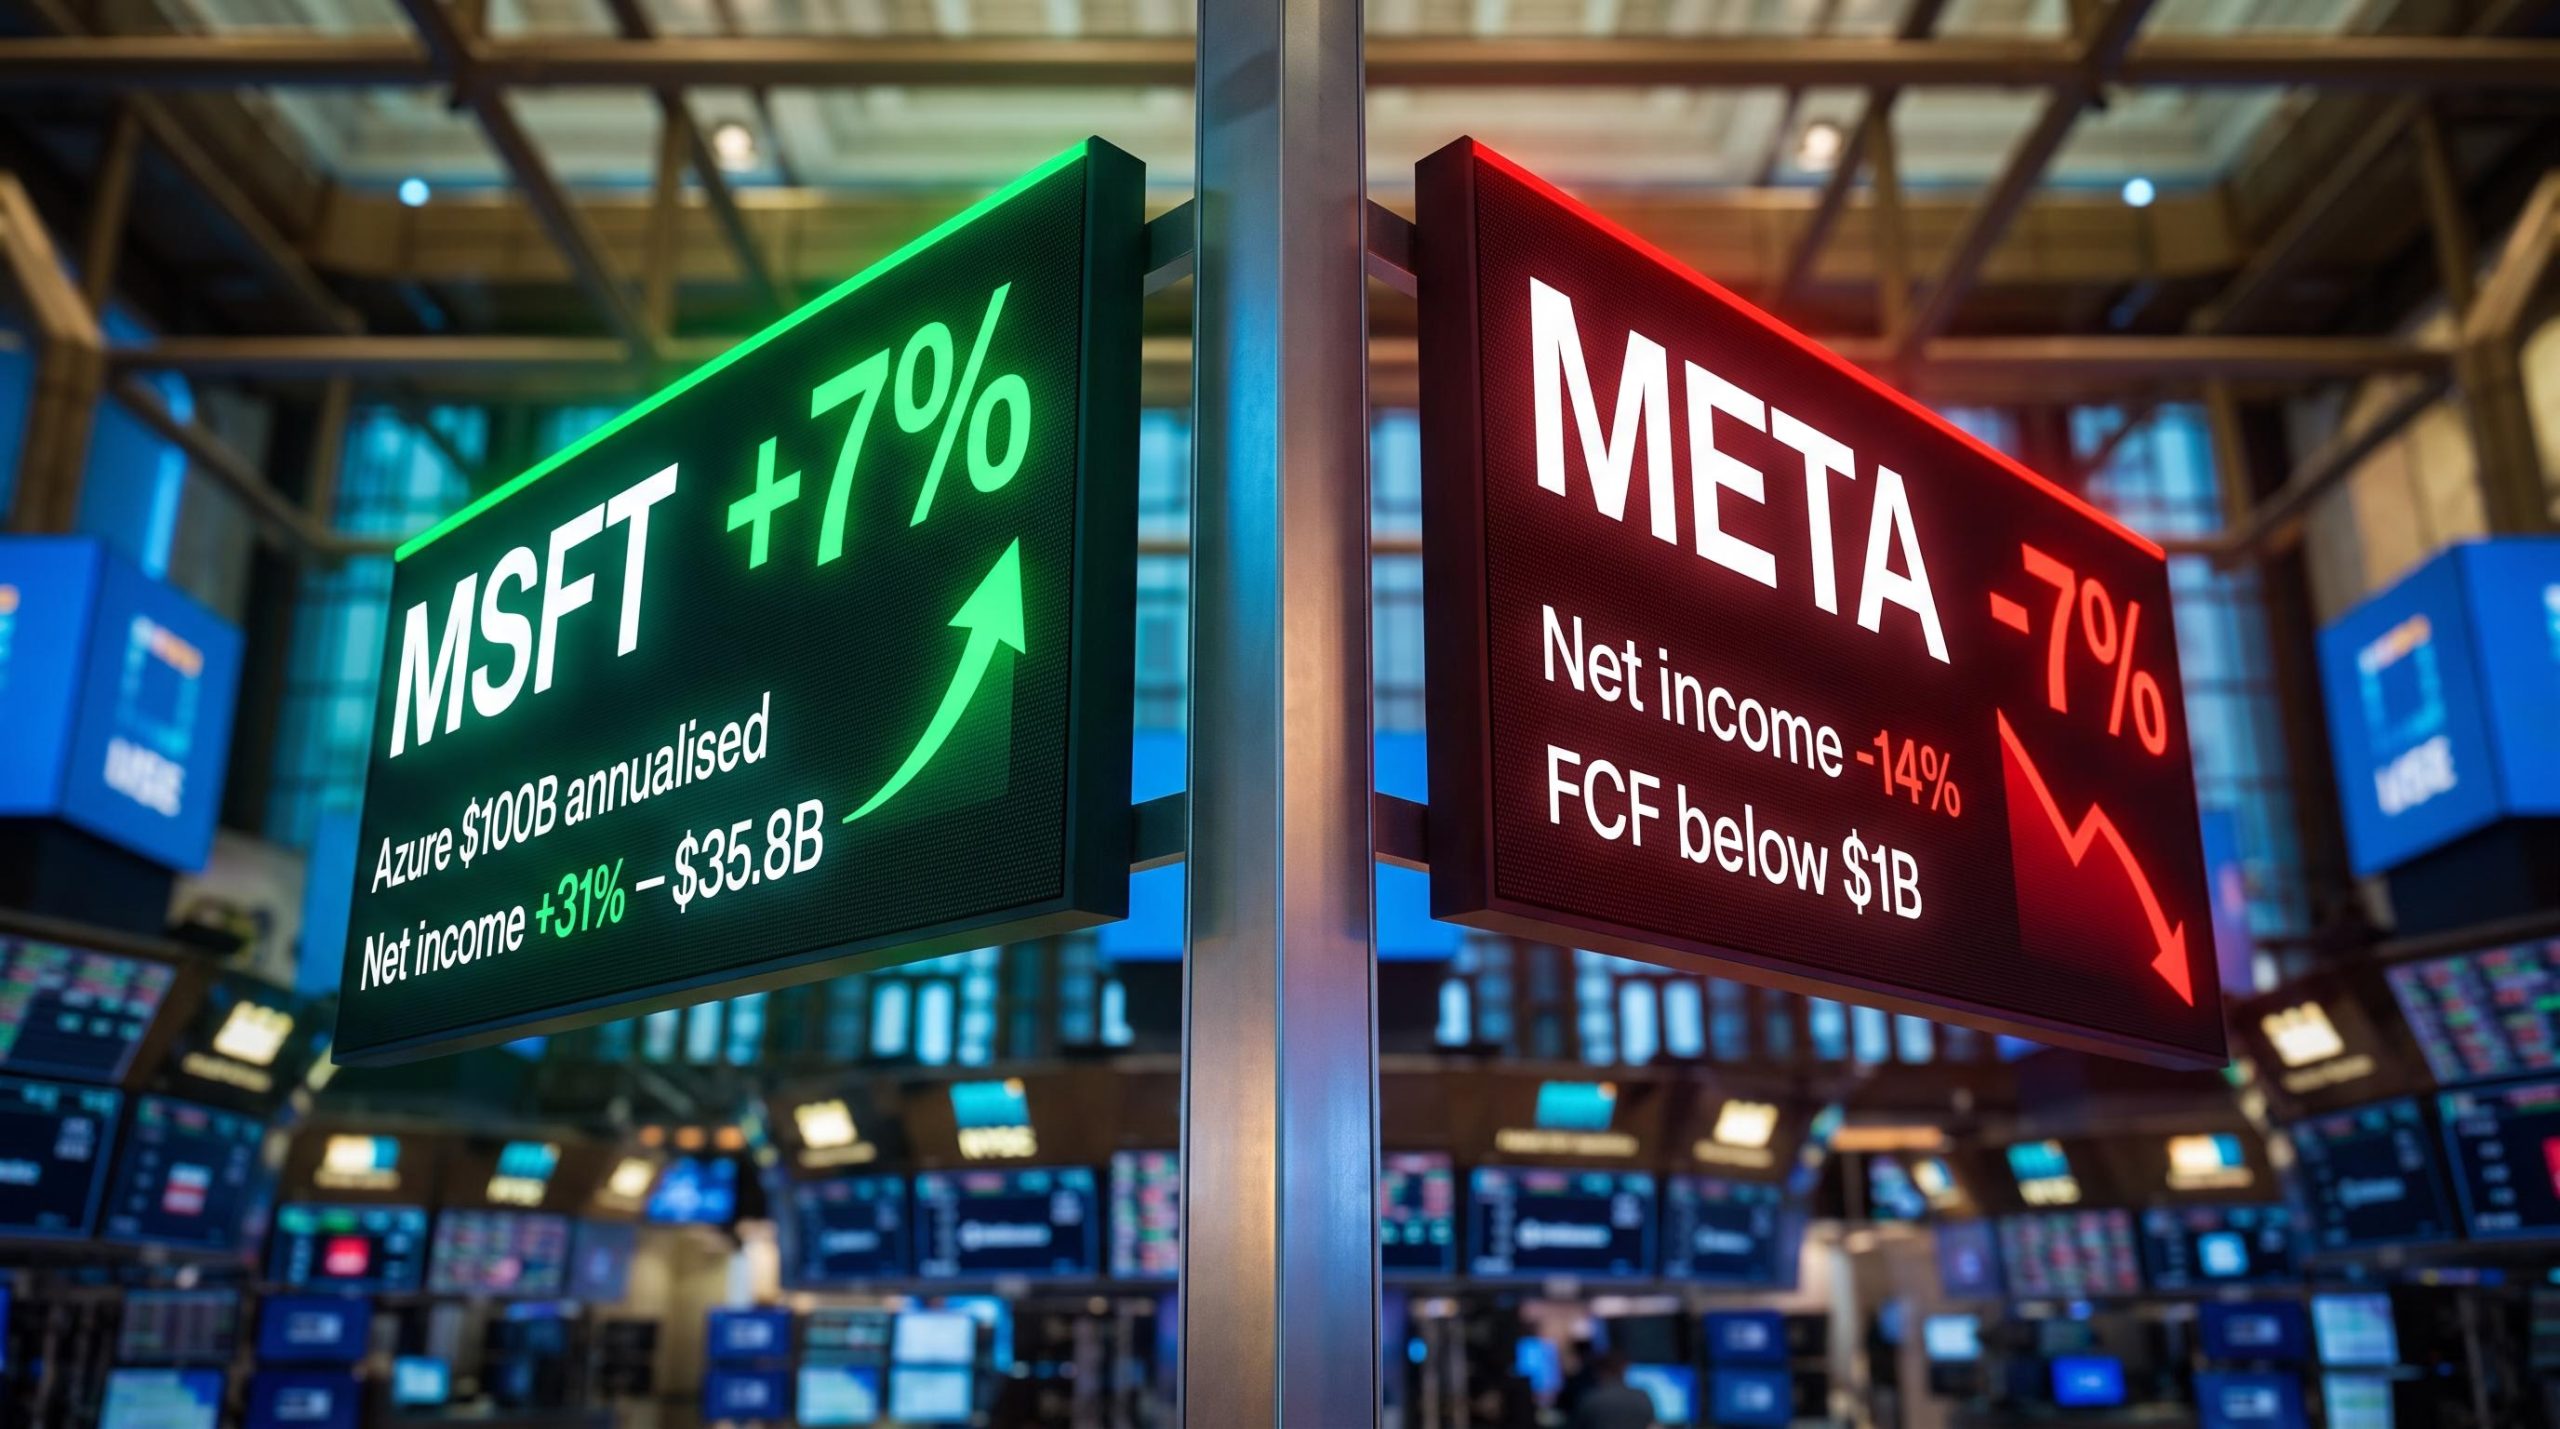
Two megacap technology companies reported earnings within 24 hours of each other on 29-30 July 2026, both announcing AI capital expenditure programmes measured in the hundreds of billions of dollars, and the market sent them in opposite directions. Microsoft shares climbed more than 7% after hours. Meta shares fell more than 7%.
The divergence is not about which company spent more on AI. Meta and Microsoft are committing to nearly identical full-year capex envelopes: Meta at $130-145 billion, Microsoft at $145.3 billion for the fiscal year ended June 2026. The market is asking a different question entirely: is the spending producing visible, trackable financial results right now, or is it consuming cash faster than it generates returns?
Here is the framework for understanding what separated those two reactions, how to apply it to Amazon and Apple (whose results land today), and how to use it across every remaining megacap technology result this earnings season.
Same capex, opposite reactions: what the numbers underneath reveal
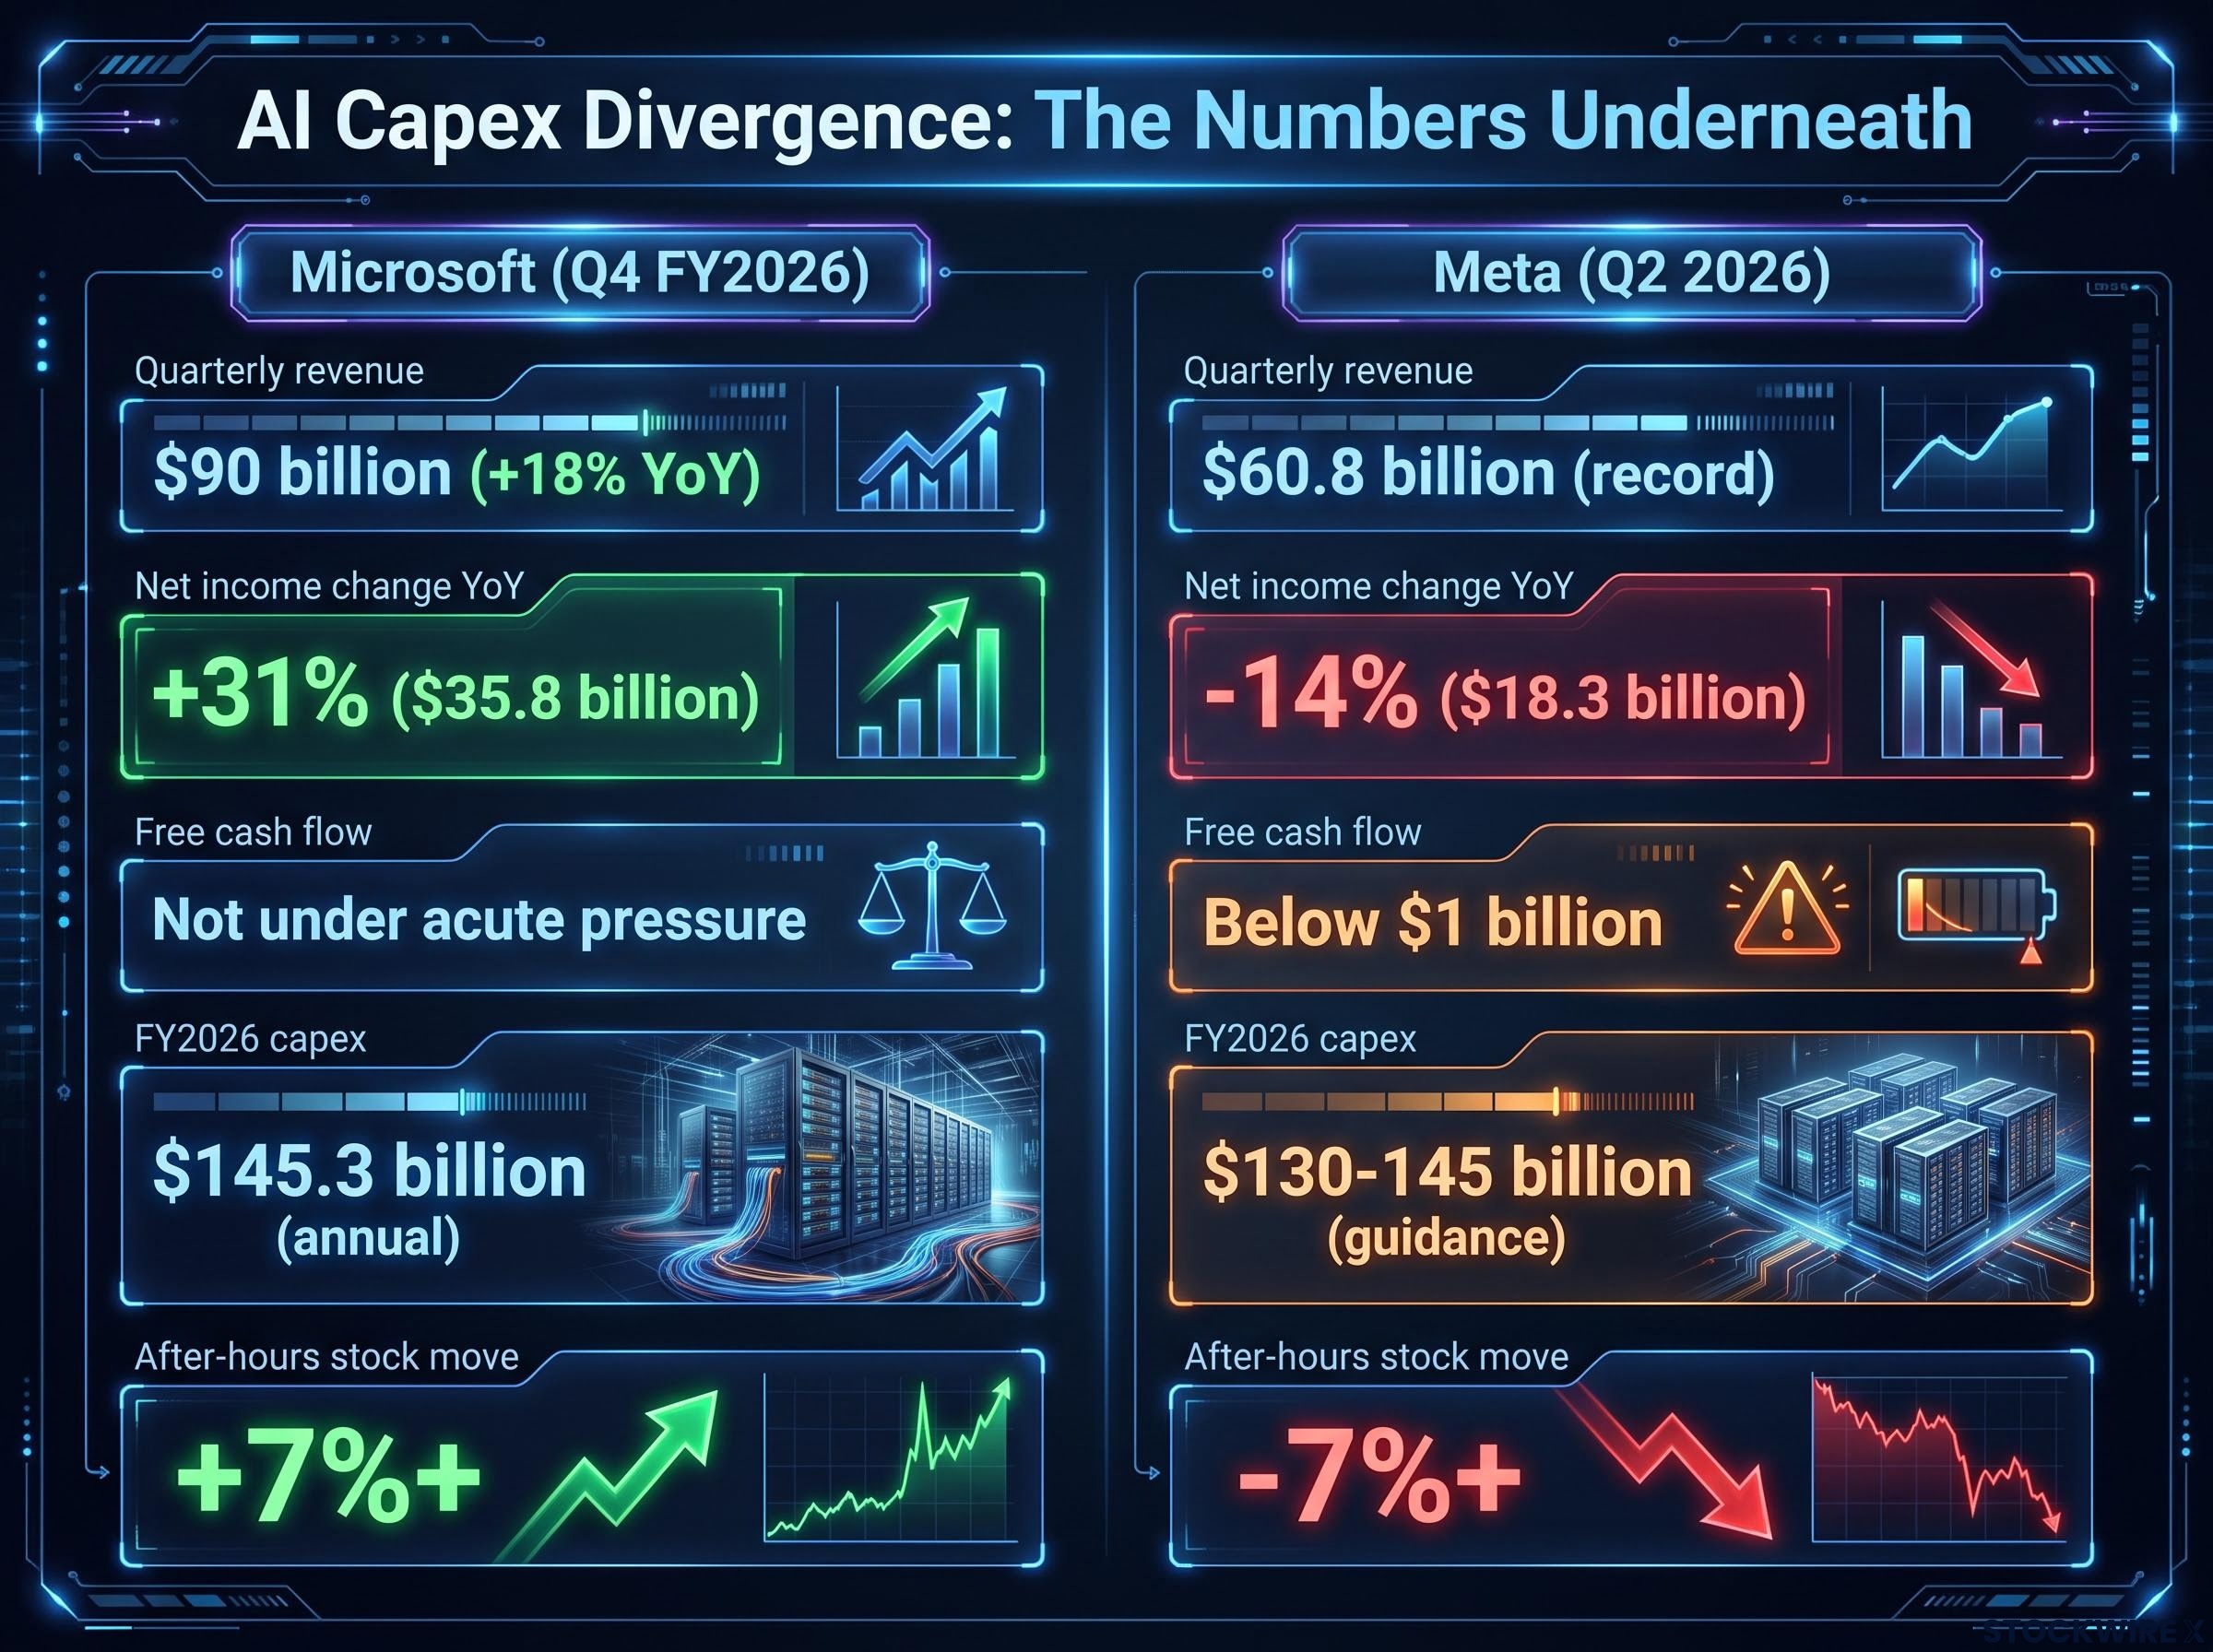
The headline figures for both companies look like variations on the same story. Microsoft posted quarterly revenue of $90 billion, up 18% year over year. Meta posted quarterly revenue of $60.8 billion, a record. Both are spending at a pace that would have been unthinkable two years ago. But the numbers sitting beneath those headlines tell you why the market graded them on entirely different curves.
| Metric | Microsoft (Q4 FY2026) | Meta (Q2 2026) |
|---|---|---|
| Quarterly revenue | $90 billion (+18% YoY) | $60.8 billion (record) |
| Net income change YoY | +31% ($35.8 billion) | -14% ($18.3 billion) |
| Free cash flow | Not under acute pressure | Below $1 billion |
| FY2026 capex | $145.3 billion (annual) | $130-145 billion (guidance) |
| After-hours stock move | +7%+ | -7%+ |
Microsoft’s AI spending coincided with accelerating profit: net income rose 31% to $35.8 billion. Meta’s spending coincided with a 14% drop in net income to $18.3 billion and free cash flow that fell sharply, finishing the quarter at under $1 billion. The capex envelopes are structurally similar. The financial outcomes underneath them are not.
Meta compounded the picture with two additional disclosures:
- Q3 2026 revenue guidance came in below Wall Street expectations, overriding the record Q2 top line
- The company faces active legal proceedings concerning the platform’s influence on adolescent users, with management acknowledging these could give rise to a material financial loss
Equivalent capex scale does not produce equivalent investor reactions. What determines the verdict is whether the spending shows up in profit and cash, not whether it shows up in a press release.
The Q2 2026 result is not the first time this divergence has appeared; hyperscaler spending patterns from Q1 2026 showed Alphabet surging more than 7% on 81% net income growth the same day Meta fell more than 9% on a $20 billion capex revision, establishing the spend-to-revenue conversion test as the dominant market variable before this quarter began.
When big ASX news breaks, our subscribers know first
Why Azure’s $100 billion milestone changed the market’s calculus on Microsoft
One number shifted the conversation. For the fiscal year ended June 2026, Azure surpassed $100 billion in annualised revenue, a threshold the cloud division had never previously reached. In a departure from standard practice, CEO Satya Nadella broke out Azure’s revenue figure publicly for the first time, handing analysts a concrete, trackable benchmark they could set against rival cloud platforms.
That comparison matters. Google’s cloud unit was separately on track toward $100 billion in annualised revenue, making Azure’s milestone a directly comparable signal of hyperscaler-tier cloud AI monetisation. When two of the three largest cloud platforms are independently converging on the same revenue threshold, it tells you the market for AI workloads is producing real, attributable income at scale.
The Microsoft Q4 FY2026 earnings release confirmed Azure revenue surpassed $100 billion annually for the first time, alongside net income of $35.8 billion, providing the concrete financial benchmarks that shifted investor sentiment toward the company’s AI spending posture.
Azure’s annualised revenue topped $100 billion in FY2026, while Microsoft net income rose 31% to $35.8 billion in Q4. Together, these two figures are why the market treated $145.3 billion in annual capex as justified rather than reckless.
This milestone matters because it transforms AI spending from an abstract commitment into a revenue line that can be modelled, compared against competitors, and tracked quarter by quarter. Before this disclosure, investors had to trust that Azure was converting AI infrastructure into revenue. Now they have a number.
The four financial signals investors are now using to grade AI spending
The Microsoft-Meta divergence did not reveal a new framework so much as it made an existing one impossible to ignore. Four questions now sit behind every hyperscaler earnings reaction.
- Is revenue growth visibly accelerating and tied to AI products or workloads? Both companies posted strong revenue. But Microsoft’s 18% growth came with a concrete anchor: Azure at $100 billion annually, with AI workloads identifiable within the cloud stack. Meta’s record revenue, while partially supported by AI-driven ad improvements, lacked a direct attribution line that investors could model independently.
- Is profit and margin direction positive as spending scales? Microsoft posted 31% net income growth on $35.8 billion in quarterly profit; the spending was not compressing the bottom line. Meta showed a 14% decline in net income despite record revenue, telling you the AI build-out is currently consuming more margin than it is creating.
- Is free cash flow holding up against the AI build-out? Free cash flow (the cash a company generates after accounting for capital expenditures) has become the sharpest single indicator. Meta’s FCF dropped to below $1 billion against $130-145 billion in annual capex guidance. That is the clearest illustration in the current earnings cycle of spending outpacing cash generation.
PIMCO estimates that the capex-to-cash-flow ratio across the hyperscaler group now sees AI capital expenditure absorbing 93-94% of operating cash flow, up from 33-40% in 2022-2023, which reframes Meta’s sub-$1 billion free cash flow quarter not as an outlier but as the most visible expression of a sector-wide structural shift.
- Is there a direct, near-term revenue line connected to AI infrastructure spend? Microsoft has one: Azure. Meta does not, at least not yet. Its AI improvements to ad targeting and engagement contribute to revenue indirectly, but the company cannot point to a single, trackable line where investors can verify the spend-to-revenue conversion in real time.
| Framework signal | Microsoft (Q4 FY2026) | Meta (Q2 2026) |
|---|---|---|
| Revenue tied to AI | Azure at $100B annually | Indirect (ad targeting) |
| Margin direction | Net income +31% | Net income -14% |
| FCF pressure | Not acute | Below $1 billion |
| Clear AI revenue line | Yes (Azure) | No direct line |
These four questions are the filter you should apply to every hyperscaler earnings release this season. A company that cannot answer at least three of them clearly is likely to face the same investor scepticism that hit Meta in Q2 2026.
Understanding the integrator versus platform divide in AI monetisation
The reason the market grades Microsoft and Meta on different curves is structural. They are running fundamentally different AI monetisation models, and each model produces a different kind of proof.
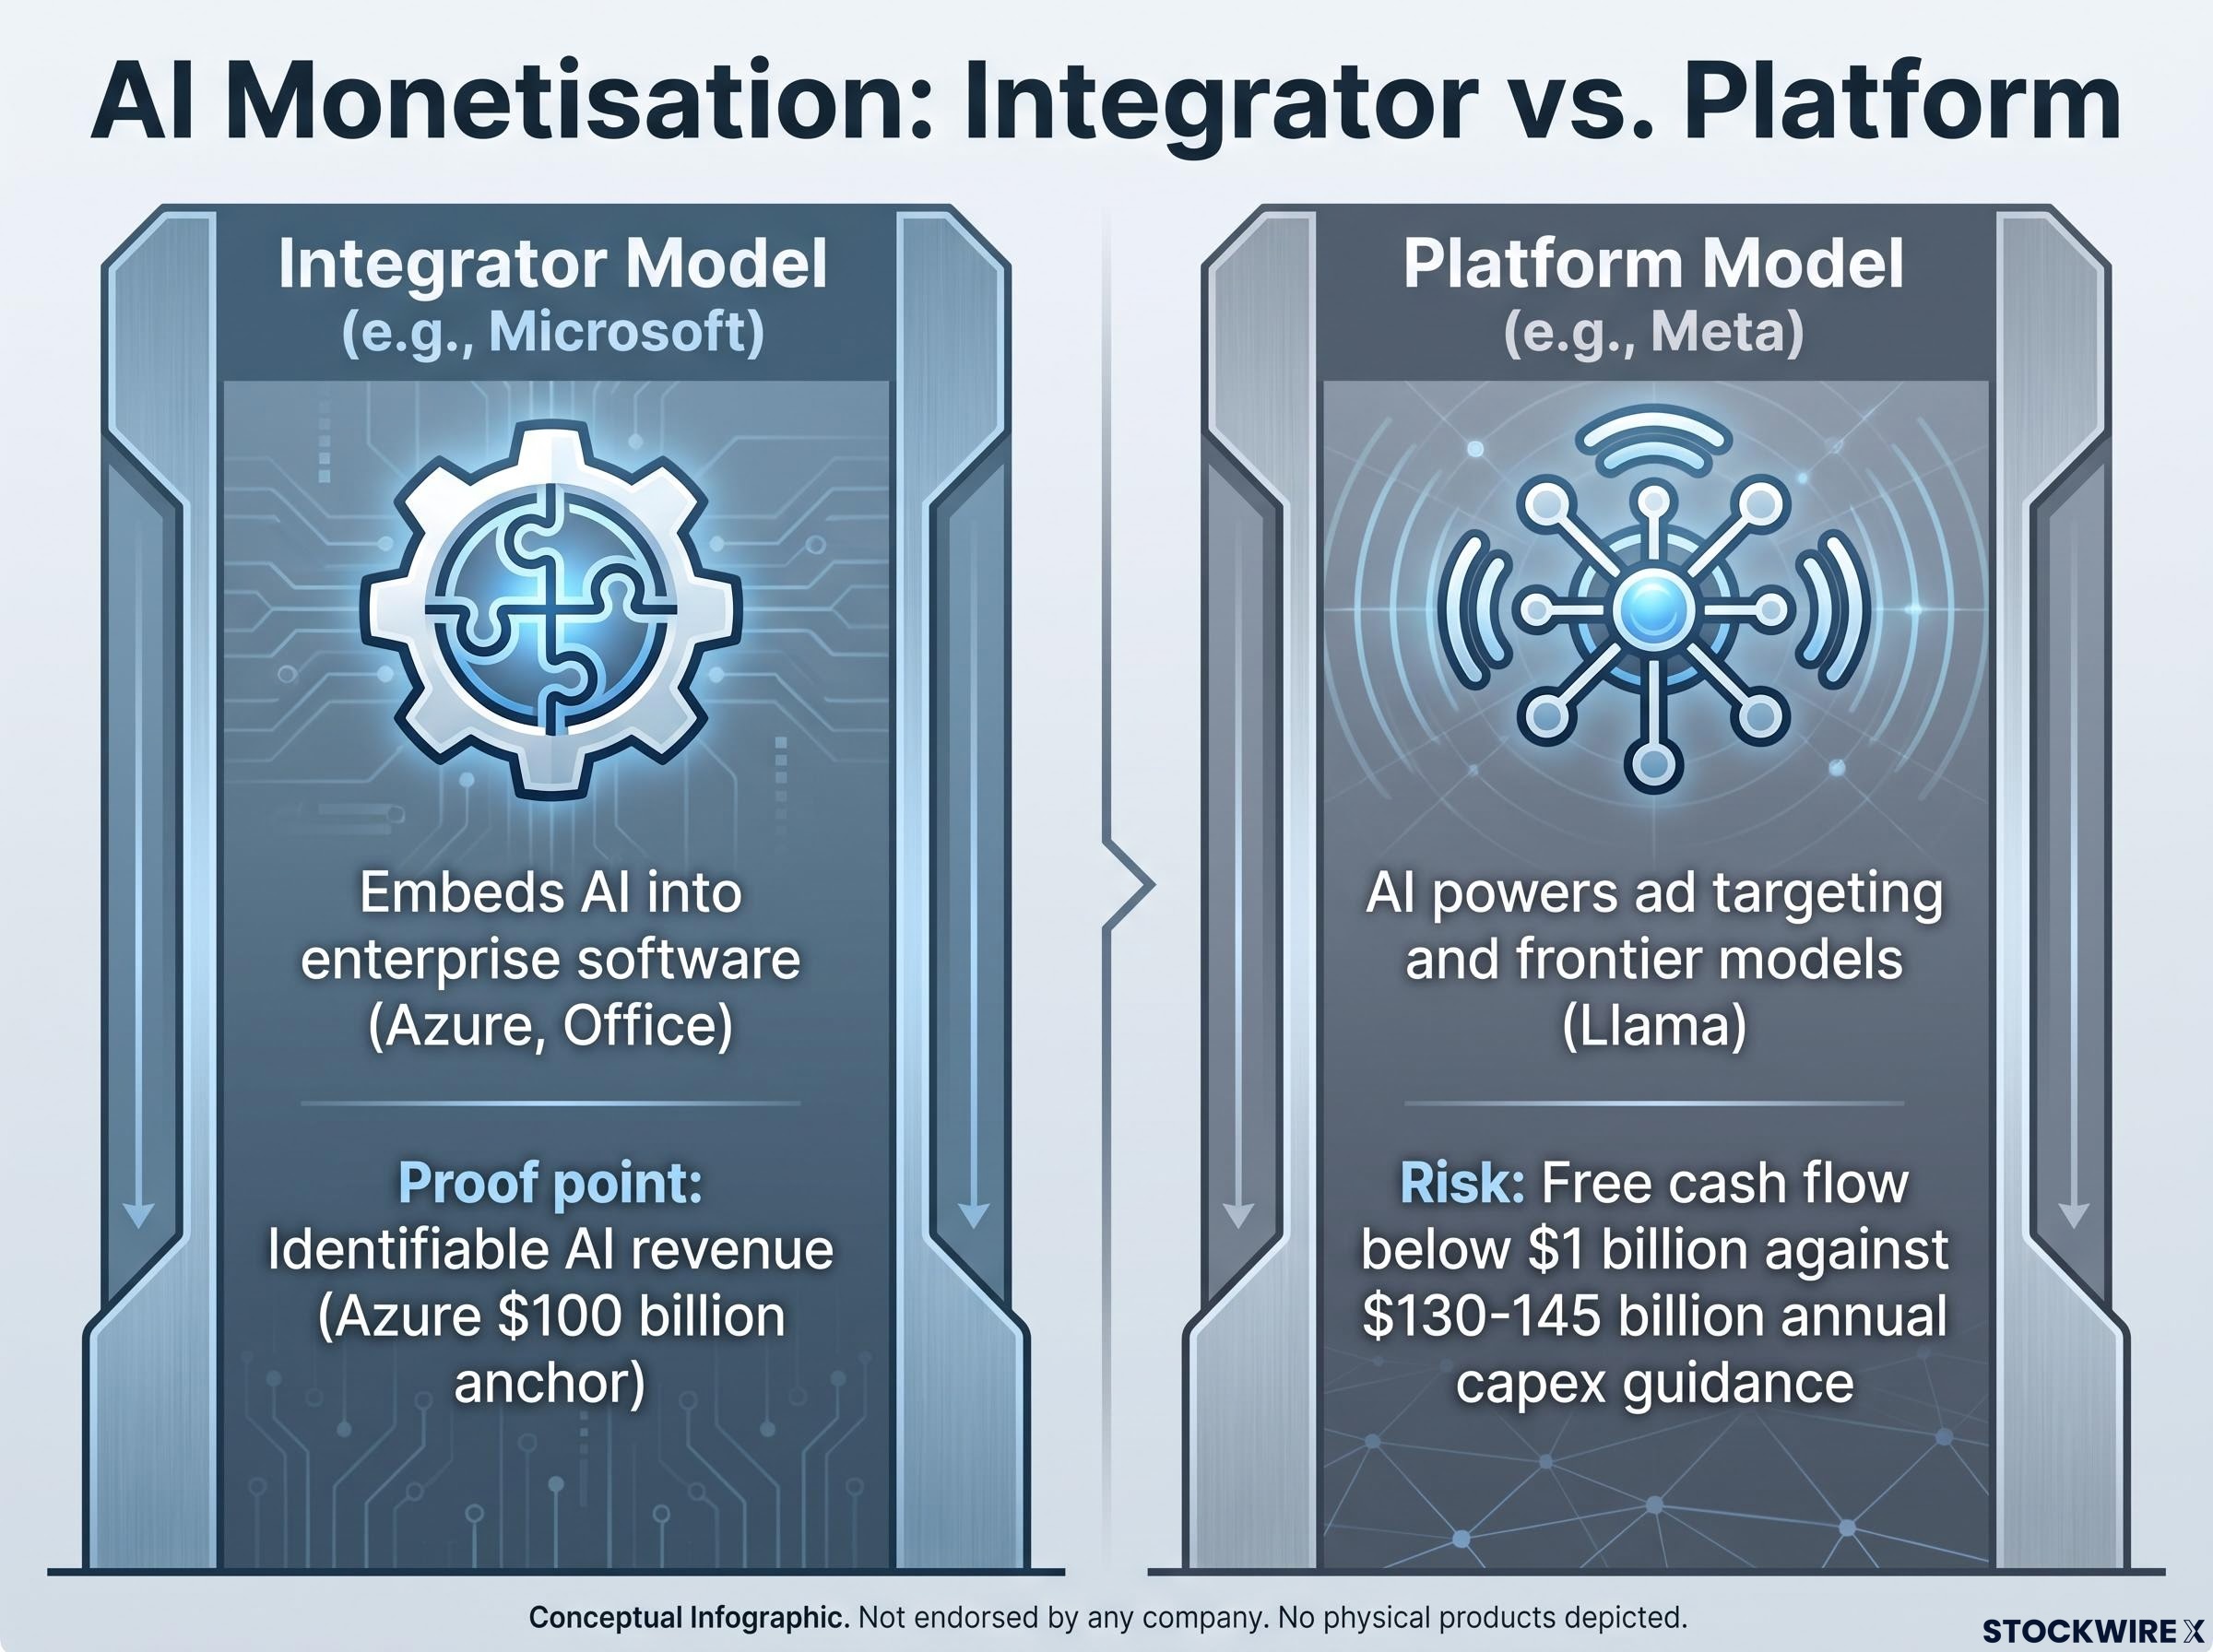
- Revenue attribution: The integrator model (Microsoft) embeds AI directly into existing enterprise software products, primarily Azure cloud services and Office productivity tools. This produces identifiable, AI-related revenue that investors can attribute to specific infrastructure spend. The platform model (Meta) uses large-scale frontier model and infrastructure investment to power improved ad targeting and user engagement, with monetisation primarily indirect. Direct product revenue from AI (standalone tools, subscriptions) sits further out on the timeline.
- Investor patience: The integrator model gives investors a near-term attribution line. Azure’s $100 billion milestone is the anchor. The platform model asks investors to trust that AI is improving the core advertising engine and that new monetisation paths will materialise later. Meta’s investments in Llama and related frontier models represent longer-horizon bets where payoff timelines are less defined.
- Risk profile: When the integrator model faces a bad quarter, investors can look at a specific revenue line to gauge whether the setback is temporary. When the platform model faces a bad quarter, there is no equivalent diagnostic tool, and investor tolerance narrows.
The structural vulnerability the platform model creates connects directly to a broader debate about foundation model economics: BCA Research has argued that companies deploying massive capital into interchangeable, commoditised AI output face airline-like return dynamics, where high fixed costs meet near-zero switching costs, irrespective of whether they are hyperscalers or pure-play model providers.
- FCF vulnerability: A platform model company burning through cash without a direct attribution line faces a compounding credibility problem. Each quarter of FCF deterioration erodes the narrative further.
When a company running the platform model reports free cash flow below $1 billion against $130-145 billion in annual capex guidance, and cannot point to a direct, near-term revenue line that validates the spend, the market’s patience contracts sharply. That is exactly what happened to Meta in Q2 2026.
When you evaluate any large-cap technology company’s AI spending, the first question to answer is which model it is operating under. That determines how much proof of near-term monetisation the market will require.
Applying the framework to Amazon and Apple, whose results land today
Both Amazon and Apple are scheduled to report earnings today, 30 July 2026. The framework from the Microsoft-Meta comparison applies directly, though the questions differ by company.
Amazon: the AWS integrator model under scrutiny
Amazon’s test is whether AWS confirms the integrator model as repeatable across hyperscalers, analogous to Azure’s trajectory at Microsoft.
- AI workload attribution: Does AWS revenue growth visibly accelerate in a way that reflects AI workloads, specifically model hosting, training services, and custom silicon like Trainium and Inferentia? If it does, investors can draw the same kind of spend-to-revenue line that rewarded Microsoft.
- Margin trajectory: Do margins remain stable or improve as AI services scale? If AI workloads are high-value enough to absorb infrastructure costs, that is a positive signal. If margins compress while capex climbs, the reaction may echo Meta’s.
- FCF stability: Free cash flow holding steady or growing through the AI build-out would confirm that Amazon is converting spend into cash-generative services, not just capacity. The Trainium and Inferentia custom silicon angle adds a layer here: proprietary chips for AI workloads could indicate intensity of demand that is harder for competitors to replicate.
If AWS reports strong, AI-attributed revenue growth with stable margins today, it will confirm that the integrator model works across hyperscalers, not just at Microsoft. That has direct implications for how you should think about the sector’s aggregate valuation.
Apple: a different kind of AI earnings test
Apple’s AI strategy differs structurally from the hyperscaler infrastructure build-out. Its investments are device- and ecosystem-centric: on-device models, Apple Intelligence features, and silicon optimisation rather than data-centre construction at hyperscaler scale.
- Hardware upgrade cycles: Are AI features materially raising average selling prices or shortening the time between device upgrades? This is the revenue signal that matters most for Apple’s AI story.
- Services ARPU: Is AI expanding services revenue and margins through higher engagement and upsell into paid tiers? Services revenue per user (ARPU, or average revenue per user) moving higher would tell you AI is deepening ecosystem lock-in.
- FCF risk profile: Because Apple’s capex intensity is structurally lower than the hyperscalers’, free cash flow pressure is not the primary concern. The question is entirely about whether AI features generate meaningful incremental revenue and margin, not whether spending is sustainable.
For Apple, the AI capex bar is low. The earnings test is whether AI moves the revenue and margin needle, not whether the company can afford the build-out.
The Apple Intelligence monetisation timeline extends well beyond this earnings cycle; Citi data confirms the iPhone replacement cycle remains at roughly four years with no AI-driven compression yet visible, which means the revenue test for Apple’s AI investment is fundamentally a 2027-2028 question rather than a metric investors can read in today’s result.
What the permission to spend actually looks like, and when markets revoke it
The Microsoft-Meta divergence reduces to a single principle. The hyperscalers that can draw a clear, data-backed line from AI infrastructure investment to tangible revenue, profit, and cash earn the market’s continued permission to spend aggressively. Those that cannot find that sheer budget size becomes a liability, no matter how strong the top-line revenue print.
That permission is not permanent. It is re-evaluated every 90 days when earnings arrive. Earlier in 2026, investor reception ran in the opposite direction: Microsoft faced scepticism about spend-to-monetisation gaps, while Meta saw its share price rally after raising capex guidance in a period when revenue growth and investor sentiment were both running strongly positive. By Q2 2026, the positions had reversed. Microsoft delivered the Azure milestone and 31% net income growth. Meta delivered record revenue with collapsing free cash flow.
The hyperscalers that draw a clear line from AI spend to revenue, profit, and cash earn the permission to keep spending. Those that cannot find that sheer budget size becomes a liability rather than a signal of competitive strength.
This framework is not about which company is winning the AI race in a technical sense. It is about which company is winning the financial credibility test that markets run every 90 days. Meta’s free cash flow dropping to below $1 billion against $130-145 billion in annual capex guidance is the starkest illustration of what revoked permission looks like. Microsoft’s Q4 FY2026 result, with Azure at $100 billion and net income up 31%, is what earned permission looks like.
The 90-day financial credibility test is the lens you should apply to every AI spending announcement from a megacap technology company: not whether the investment is strategically sound, but whether the current quarter’s financials justify continuing to trust that it will pay off.
This article is for informational purposes only and should not be considered financial advice. Investors should conduct their own research and consult with financial professionals before making investment decisions. Past performance does not guarantee future results. Financial projections are subject to market conditions and various risk factors.