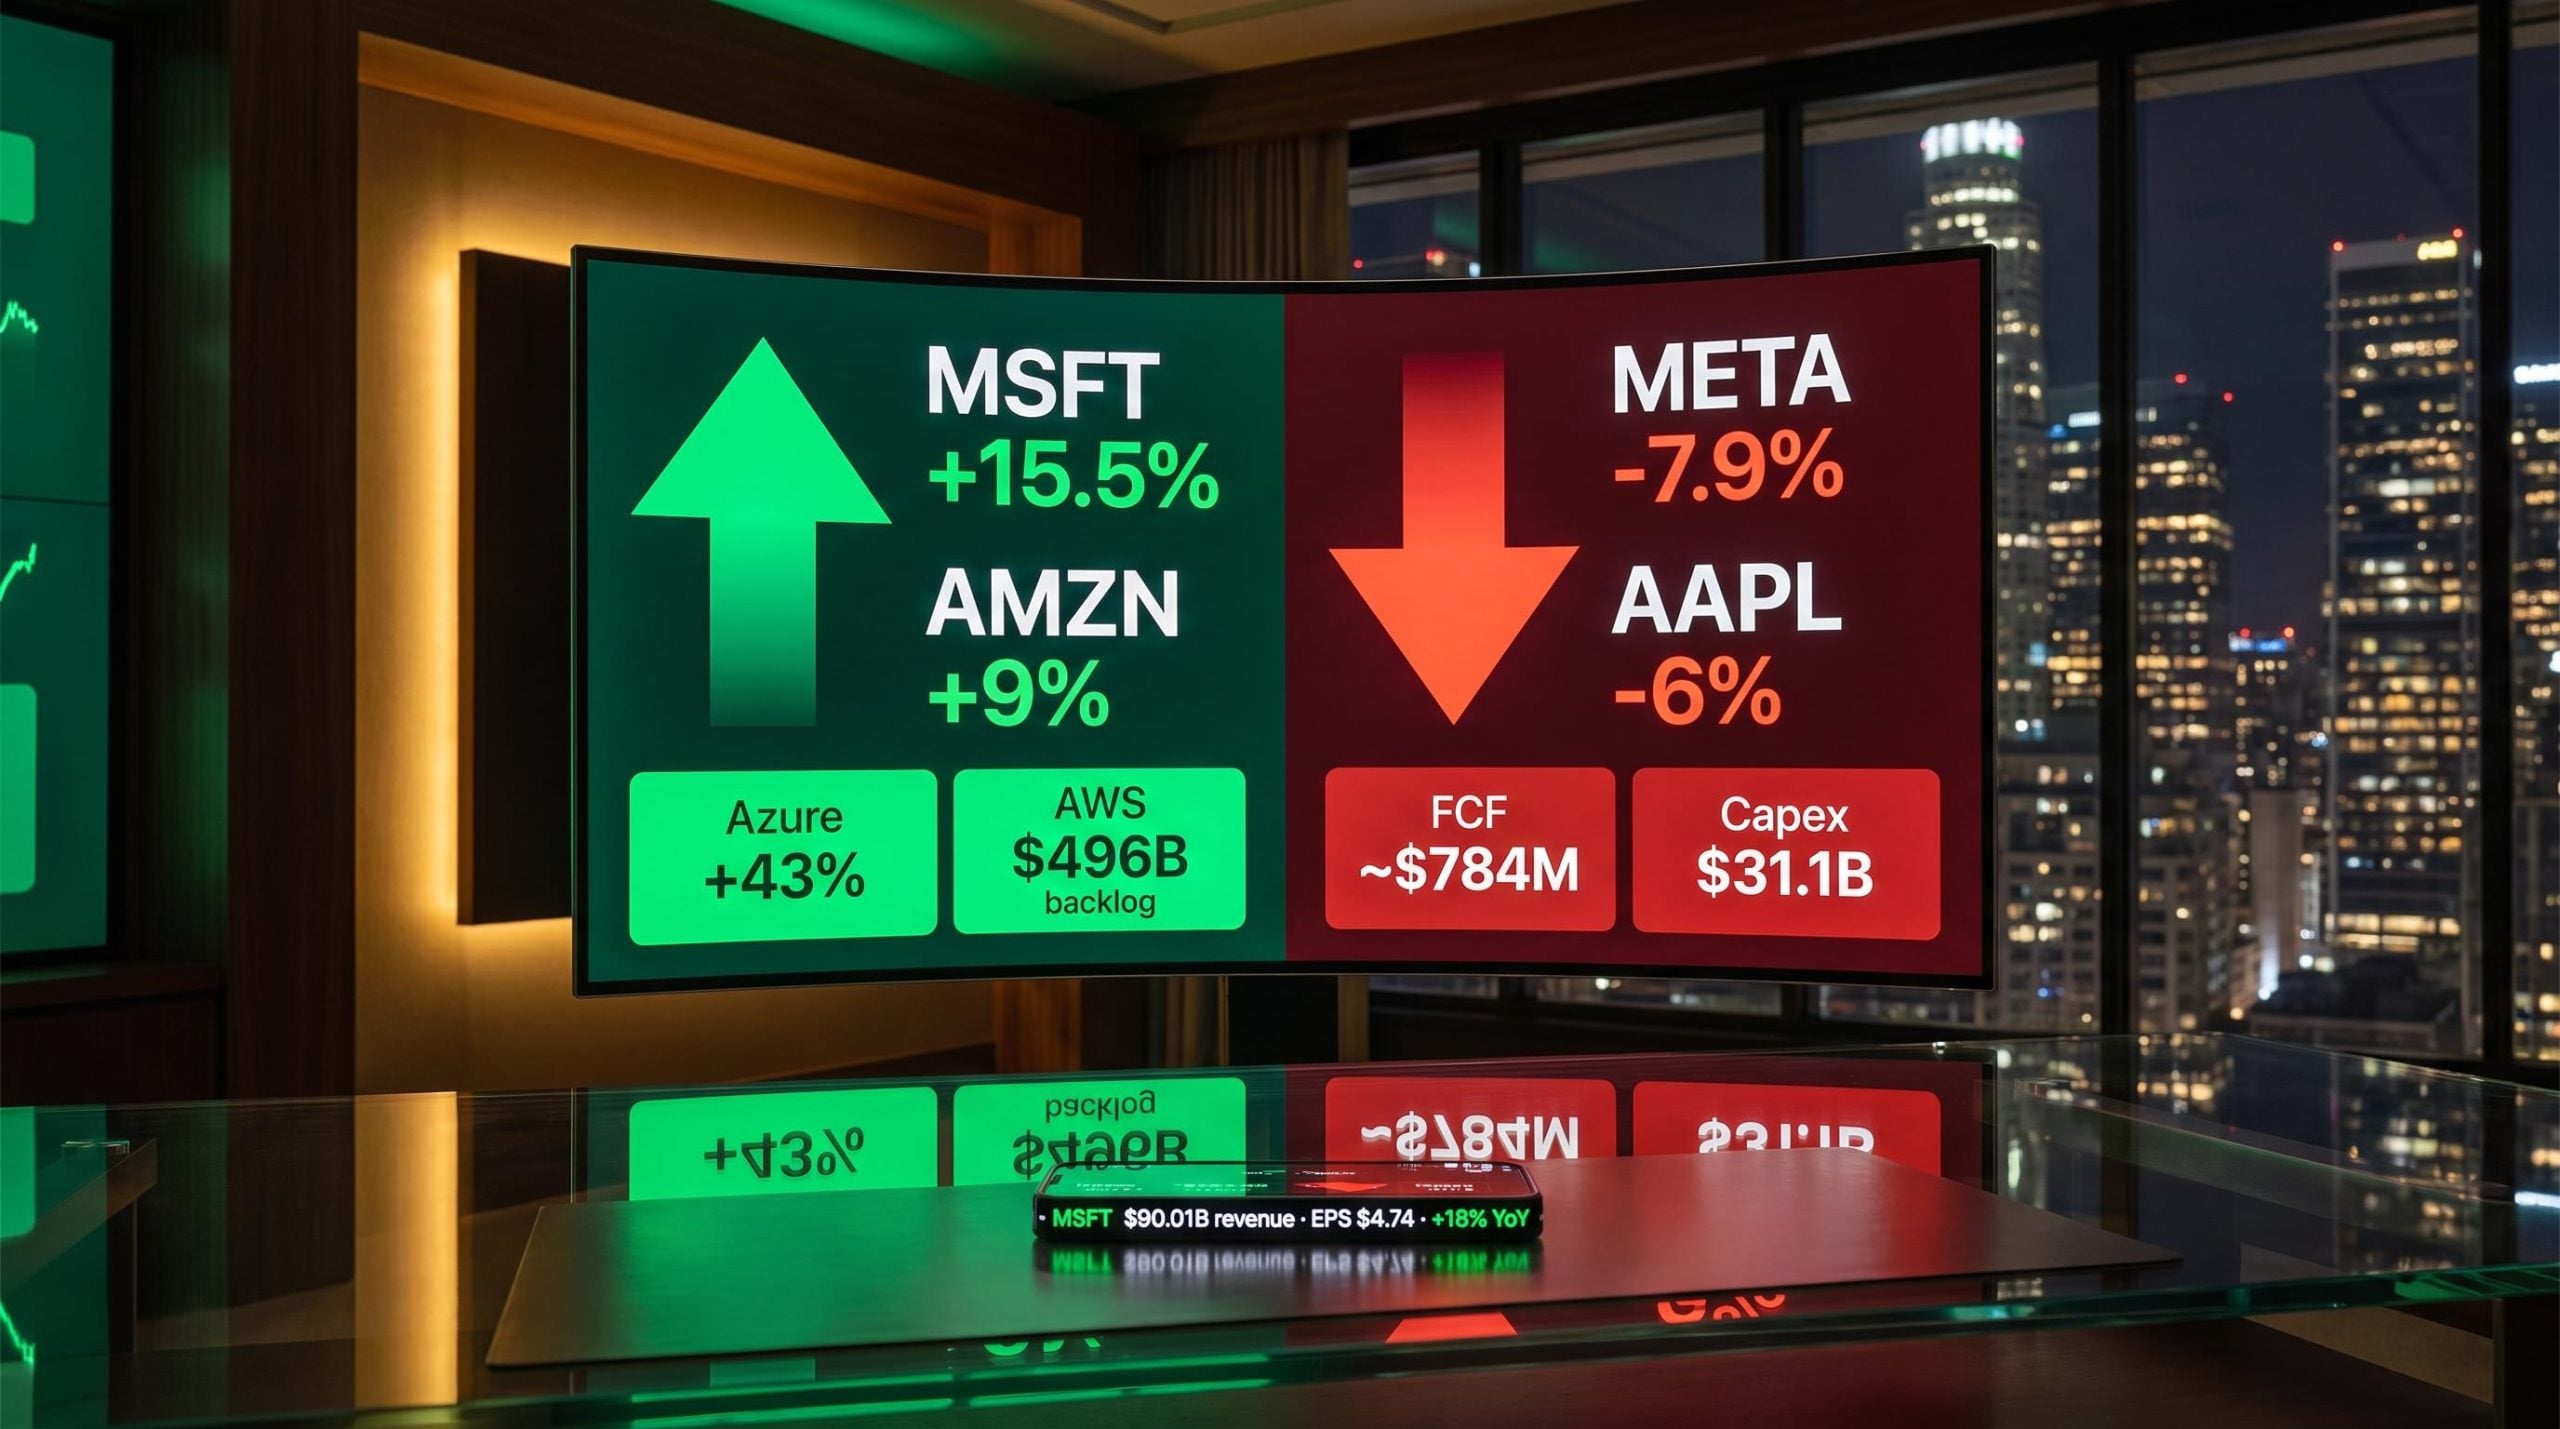
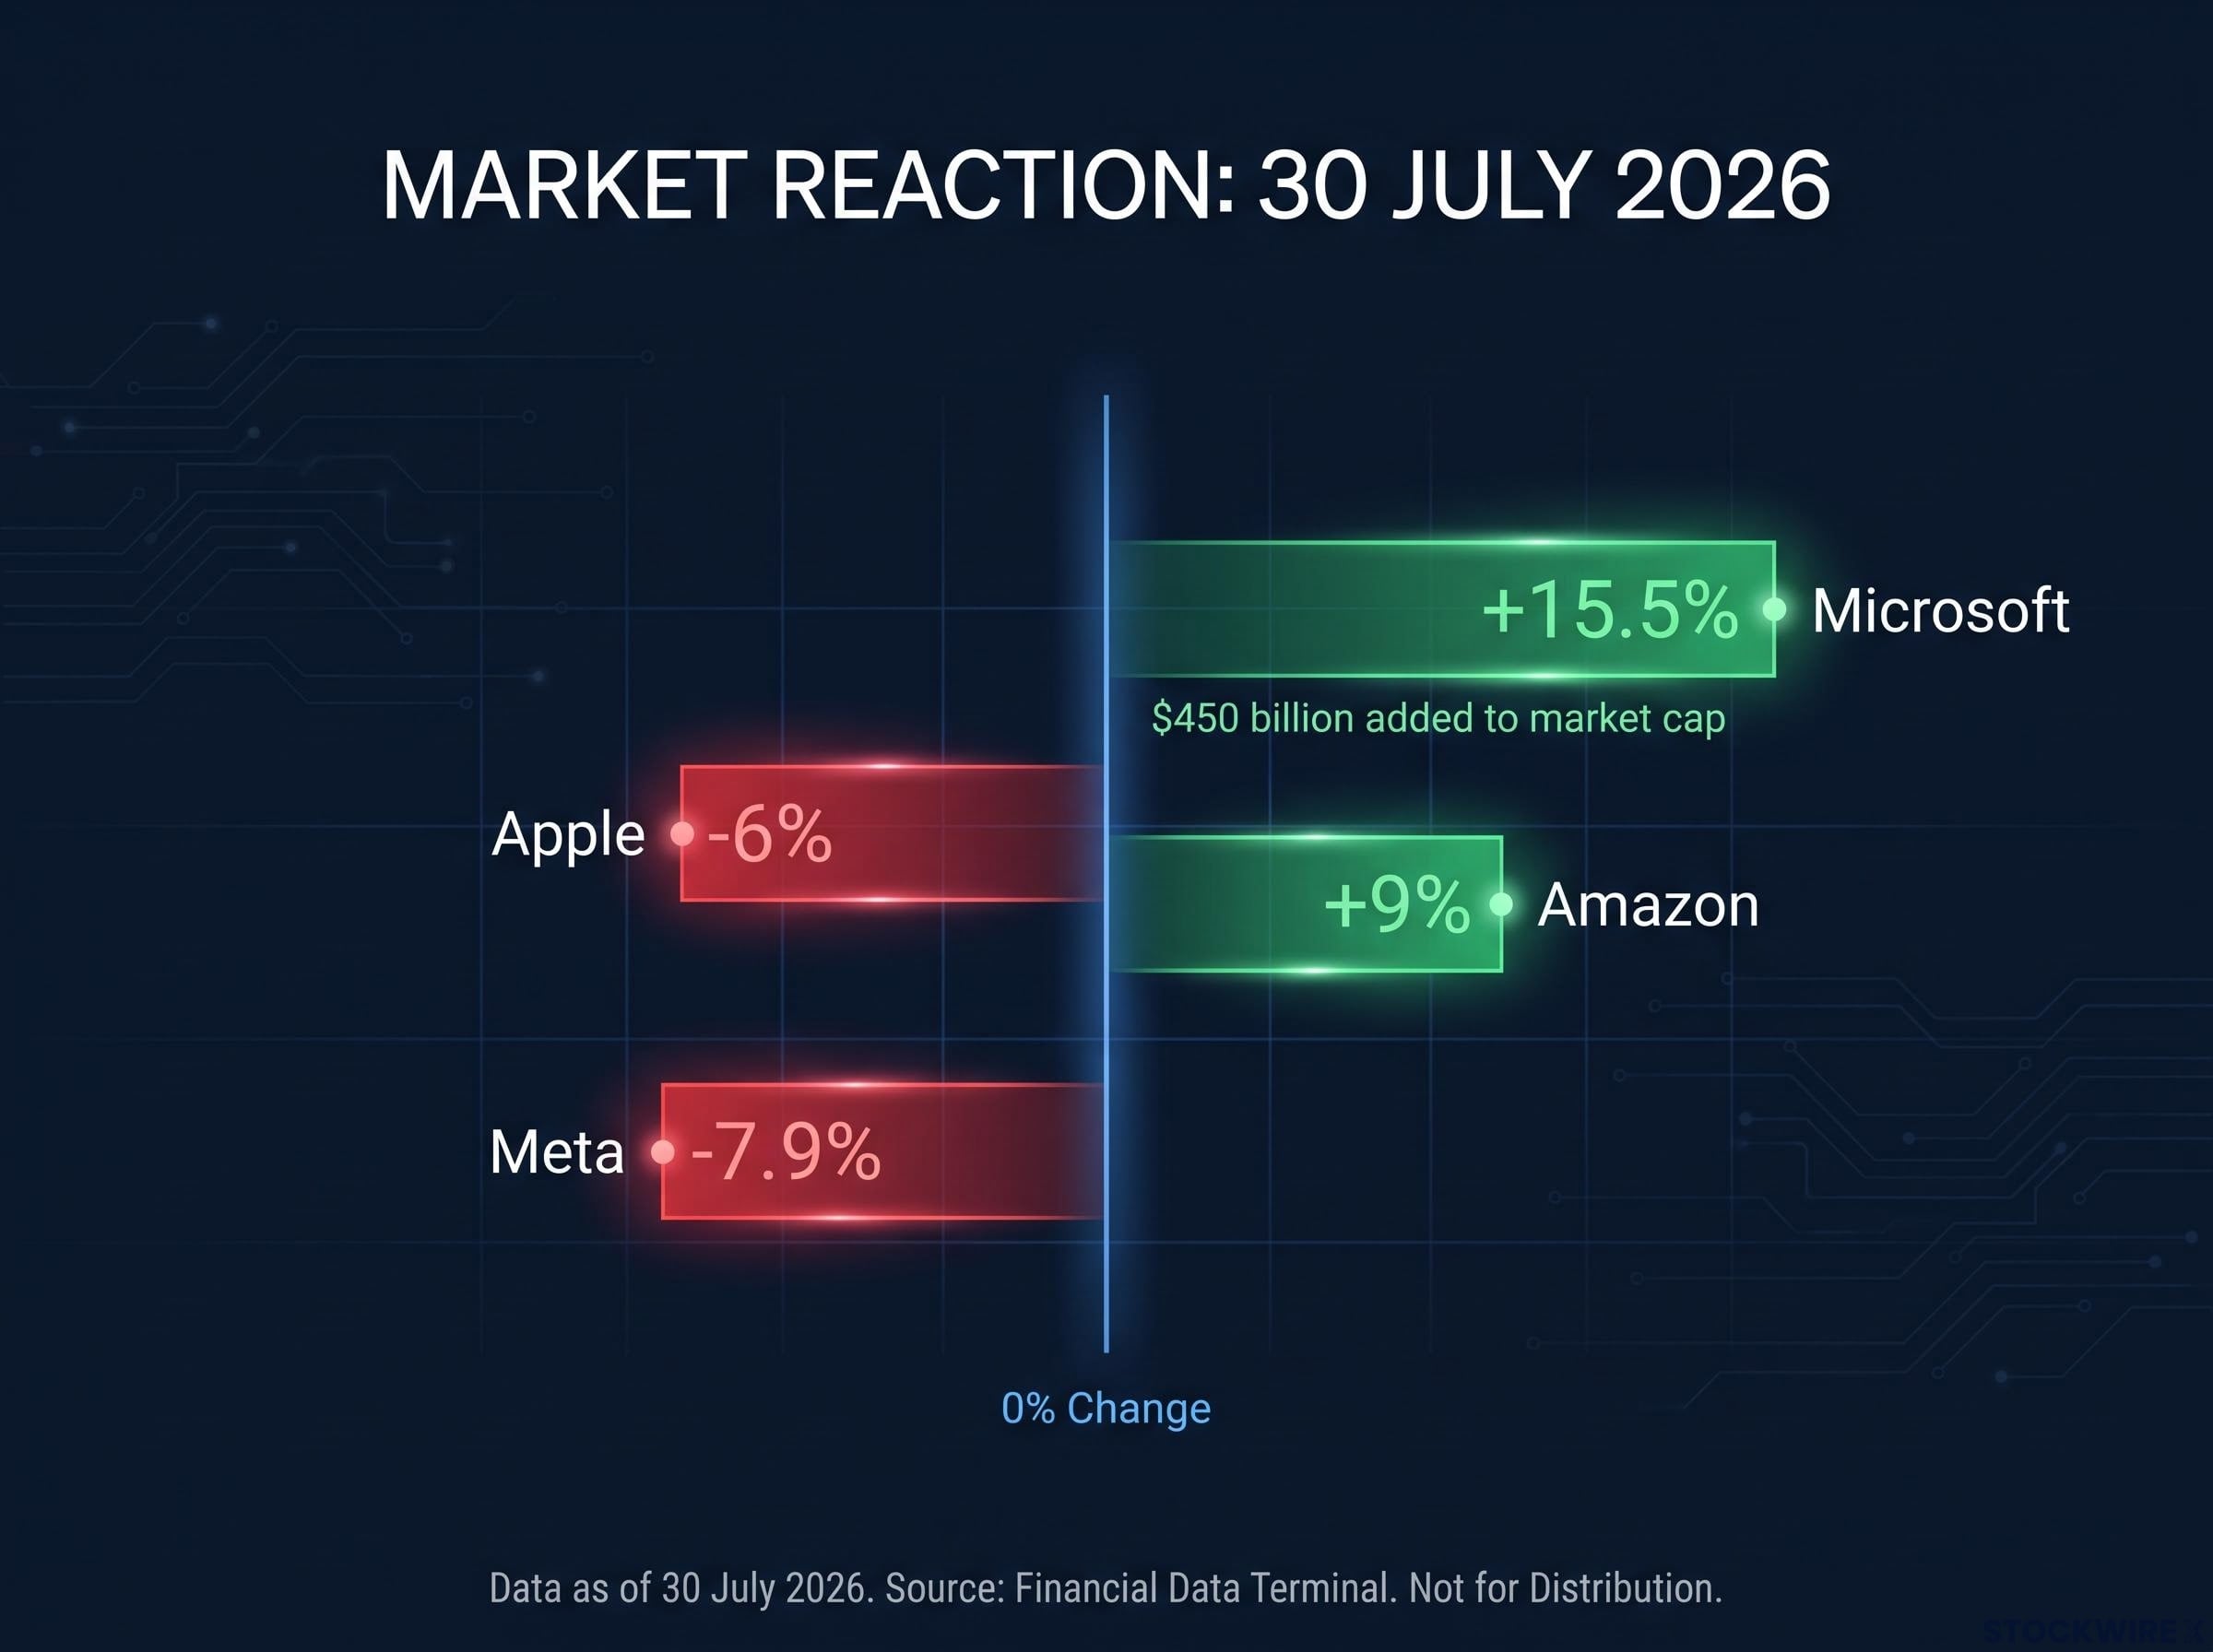
Four of the world’s largest technology companies reported earnings on 30 July 2026 within hours of each other, and the results split cleanly in two. Microsoft recorded a 15.5% single-day gain, its strongest session since 2008. Amazon climbed approximately 9% in after-hours trading. Apple fell around 6%. Meta dropped nearly 8%.
The same investing theme, artificial intelligence, drove all four stories, but in opposite directions. Two companies are generating measurable AI revenue today; two are primarily spending on AI in the hope of future returns. Which bucket a company sits in is now the central question for technology portfolio construction.
Here is what the numbers from each company actually tell you about who is winning the AI monetisation race right now, and where the risks are building.
Microsoft and Amazon deliver the results AI optimists were waiting for
Microsoft saw roughly $450 billion added to its market capitalisation in a single trading session on 30 July 2026. That is not sentiment. That is the market repricing a company whose AI thesis just cleared the highest evidentiary bar yet.
On 30 July 2026, Microsoft posted a one-day market capitalisation increase of approximately $450 billion, marking its most significant single-session gain since 2008.
For Q4 FY26, the company delivered revenue of $90.01 billion, representing 18% year-over-year growth and clearing analyst estimates of approximately $87.6 billion. Earnings per share of $4.74 came in approximately 11% ahead of what the market had expected. Azure cloud revenue expanded by approximately 43% year-over-year, driven heavily by AI workloads. Copilot commercial seats surpassed 30 million on a paid basis, confirming that enterprise customers are not just experimenting with AI productivity tools; they are paying subscription fees for them, which converts AI capability into high-margin, recurring revenue.
The Microsoft Q4 FY26 earnings release confirmed revenue of $90.01 billion, Azure growth of 43%, and more than 30 million paid Copilot seats, establishing that enterprise AI adoption is now generating measurable recurring subscription revenue at scale.
Amazon’s quarter reinforced the same signal from a different angle. The core numbers across both companies:
- Microsoft: Revenue $90.01 billion (+18% YoY), EPS $4.74 (+11% versus consensus), Azure growth approximately +43%, more than 30 million paid Copilot seats, shares +15.5%
- Amazon: Net sales $200.61 billion (+20% YoY), AWS revenue $42.2 billion (+37% YoY, fastest since 2021), shares approximately +9% after hours
That 43% Azure growth rate at Microsoft’s scale is not a rounding error. It tells investors that AI inference and training workloads are now materially moving cloud consumption numbers, not just featuring in executive commentary.
Hyperscaler capex commitments were already tracking toward $725 billion for full-year 2026 before this earnings cycle, meaning Amazon’s record $220 billion and Microsoft’s revised $175 billion figure both land inside a spending envelope the market had partially anticipated, which helps explain why discipline signals carried more weight than the absolute dollar amounts.
When big ASX news breaks, our subscribers know first
What made the beats credible, and not just big
Headline beats matter, but institutional investors need more than a single quarter’s upside surprise to reprice a company. Two specific disclosures gave them that confidence.
Microsoft’s capex signal
Microsoft reduced its FY26 capital expenditure guidance to $175 billion from a prior level of approximately $190 billion, while simultaneously accelerating AI-linked revenue. A company that cuts capex while revenue accelerates is demonstrating return discipline, not retreat. For AI investors worried about an infrastructure arms race with no end, Microsoft’s move is among the first clear signals that at least one major player sees the spending plateau coming.
Amazon’s backlog disclosure
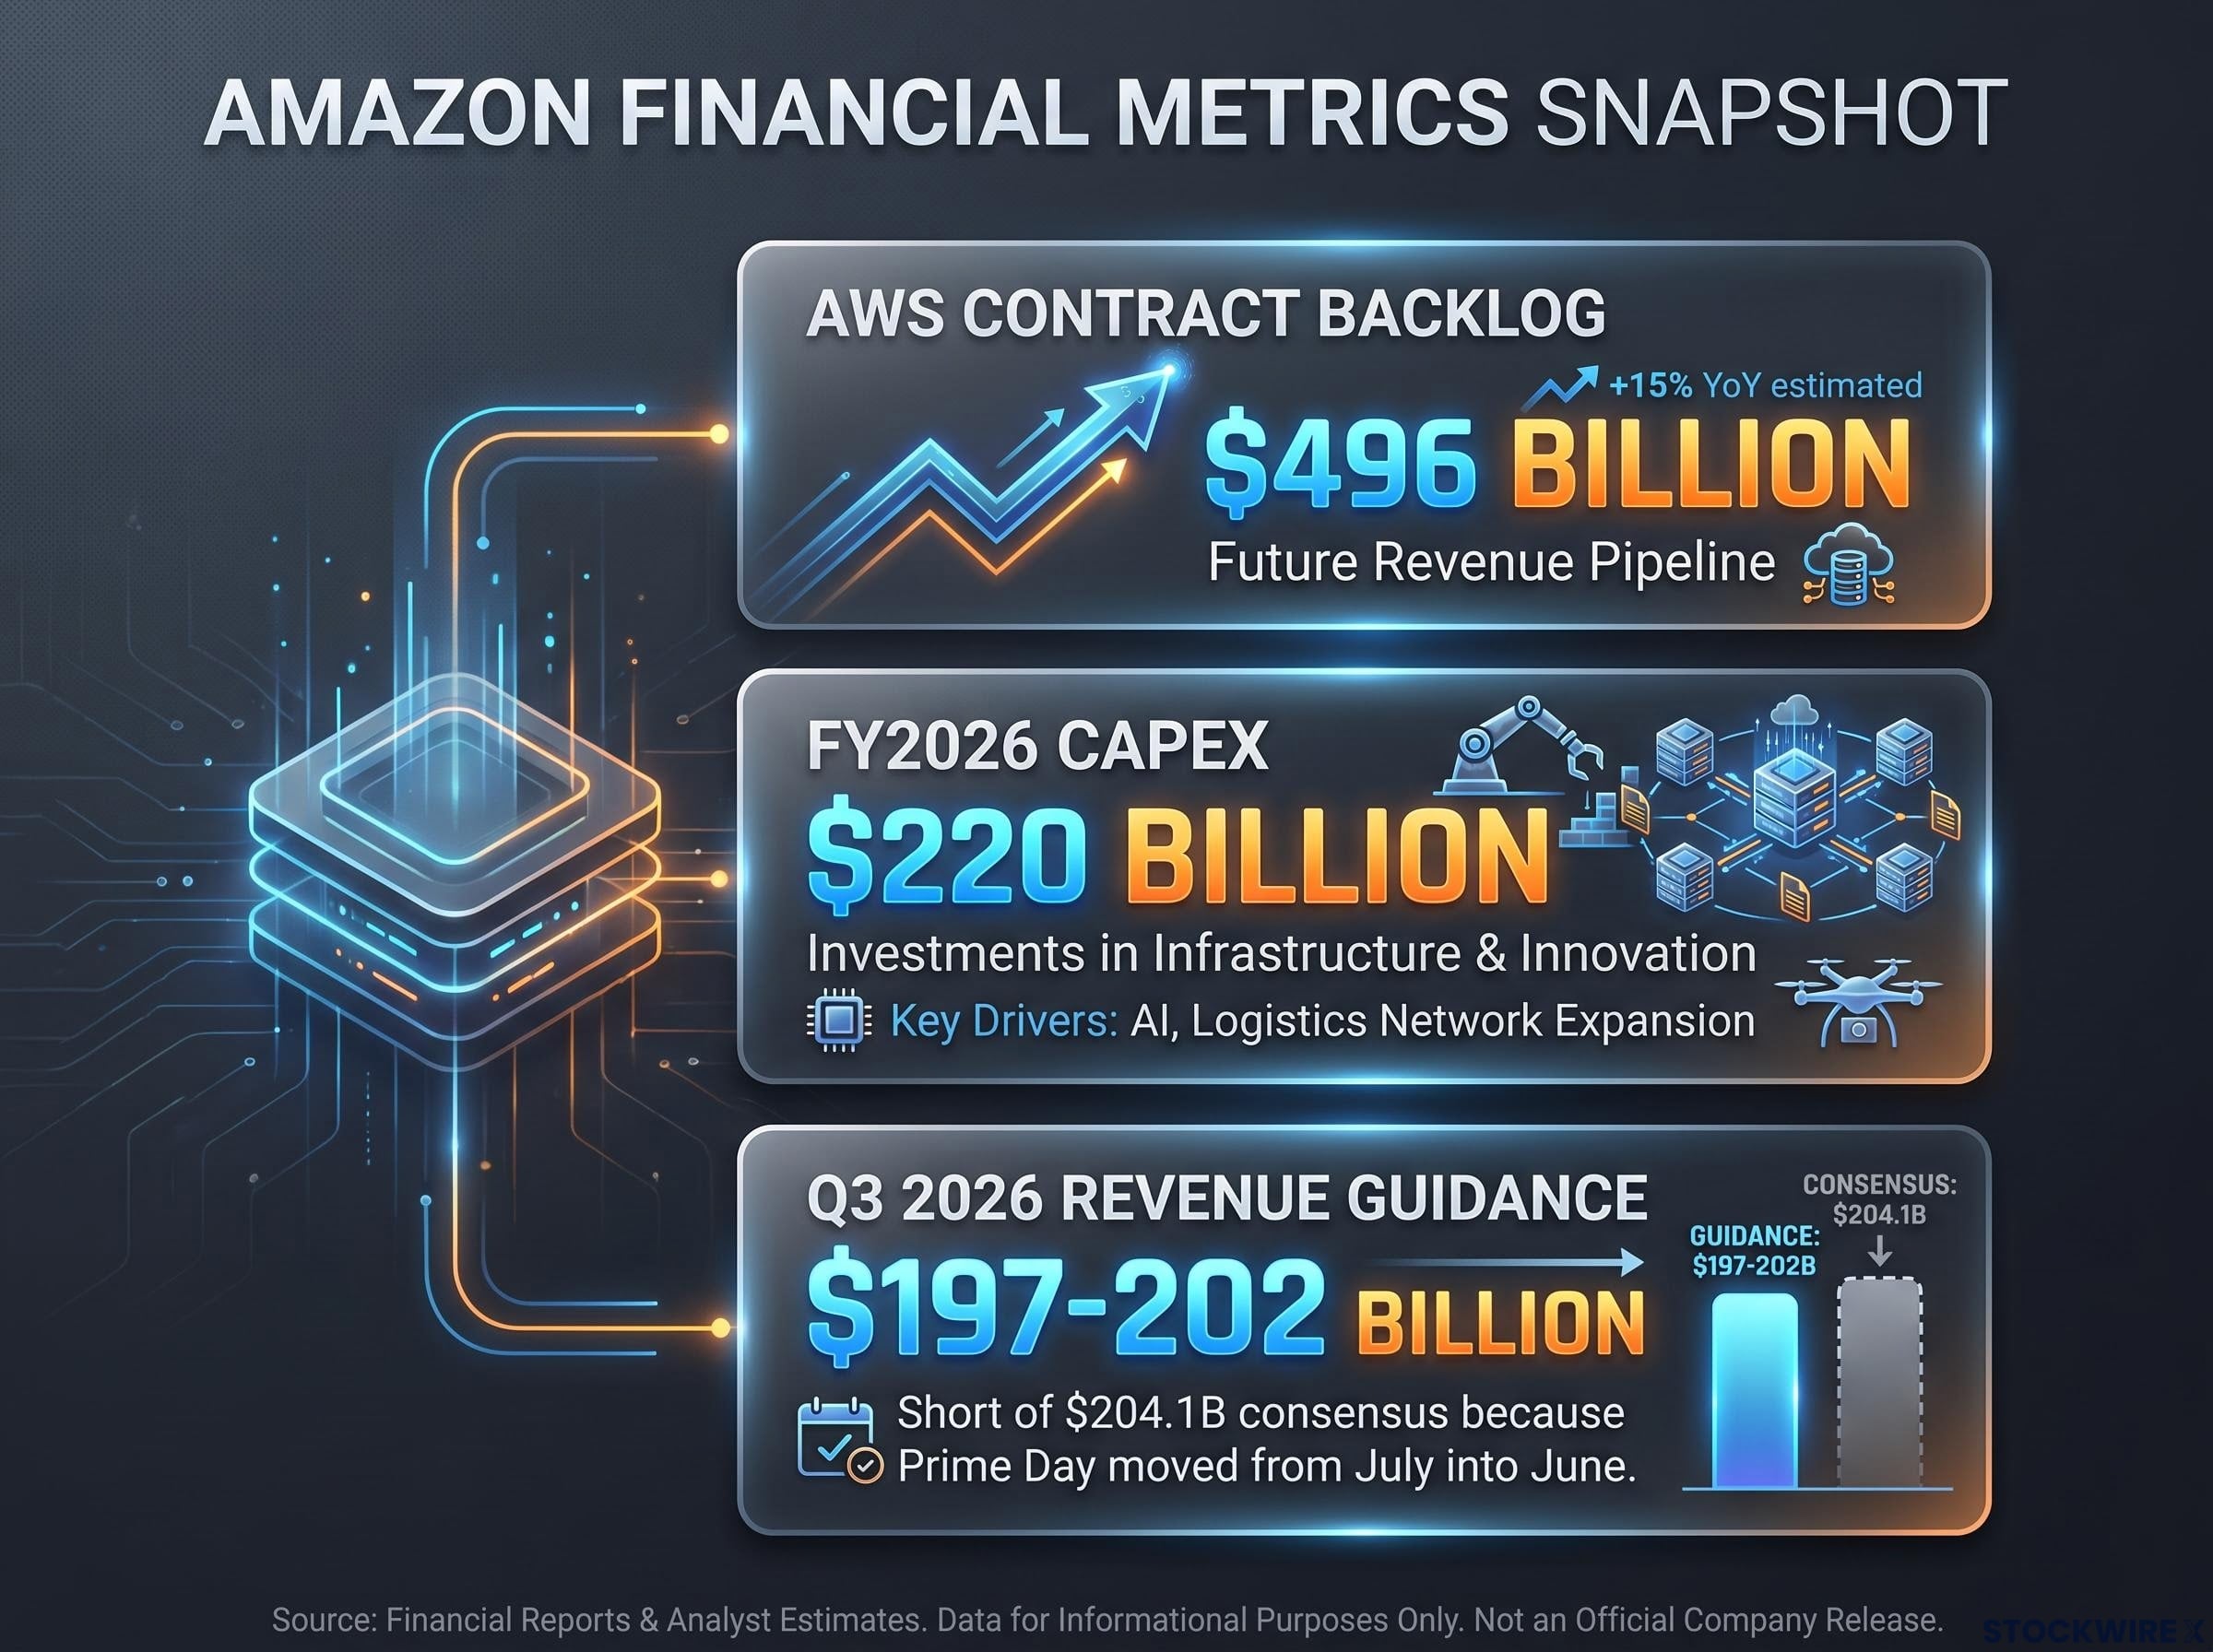
On the earnings call, CEO Andy Jassy revealed that the AWS contract backlog stood at approximately $496 billion.
A backlog of that size represents multi-year contracted demand for cloud and AI infrastructure. It means the record $220 billion in full-year 2026 capex Amazon is deploying is backed by committed revenue, not speculative build-out. That distinction matters enormously for how investors should value the spend.
Amazon’s Q3 2026 revenue guidance range of $197-202 billion fell short of the approximately $204.1 billion consensus, but the reason behind the shortfall was straightforward: Prime Day moved from July into June, which created a more demanding year-over-year comparison period. No demand deterioration, just a calendar artefact. When a company can provide a clean, verifiable explanation for a guidance miss, the market listens differently than when the explanation is vague.
Why AI spending alone is not an investment thesis
Not all AI exposure is created equal. The distinction that matters most after this earnings cycle is simple: is a company generating AI revenue today, or is it primarily consuming capital in anticipation of future AI returns?
Free cash flow (FCF), the cash a business generates after paying for operations and capital investments, is the clearest single measure of whether AI spending is self-funding. Meta generated approximately $784 million in FCF while deploying $31.1 billion in quarterly capex. That is under $1 billion of cash generation on more than $60 billion in quarterly revenue. Microsoft, by contrast, maintained strong free cash flow even after its AI investment programme.
Alphabet’s first quarter of negative free cash flow as a public company, reported just days before Microsoft and Amazon confirmed their results, set the baseline anxiety that made those beats land so forcefully with investors who had been tracking capex trajectories across the hyperscaler group.
Cloud remains the most transparent AI monetisation channel because Azure and AWS can report AI workload-driven growth directly. Consumer-facing AI features on devices or social networks are harder to isolate and measure. When you evaluate AI exposure across your portfolio, the companies with the clearest line from AI spend to AI revenue are the ones where your risk is most visible.
| Company | Revenue Growth | Key AI Metric | Quarterly Capex | FCF Signal |
|---|---|---|---|---|
| Microsoft | +18% YoY | Azure +43%; 30M+ paid Copilot seats | $175B FY26 (cut from ~$190B) | Strong |
| Amazon | +20% YoY | AWS +37%; $496B backlog | ~$220B FY2026 | Supported by contracted demand |
| Apple | +16% YoY | Services $30.74B (miss) | Not disclosed | Flattered by tariff refunds |
| Meta | +28% YoY | AI-driven ad targeting | $31.1B (single quarter) | ~$784M (compressed) |
Owning a company spending heavily on AI is not the same as owning the financial benefits of AI. This framework gives you a lens to apply to every technology earnings report going forward.
Apple and Meta: where the AI story gets complicated
Apple’s headline numbers looked strong. But the market sold the stock anyway, and the reason sits inside one line item.
- Revenue: $109.4 billion (record fiscal Q3, +16% YoY)
- EPS: $2.02 (+29% YoY)
- iPhone revenue: $54.25 billion (+22% YoY)
- Services revenue: $30.74 billion (below analyst expectations)
- After-hours reaction: approximately -6%
Tariff refunds contributed roughly 2 percentage points to the quarter’s gross margin figure and approximately $0.11 to EPS, benefits that will not repeat in future periods. The underlying run-rate profitability is lower than the headline figures suggest.
The Services miss matters more than a typical line-item miss because the entire premium valuation on Apple is built on the Services and recurring-revenue story. Any deceleration in that line forces a rethink of the multiple, not just the quarter. AI was supposed to show up in Services via Apple Intelligence and higher average revenue per user across the installed base. A strong hardware quarter with a soft Services number challenges that thesis directly.
Meta presents a different, sharper structural concern.
- Revenue: $60.80 billion (+28% YoY)
- EPS: $6.18 (approximately 14% below analyst consensus)
- Free cash flow: approximately $784 million
- Quarterly capex: $31.1 billion
- After-hours reaction: -7.9%
The 28% revenue growth is genuine and AI-enhanced; AI-driven ad targeting and ranking tools are clearly working. But spending $31.1 billion in a single quarter on infrastructure to produce under $1 billion in free cash flow is the number that drove the selloff. Unlike AWS or Azure, Meta’s AI build-out is not matched with clearly contracted external revenue. The payoff depends on future ad yield improvements and new AI products that are harder to model.
Meta Compute, the cloud division Meta was reported to be building to sell spare AI capacity to external buyers, represented the strategic rationale behind the $125-145 billion capex programme; if that external revenue stream materialises, the FCF compression investors penalised in this earnings report becomes a different calculation entirely.
Three signals to track in the next AI earnings cycle
Rather than reacting to each quarter’s headline surprises, you can position yourself ahead by monitoring three specific metrics across the next reporting cycle.
- AI-attributed backlog and committed revenue. Contracted demand de-risks capex in a way that speculative build-out does not. For context, AWS disclosed a contract backlog of approximately $496 billion. Companies with growing, disclosed backlogs are showing you committed demand. Companies that cannot or will not disclose this figure are asking you to take their capex on faith.
- Services revenue growth and average revenue per user for platform companies. This is where AI monetisation via installed bases should eventually appear. Apple specifically needs to show Services ARPU inflecting upward to justify its valuation premium. Flat or decelerating Services ARPU in a strong hardware quarter is a warning, not a neutral signal.
- Free cash flow relative to AI capex. Track this as a capital-efficiency ratio alongside traditional metrics like revenue growth and operating margin. Microsoft’s decision to lower its capital expenditure to $175 billion while accelerating revenue is the positive benchmark. Meta’s compressed FCF against $31.1 billion quarterly capex is the warning sign. A company with strong AI revenue claims but deteriorating FCF relative to capex is telling you something real about execution, regardless of what the CEO says on the call.
A tale of two AI strategies, and what it means for portfolios right now
AI is now a sorting mechanism within big tech, separating companies generating measurable returns from those deferring them. This earnings cycle has made that divide more visible than at any point in the past 12 months. Microsoft gained 15.5% and Meta fell 7.9% in the same reporting window. The market is pricing this distinction in real time.
For investors who have treated big tech as a single AI trade, these four results are the clearest prompt yet to disaggregate those positions and ask which companies are being paid for AI today and which are still paying for it.
- Microsoft: Current AI cash-flow leader. Improving capital efficiency (capital expenditure reduced to $175 billion). Key catalyst: sustained Azure growth above 40%. Key risk: AI workload demand saturation at scale.
- Amazon: AI infrastructure leverage play. Record capex de-risked by a contracted AWS pipeline of $496 billion. Key catalyst: continued AWS re-acceleration. Key risk: macro-driven enterprise IT spending slowdowns.
- Apple: Long-dated AI optionality tied to Services ARPU. Strong hardware, but limited near-term AI monetisation proof. Key risk: continued Services misses eroding the valuation premium.
- Meta: High-conviction, high-volatility AI infrastructure bet. AI is helping core ad economics, but FCF compression is severe. Key catalyst: any sign of capex moderation alongside sustained revenue growth. Key risk: prolonged capital intensity without proportional cash-flow improvement.
Blanket exposure to big tech is a different proposition than it was a year ago. The four companies that reported today are no longer a single trade.
For investors wanting to act on the distinctions this earnings cycle has drawn between AI monetisers and AI spenders, our dedicated guide to AI portfolio layers covers the six distinct value-chain segments, their different risk profiles, and how to size exposure across each without inadvertently concentrating in a single layer.
This article is for informational purposes only and should not be considered financial advice. Investors should conduct their own research and consult with financial professionals before making investment decisions. Past performance does not guarantee future results. Financial projections are subject to market conditions and various risk factors.