Alphabet posted its first negative free cash flow quarter as a public company on Tuesday evening. Tesla missed earnings estimates on the same night. Both companies pointed to the same cause: the cash cost of building artificial intelligence infrastructure.
The 22 July session was not a routine earnings miss. It was the moment the AI investment arms race produced visible, quantifiable damage to two of the most widely held stocks in American portfolios. Alphabet beat on revenue and earnings per share, yet sold off. Tesla missed on the bottom line entirely. The shared thread was capital expenditure so large it overwhelmed the income statement.
Here is what the numbers actually reveal about where Big Tech’s AI spending is going, what it is doing to free cash flow, and which metrics matter most as Microsoft, Amazon, and Meta prepare to report in the weeks ahead.
The numbers Wall Street received, and the number that alarmed it
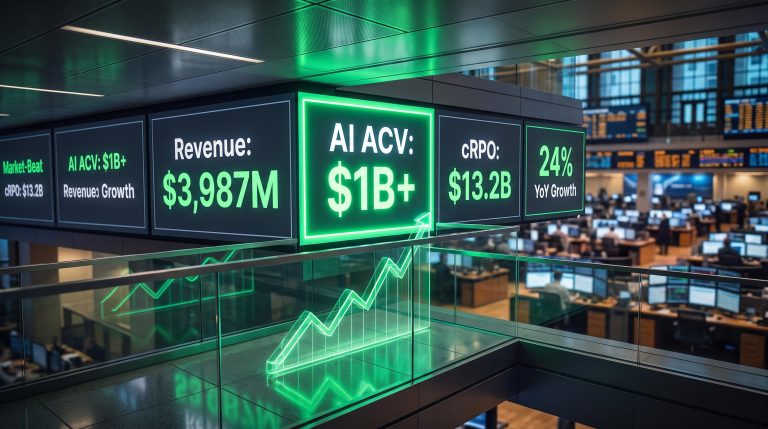
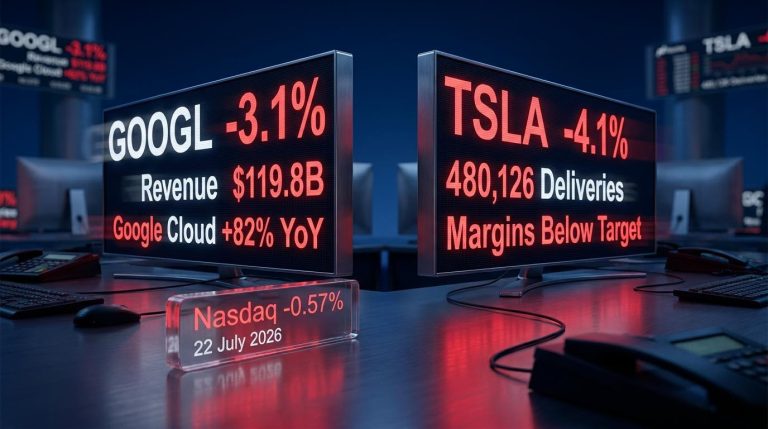
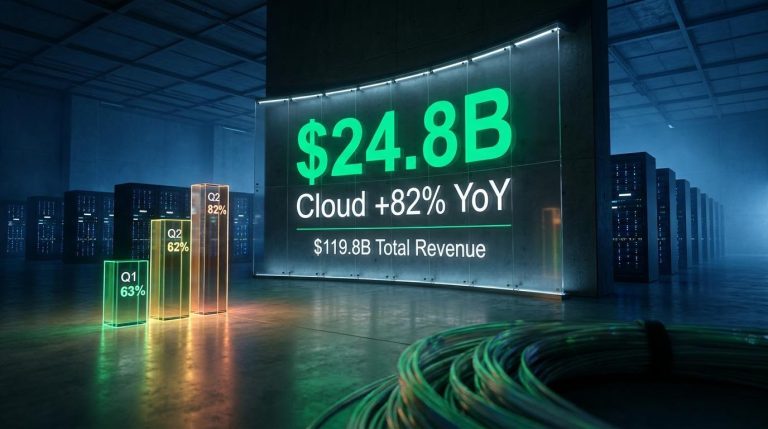
Alphabet’s profit-and-loss statement was strong. Q2 2026 revenue came in at $119.8 billion, up 24% year over year and roughly $3 billion above consensus. Earnings per share landed at $2.85, beating expectations. On its face, this was a company delivering exactly what shareholders wanted.
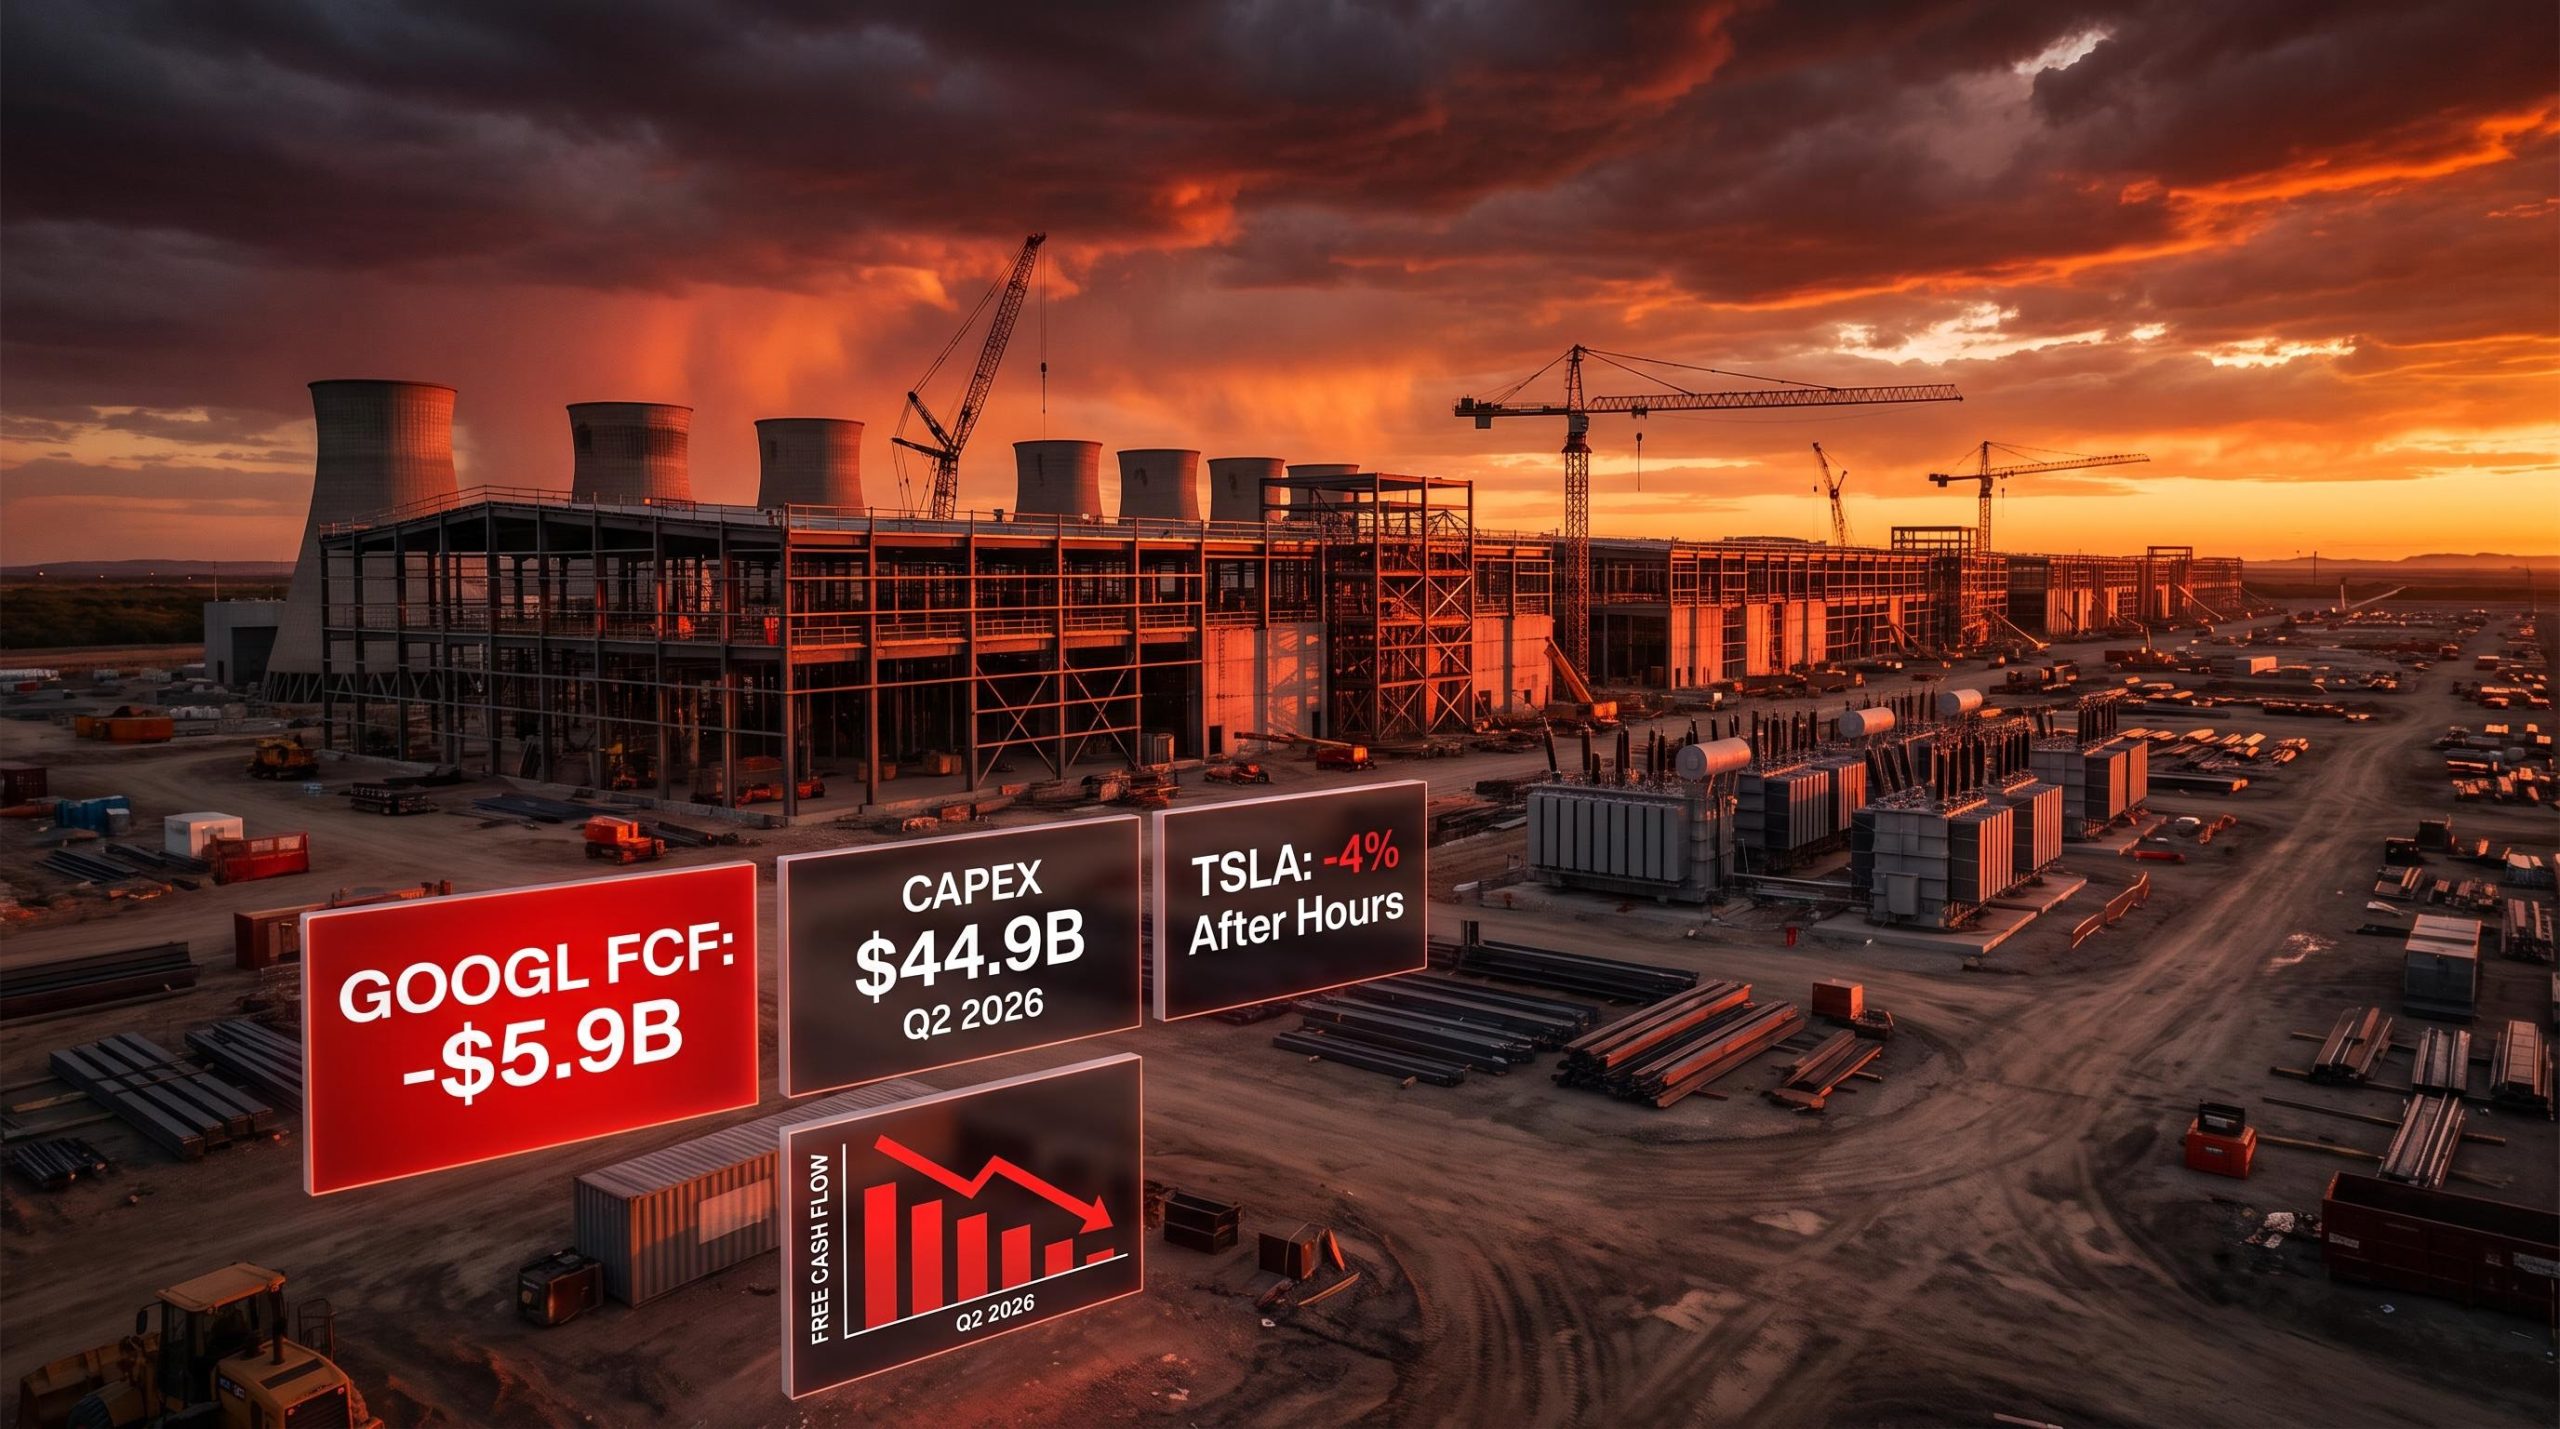
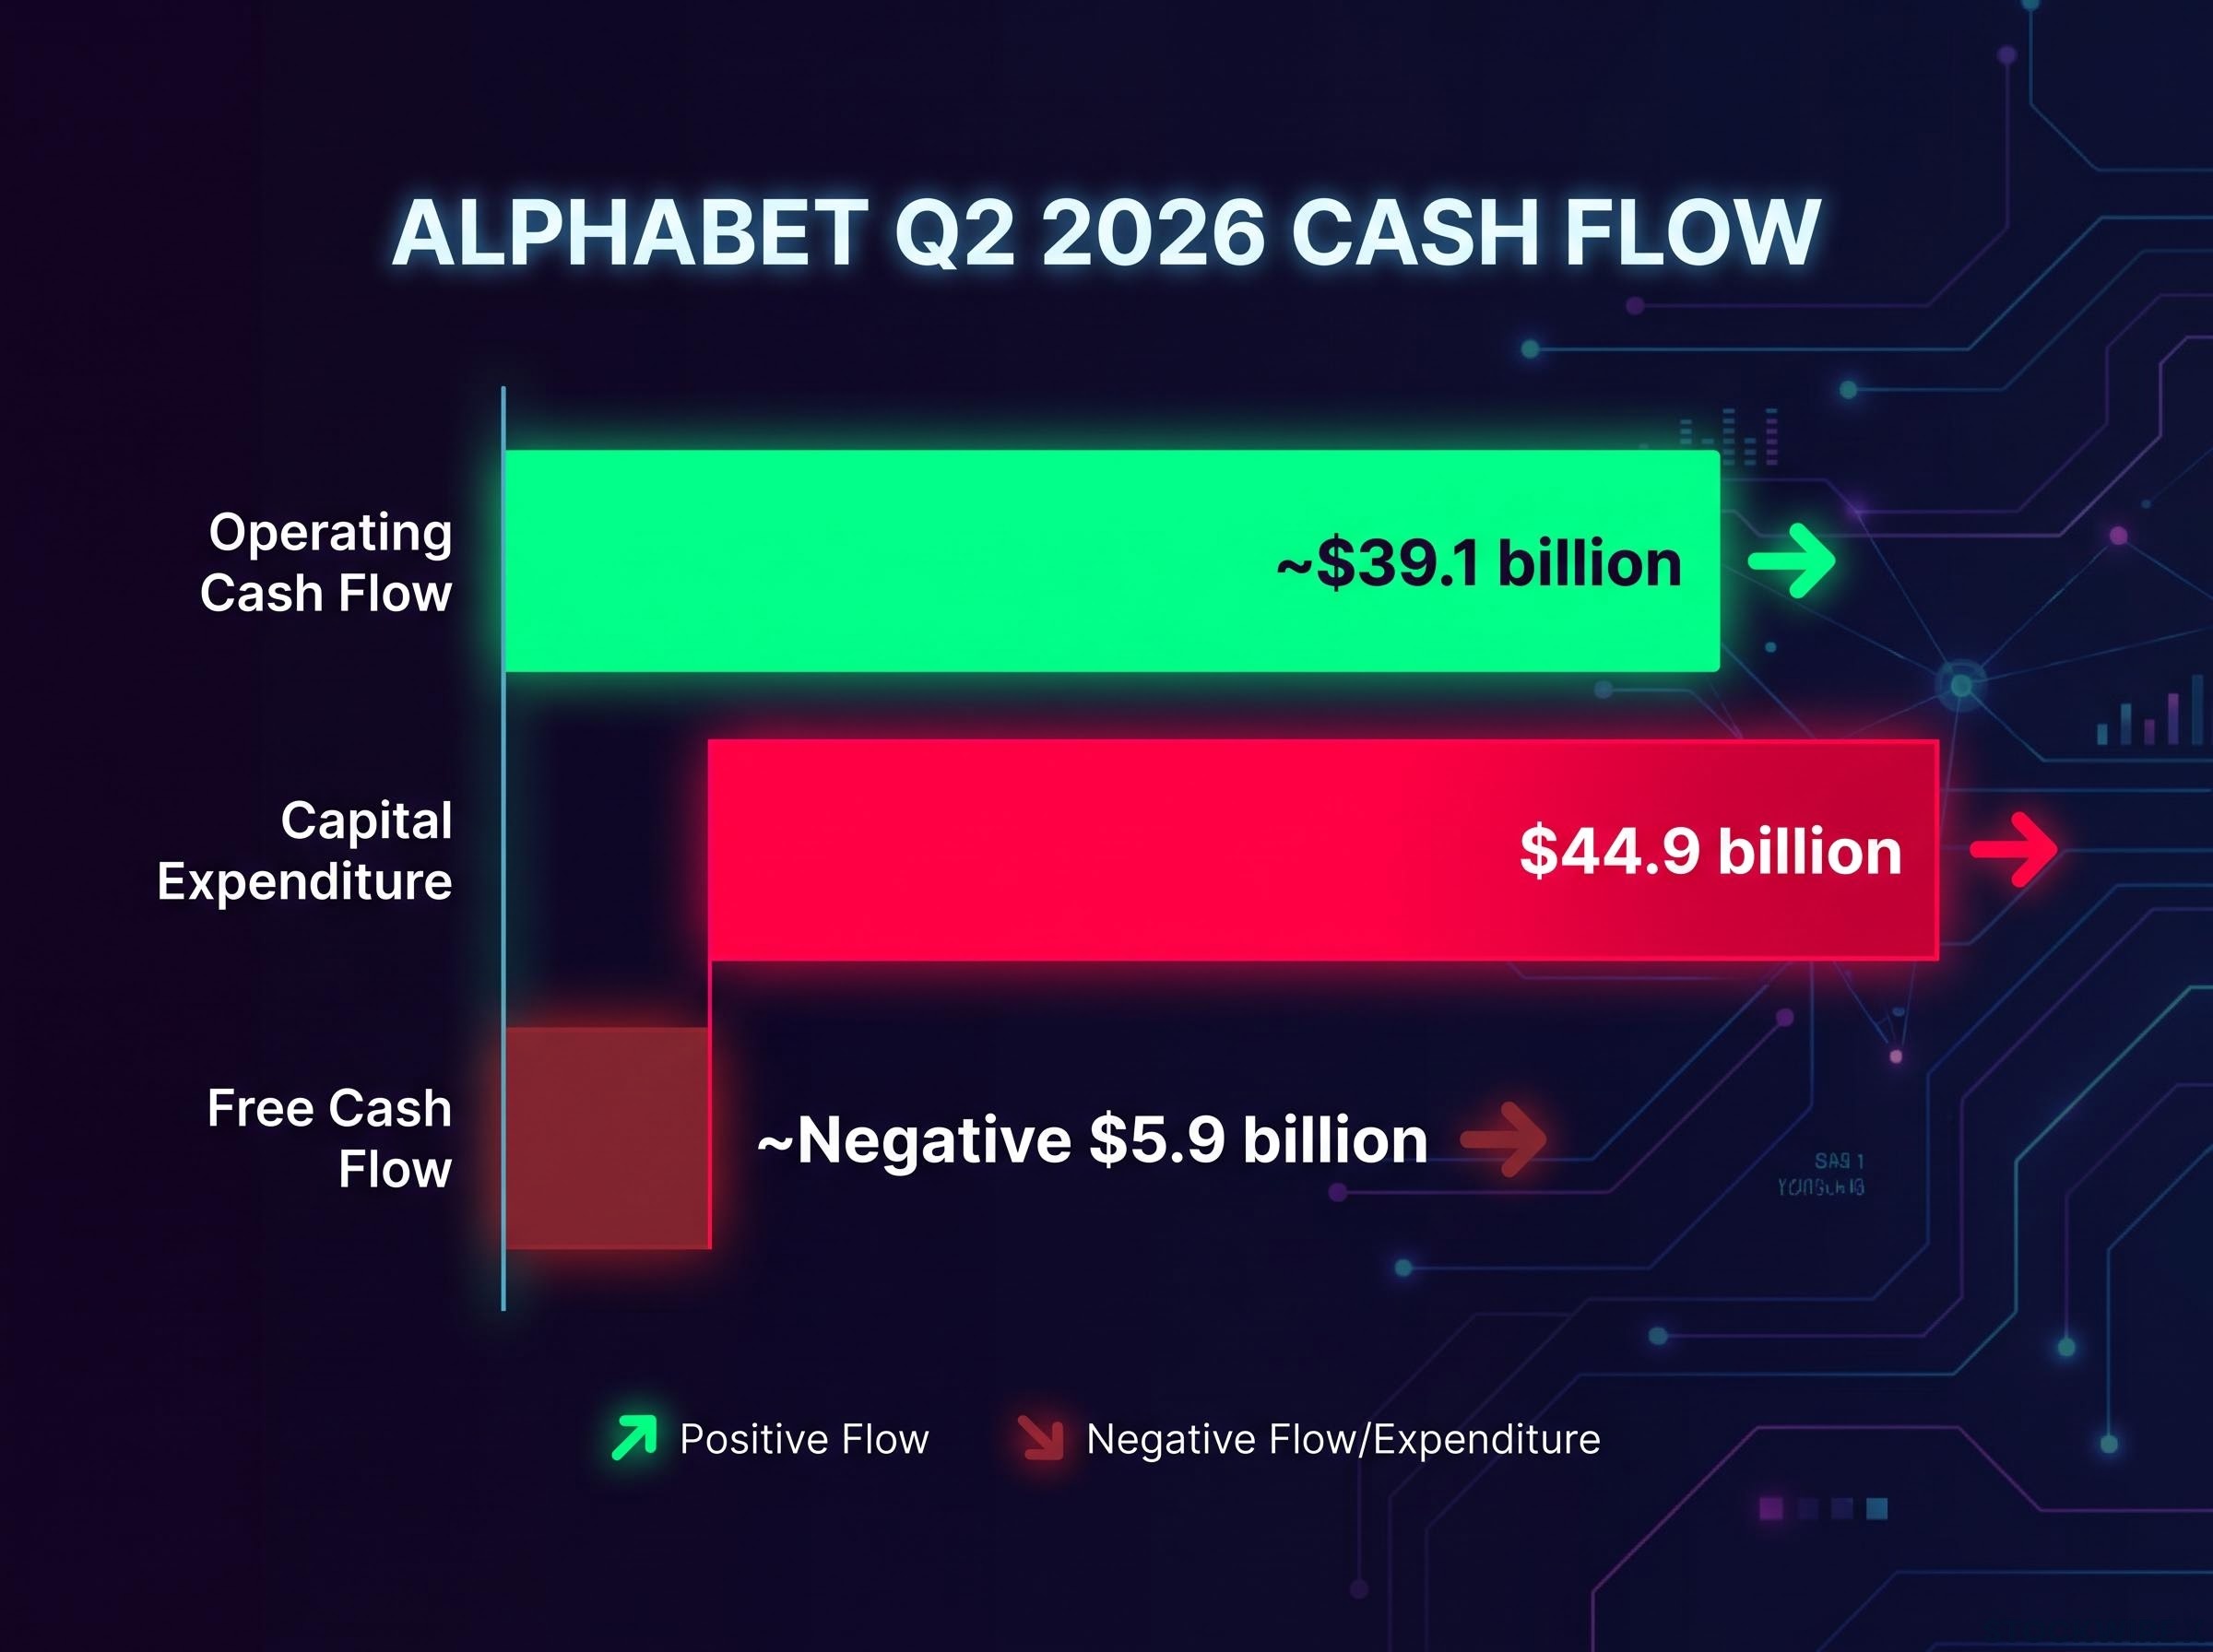
Then the cash flow line arrived. Capital expenditure hit $44.9 billion in a single quarter. Operating cash flow was approximately $39.1 billion. That arithmetic left free cash flow at roughly negative $5.9 billion, marking the first quarter in Alphabet’s public company history in which it has consumed more cash than it generated.
Alphabet’s stock moved lower in after-hours trading on 22 July, with an initial decline of around 2.4% that deepened toward 4% as the session continued and broader tracking sources updated. The selloff was not a verdict on this quarter’s profits. It was a verdict on what the cash flow trajectory implies for future financial flexibility.
Tesla’s results compounded the mood. Reporting from Investing.com indicates that Tesla fell short of consensus EPS expectations, generated negative cash flow during the quarter, and shed around 4% of its value in after-hours trading. Those figures have not been independently cross-verified from separate sources.
| Metric | Alphabet Q2 2026 (confirmed) | Tesla Q2 2026 (original source only) |
|---|---|---|
| Revenue | $119.8B (~$3B above consensus) | Not separately verified |
| EPS vs. consensus | $2.85 (beat) | Missed consensus |
| Free cash flow | ~Negative $5.9B | Negative |
| After-hours move | ~2.4% to 4% decline | ~4% decline |
When big ASX news breaks, our subscribers know first
What $44.9 billion in a single quarter actually buys
This is not an accounting abstraction. Alphabet’s quarterly capex now exceeds the annual infrastructure budgets of most countries’ transport systems. The spending is directed at four categories of physical infrastructure:
- AI data centres at hyperscale, purpose-built for training and inference workloads
- Custom silicon, including TPUs, GPUs, and specialised accelerators acquired under long-term supply agreements
- Networking infrastructure connecting distributed compute clusters
- Energy infrastructure, including on-site generation capacity and long-term power contracts
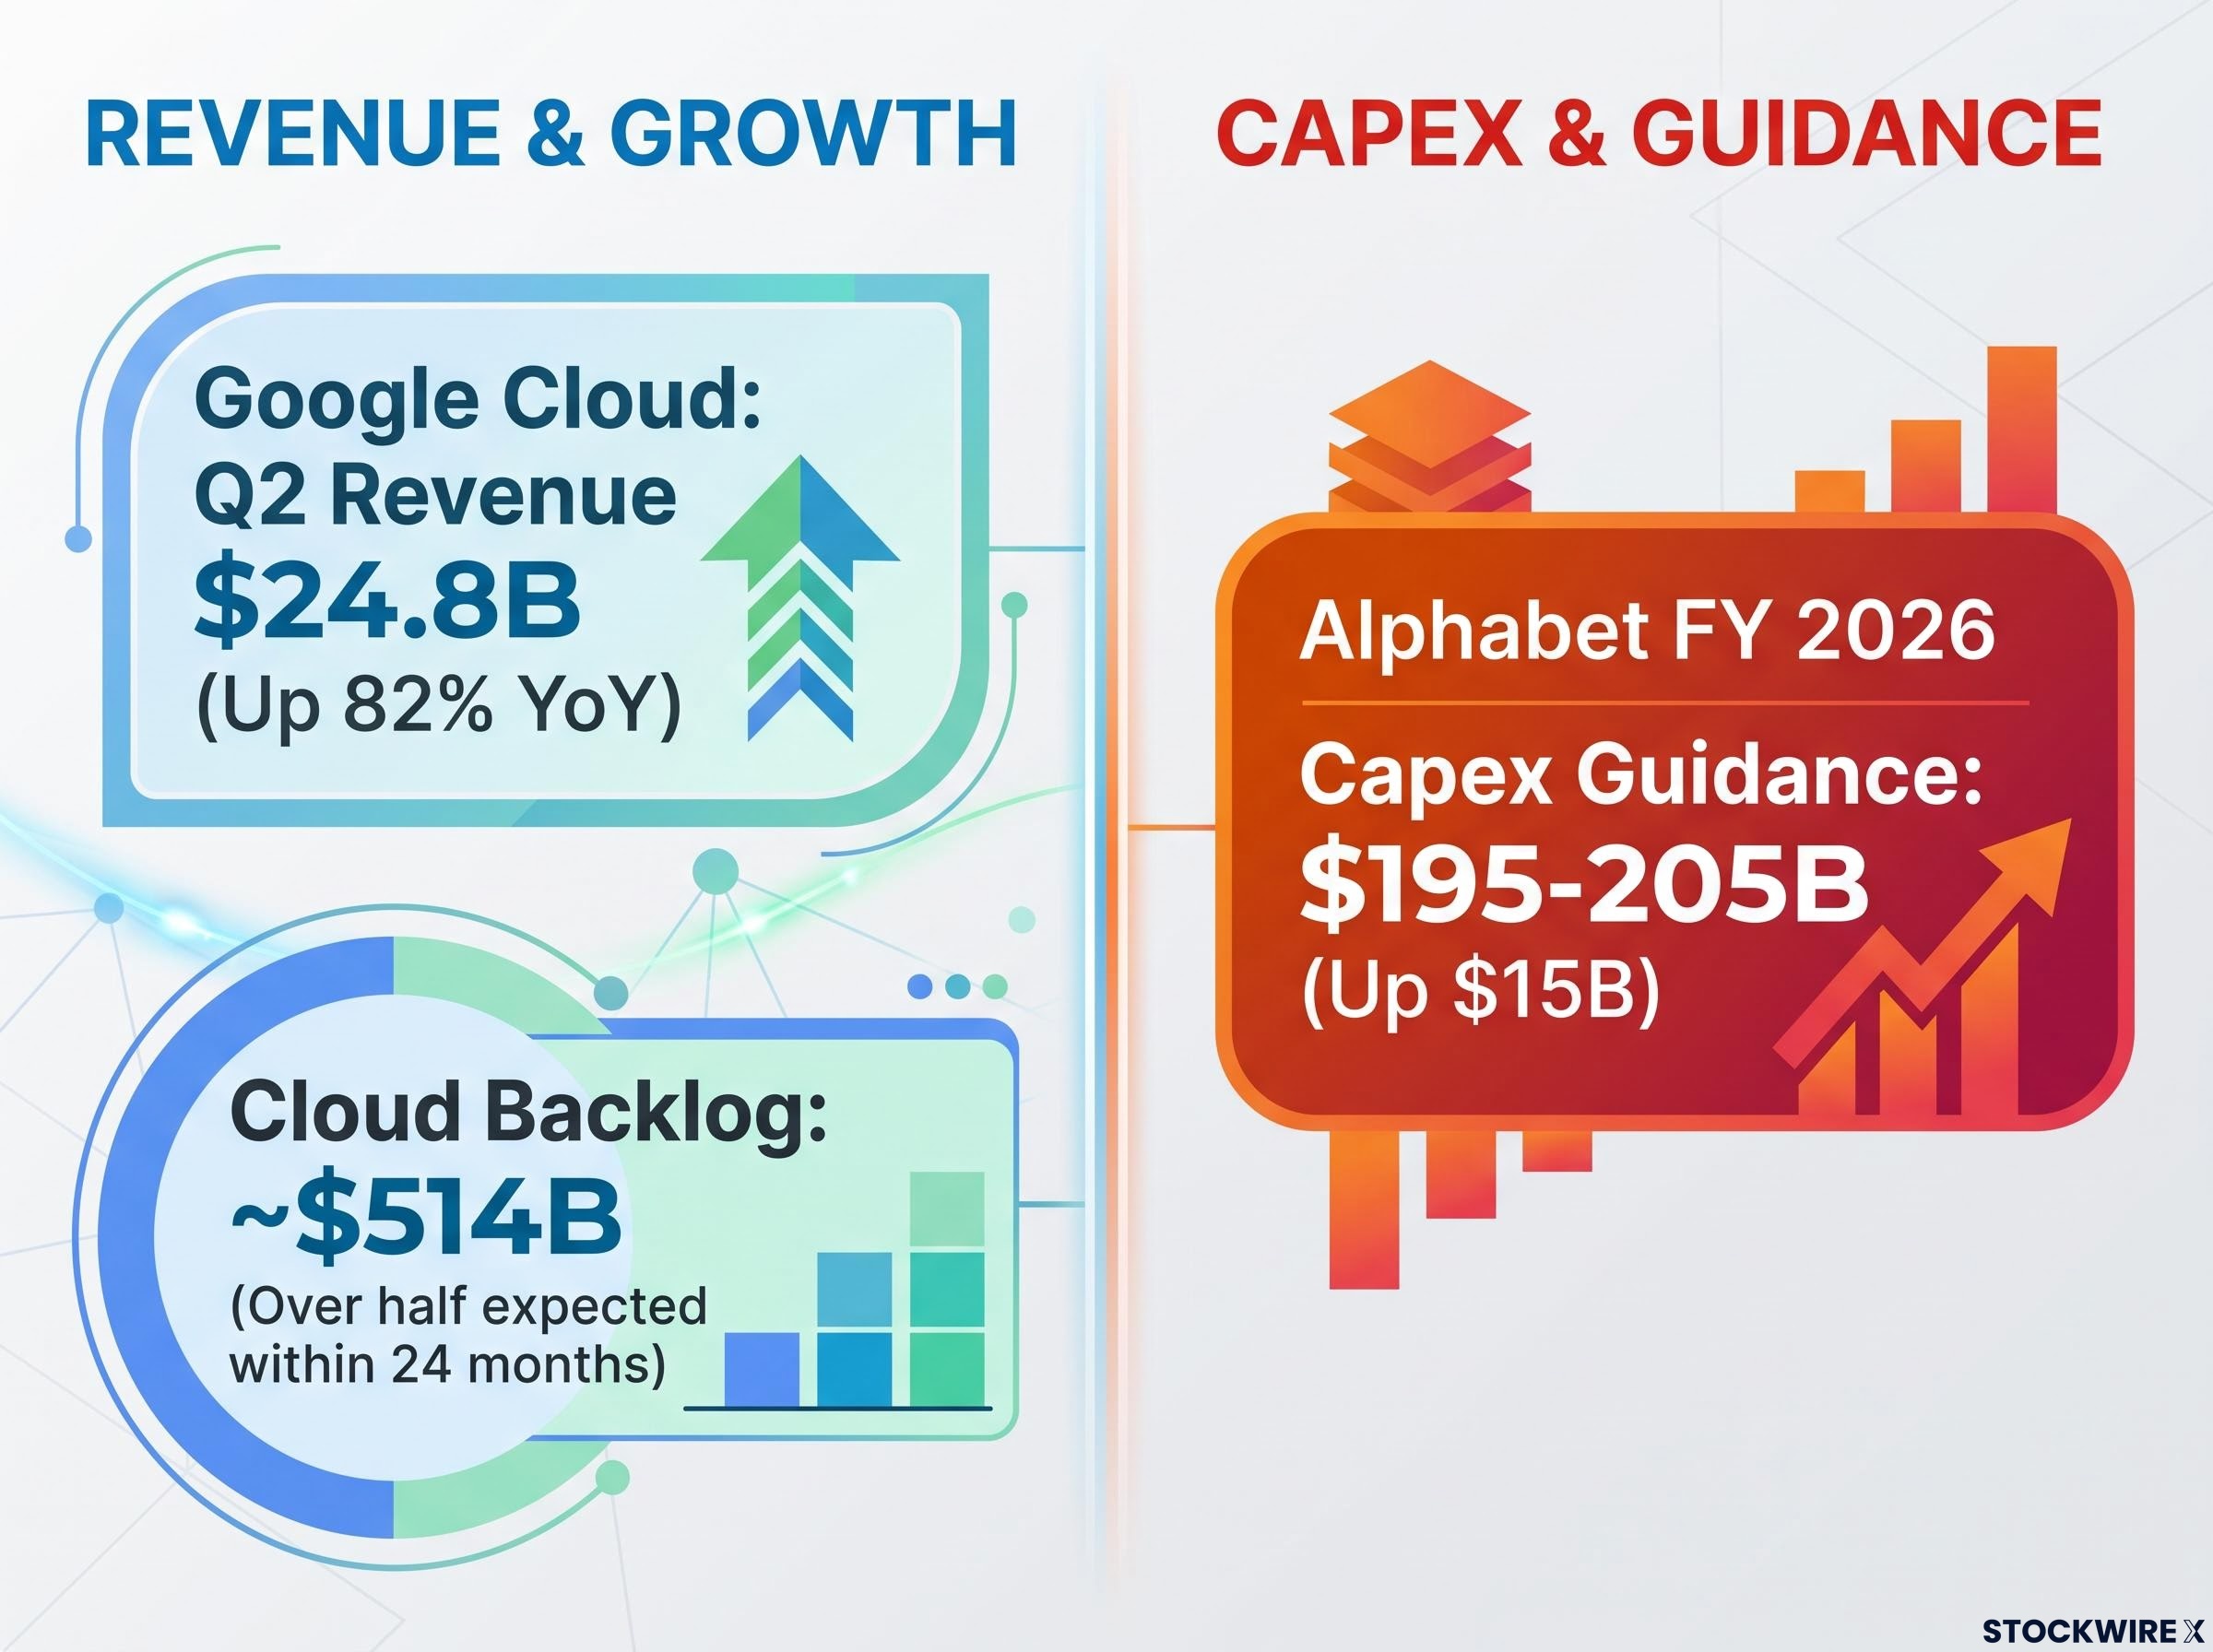
The company raised full-year 2026 capex guidance from $180-190 billion to $195-205 billion, a $15 billion single-quarter revision. That revision alone is larger than the entire annual capital budget of most S&P 500 companies.
Management’s tone left little ambiguity about the trajectory. Their view of generative AI returns has become “more bullish” over the past year.
Alphabet CFO on free cash flow: Free cash flow will “remain under pressure, driven by our investments in technical infrastructure,” adding that the company will continue investing “as long as we see an attractive return.”
A $15 billion upward capex revision in a single quarter tells you that AI infrastructure demand is running ahead of even Alphabet’s own prior estimates. For anyone trying to forecast how long the FCF pressure lasts, that signal matters more than the EPS beat.
Why Google Cloud’s 82% growth is both the justification and the problem
The bull case has real numbers behind it. Google Cloud posted Q2 revenue of $24.8 billion, up 82% year over year. Operating income more than tripled to $8.8 billion. The Cloud backlog reached approximately $514 billion, growing by more than $50 billion in a single quarter.
Three Cloud metrics carry the most weight for the investment thesis:
- Revenue growth rate: 82% year over year, accelerating from prior quarters
- Backlog size: $514 billion, providing revenue visibility across multiple years
- Backlog conversion timeline: management expects to recognise just over half within 24 months
That conversion window is where the bull case lives. Enterprise demand for AI infrastructure is accelerating, but investors are pricing a bet on future cash flows, not current ones.
Cloud backlog conversion timelines were already a central variable in the investment case after Q1 2026, when the $460 billion backlog with more than $230 billion expected to recognise within 24 months first appeared in Alphabet’s disclosures, a figure that has since grown to $514 billion following Q2.
The gap that still needs closing
Annual capex guidance of up to $205 billion still materially exceeds the current Cloud revenue run rate, even at 82% growth. The distance between infrastructure cost and AI-attributable revenue remains the unresolved variable in the thesis.
Depreciation from the growing asset base will accumulate on the income statement in future quarters, creating a structural earnings headwind even as revenue grows. The infrastructure is being built now; the cost of owning it will be spread across the years ahead.
Tesla and the same problem in a different industry
Tesla’s Q2 result was not a coincidence of timing. It was the same financial pressure point reached through the same mechanism.
As reported by Investing.com (Ambar Warrick), Tesla’s bottom-line results came in below consensus expectations, the company recorded negative cash flow for the quarter, and its shares fell by roughly 4% in after-hours trading on 22 July 2026. These specific figures have not been independently cross-verified from separate sources.
The Tesla Q2 2026 earnings breakdown confirms those figures in full: adjusted EPS of $0.33 missed the $0.51 consensus by 35%, operating margin collapsed to 1.4%, and capex of approximately $5.8 billion for the quarter was roughly 14 times reported operating income.
The investment driving the pressure spans five categories:
- Autonomous driving systems and the compute required to train them
- Optimus humanoid robot development and manufacturing
- AI inference hardware deployed across the vehicle fleet
- In-house software stacks for real-time decision-making
- Large-scale data labelling and training operations
What makes Tesla’s situation more acute is the baseline it started from. Automotive margins began compressing in 2023-2024 due to aggressive price cuts and intensifying competition, reducing the financial cushion that would normally absorb early-stage AI investment losses. When AI capex lands on top of a core business already under margin stress, the cash flow damage compounds faster.
For investors holding Tesla alongside Big Tech positions, the Q2 result clarifies that the AI capex problem reaches any company treating AI and robotics as a primary growth vector, not just pure-play technology firms.
What Big Tech’s financial profile is becoming, and why it matters
For most of the past two decades, the largest technology companies operated on an asset-light model. Marginal revenue growth required minimal incremental capital. Software scaled at near-zero marginal cost. Free cash flow margins were structurally high because the business did not require physical infrastructure proportional to its revenue.
Frontier AI capex has different characteristics. It requires massive upfront capital commitments for data centres, custom silicon under long-term supply agreements, dedicated energy infrastructure, and networking at a scale that has no precedent in the prior era. When Microsoft, Amazon, Meta, and Alphabet are all committing to tens of billions in quarterly AI capex, no single player can slow spending without risking material competitive disadvantage. That is the defining feature of an arms race.
Hyperscaler capex commitments were already running at $130 billion per quarter across the four largest cloud operators in Q1 2026, before Alphabet’s Q2 revision added another $15 billion to full-year guidance, setting the combined sector on a trajectory toward $1 trillion in annual AI infrastructure spending by 2027.
| Characteristic | Cloud-software era | AI infrastructure era |
|---|---|---|
| Capex intensity | Low; infrastructure shared and virtualised | High; purpose-built compute at scale |
| Marginal cost of revenue growth | Near-zero for software distribution | Significant; each workload requires dedicated capacity |
| Payback period | Quarters | Years |
| Primary earnings headwind | R&D compensation | Depreciation from physical asset base |
If Big Tech is structurally transitioning toward infrastructure economics, investors who valued these companies on software-era margin assumptions need to revisit those assumptions before the depreciation load becomes visible in reported earnings.
What comes next, and which metrics will show it first
The Alphabet CFO’s guidance was explicit: free cash flow will remain under pressure for multiple quarters. That makes this a baseline expectation, not a one-quarter anomaly to discount.
Forward guidance: Alphabet’s CFO stated FCF will “remain under pressure” for multiple quarters, driven by continued technical infrastructure investment.
The upcoming Microsoft, Amazon, and Meta earnings cycles will be the first meaningful test of whether AI infrastructure economics are industry-wide or specific to Alphabet and Tesla’s positions. Four metrics will show the answer first:
- Capex guidance direction: whether peers raise, hold, or moderate their own spending guidance
- Free cash flow trajectory: whether negative or compressed FCF is spreading across the sector
- AI revenue as a percentage of total capex: whether monetisation is keeping pace with the buildout
- Operating margin evolution: how quickly depreciation and energy costs erode margins as the asset base grows
The $514 billion Cloud backlog, with just over half expected to convert within 24 months, is the revenue-side benchmark. The $195-205 billion full-year capex guidance is the cost-side benchmark. The gap between them is where the thesis resolves or fails.
The price of building the next era of computing
The 22 July earnings session made one thing clear: the AI arms race now has quantifiable, quarter-by-quarter financial costs showing up in free cash flow and earnings across companies with very different core businesses. For Alphabet, that cost is fully documented. For Tesla, it is structurally coherent and sourced, though specific figures await independent cross-verification.
What is resolved: the capex commitment is real and growing, and the FCF pressure is documented and expected to persist. What is not: whether AI revenue will scale proportionally with infrastructure investment over the payback period.
The question is no longer whether the AI buildout is expensive. The answer to that arrived on Tuesday night. The question is whether the returns will justify it, and that answer will be written in the Cloud revenue and free cash flow data of the next two to three years.
The current AI investment cycle has already pushed US IT spending to 4.9% of GDP in Q1 2026, surpassing both the dot-com era peak and the cloud buildout peak, with Goldman Sachs projecting meaningful enterprise ROI will not emerge until 2027-2028, the same window Alphabet’s Cloud backlog conversion timeline implies.
This article is for informational purposes only and should not be considered financial advice. Investors should conduct their own research and consult with financial professionals before making investment decisions. Past performance does not guarantee future results. Financial projections are subject to market conditions and various risk factors.