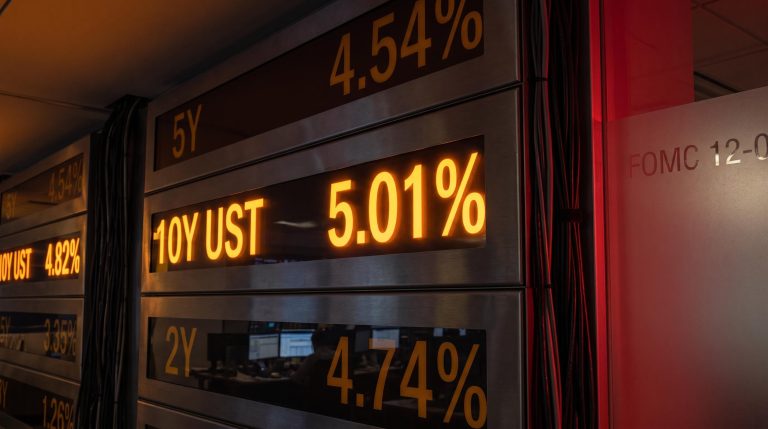
Here is a fund that has returned roughly 25-30% year-to-date in 2026, and it is being downgraded, reshuffled at a record pace, and out-yielded by a security that carries no risk at all.
That is the paradox facing the Schwab US Dividend Equity ETF (SCHD) right now. The price gains that thrilled holders have quietly compressed the trailing yield to around 3.0-3.1%, dividend growth for the first half of the year came in at essentially zero, the March 2026 index reconstitution churned through nearly a third of the portfolio, and the 2-year Treasury is sitting near 4%.
Each of those facts has generated a wave of commentary, and much of it points in different directions.
The question of whether to buy, hold, or sell SCHD is not one that current market conditions can answer on their own. It depends on your horizon, your income needs, and how you hold the fund.
Here is a structured way to work through the four concerns being raised, so you finish with a defensible basis for holding, adding, or stepping back, grounded in your own situation rather than the loudest headline.
The four concerns analysts are raising about SCHD right now
Before deciding anything, it helps to see all four worries laid out together rather than encountered one at a time across forums and analyst notes. This is a diagnostic inventory, not a verdict. Each item below is a measurable observation, not an abstract fear, and each carries a different weight depending on how long you plan to hold.
Here are the four concerns and the specific data anchoring each:
- Yield compression. SCHD’s trailing 12-month yield has slipped to approximately 3.0-3.1% (Schwab’s official product page reported 3.00% as of 31 August 2026; StockAnalysis reported 3.11% as of 14 September 2026), lower than income investors have grown used to.
- Flat dividend growth. First-half 2026 dividend growth came in at roughly 0.07-0.08% year-over-year, against U.S. inflation of approximately 3.4%. In real terms, the payout is not keeping pace with rising prices.
- Reconstitution risk. The March 2026 rebalance turned over roughly 31% of the portfolio, with about 25 additions and 22 removals, including the confirmed removal of Cisco Systems from the top 10.
- Fixed income competition. The 2-year Treasury near 4%, and money market funds paying roughly 3.5-4%, now offer more current income than SCHD’s forward yield of about 3.1%, with no credit risk attached.
Laid out side by side, the four concerns look like this.
| Concern | Key metric | Benchmark or context |
|---|---|---|
| Yield compression | 3.0-3.1% TTM yield | Down from prior periods as price surged |
| Flat dividend growth | 0.07-0.08% H1 2026 YoY | Vs. 3.4% U.S. inflation |
| Reconstitution risk | 31% turnover, 25 in, 22 out | Vs. typical 8-15% annual turnover |
| Fixed income competition | 2-year Treasury near 4% | Vs. SCHD forward yield ~3.1% |
Every one of these numbers is real. What determines whether any of them should worry you is your time horizon, and that is the dependency the rest of this analysis works through.
When big ASX news breaks, our subscribers know first
What the dividend growth stall and reconstitution actually mean for your income stream
The most common analytical error in the current SCHD debate is treating a lower yield as a declining dividend. They are not the same thing, and separating them changes the worry entirely.
SCHD’s roughly 29% year-to-date rally is the primary reason the yield has compressed to around 3.12%, per framing from ts2.tech. When a fund’s price rises faster than its payout, the yield mechanically falls. That is a market-driven dynamic, and it reverses if the price falls. It is not evidence that the underlying companies are cutting or freezing their distributions.
The actual dividend paid tells a calmer story. SCHD distributed approximately $0.50 per share in the first half of 2026, and the flat year-over-year growth reflects modest single-digit increases from large holdings such as Pepsi and Coca-Cola rather than any collapse in the payout engine.
Here is what that means for your income stream: the yield compression is largely your holding doing exactly what dividend investors want it to do over time, appreciate in price. The half-year of near-zero growth is real, but a single six-month window is a poor anchor for a multi-decade decision.
The longer-term picture supports patience. Even with a flat first half, SCHD’s compounded annual dividend growth rate measured over five or ten years has historically averaged in the 8-10% range, according to the original source framing.
Valuation adds another layer of support. At the review date SCHD traded at a blended price-to-earnings ratio of roughly 19.3-19.57x (Schwab and Trefis), the P/E ratio being the price paid for each dollar of company earnings, against the S&P 500 near 25x. That works out to an approximately 23% valuation discount.
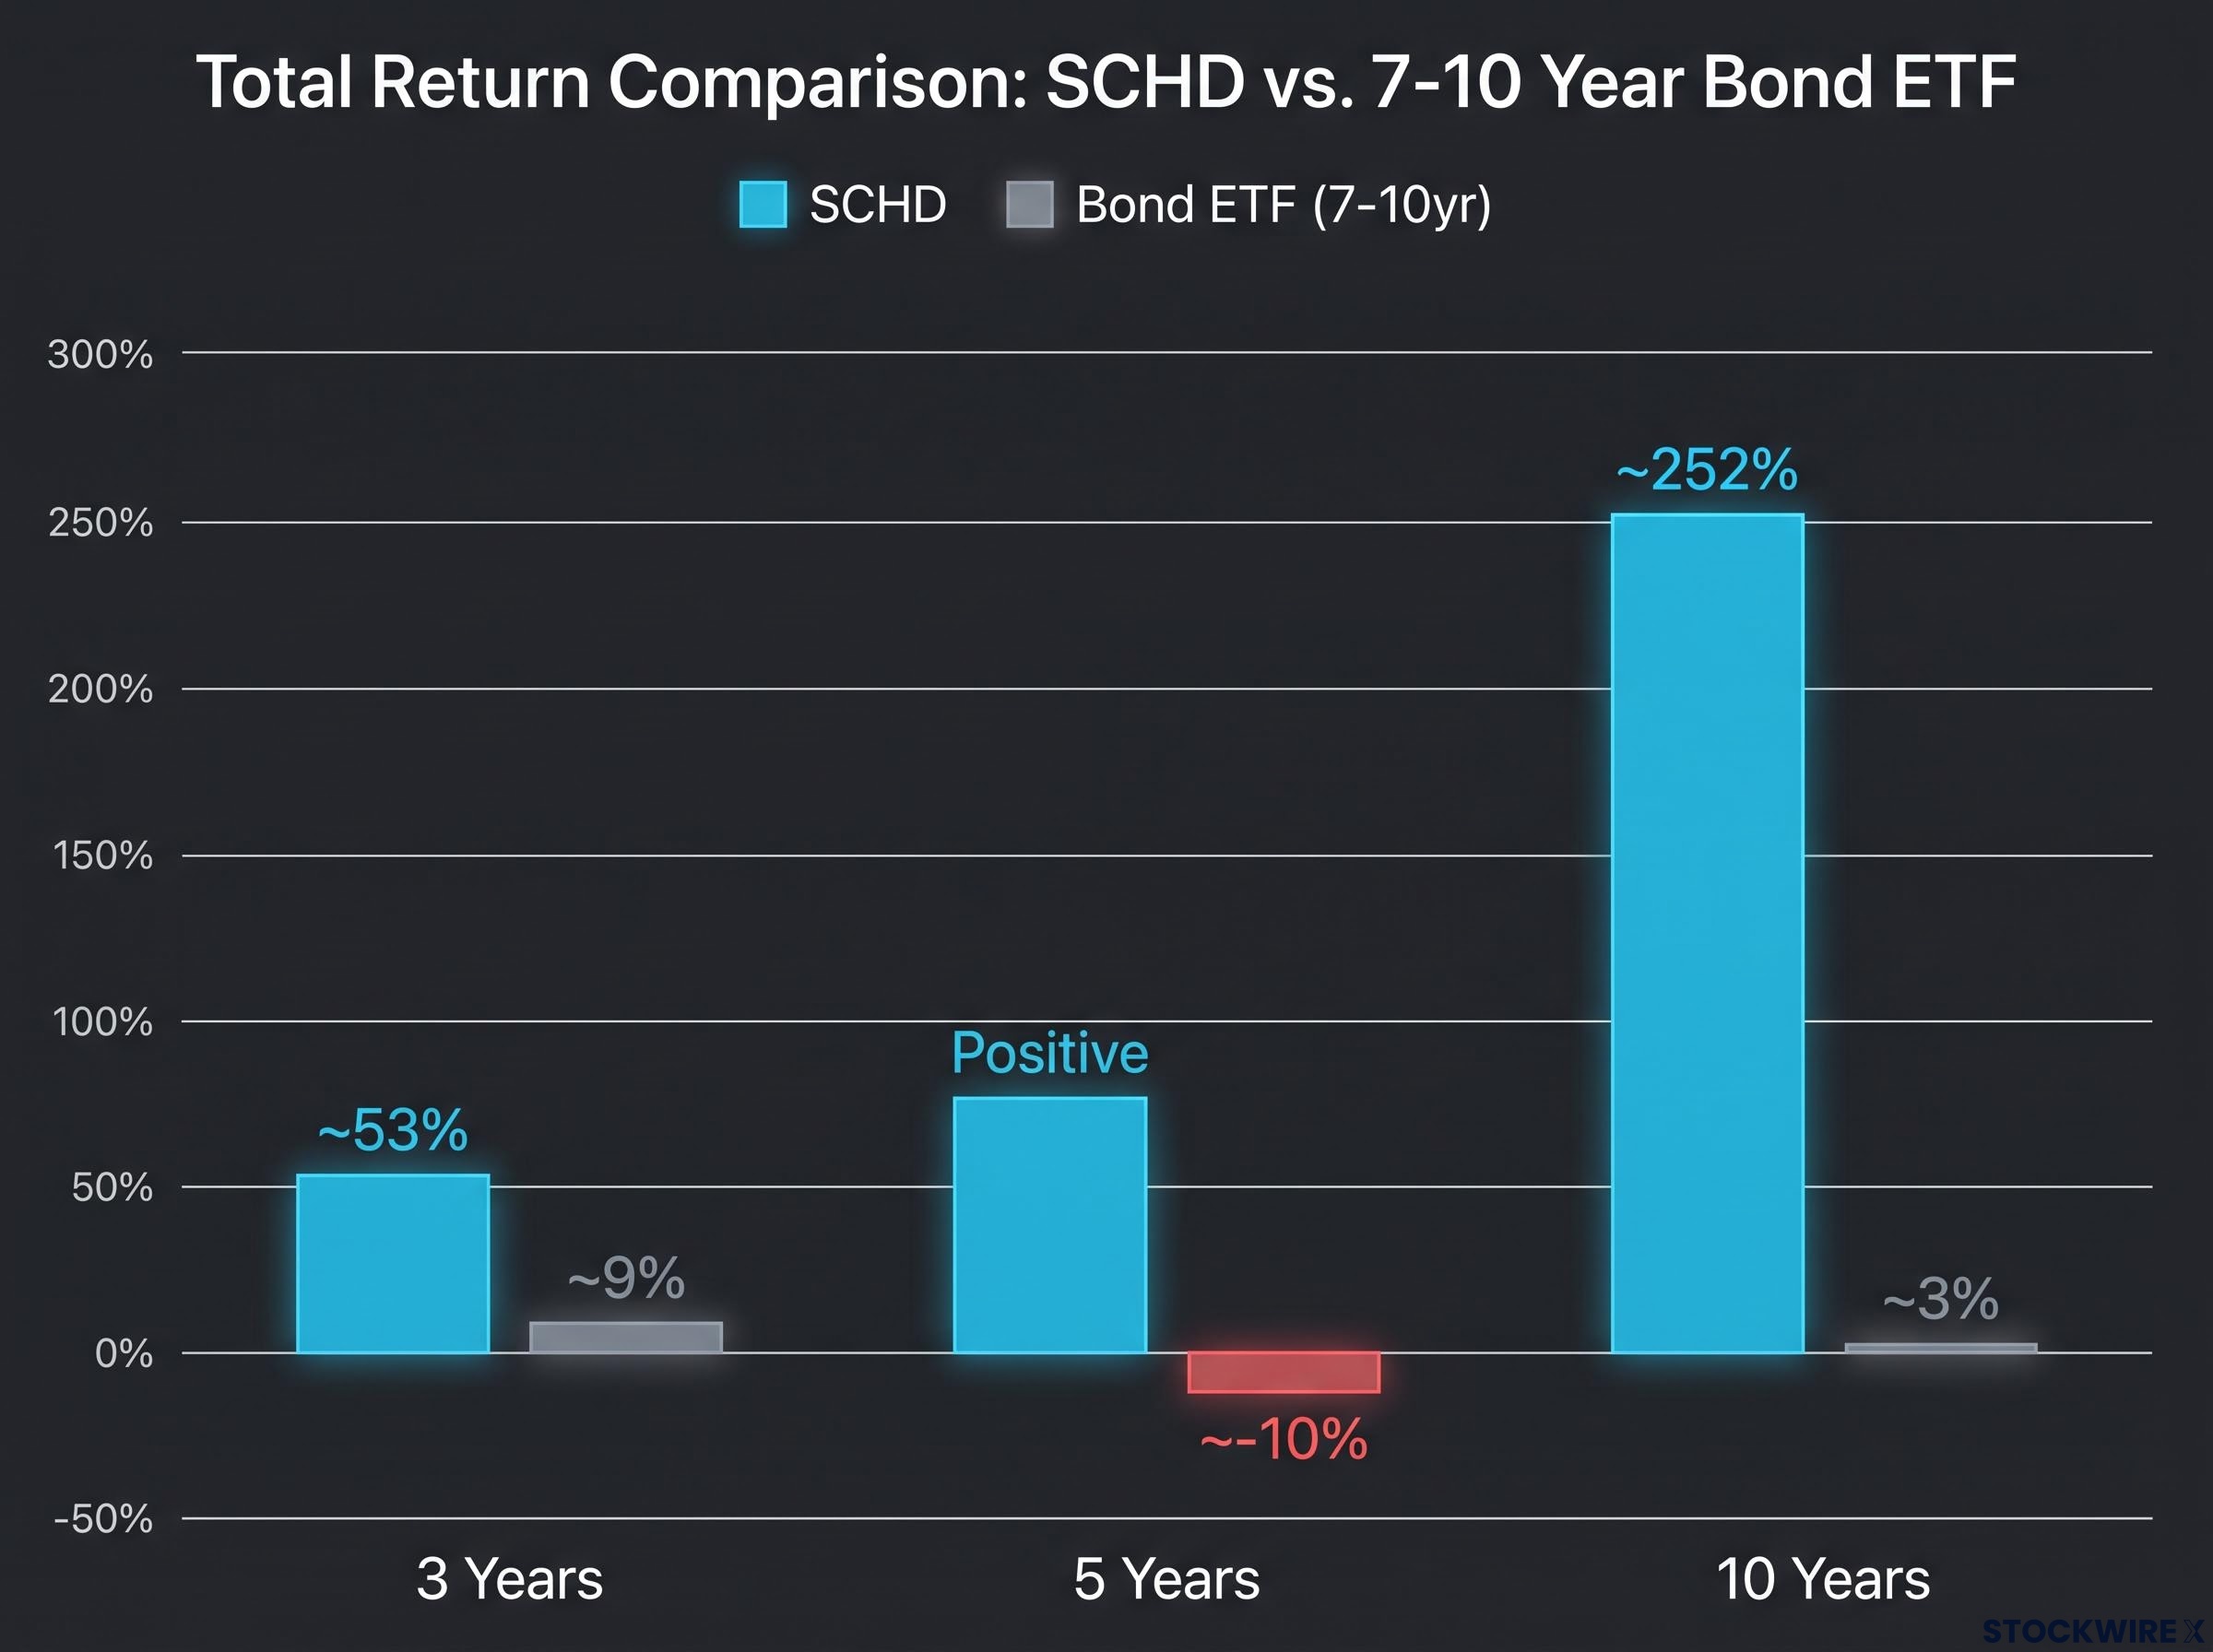
Over a 10-year period, SCHD returned approximately 252% in total, compared with roughly 3% for a 7-to-10-year bond ETF, per the original source. That gap is the long-term reward for owning the dividend-growth compounding engine rather than the current-income alternative.
Why the 31% reconstitution is not what it looks like
A 31% portfolio turnover sounds alarming when the fund typically turns over 8-15% a year. But this was not a manager placing a discretionary bet. SCHD follows a rules-based index, and the screens simply responded to changed market conditions by swapping holdings that no longer qualified for ones that do.
Yahoo Finance flagged the opportunity cost, noting the index sold two top-10 holdings right before a strong stretch. That concern is fair, but it is a structural feature you accepted the moment you chose a rules-based passive vehicle, not a surprise failure of the fund. The discipline that removes winners early is the same discipline that removes laggards without hesitation.
Payout ratio screening is the quality gate that separates dividend compounders from dividend traps; a free cash flow payout ratio creeping above 70% over several years can signal slowing earnings growth masked by maintained distribution increases, the precise dynamic that SCHD’s rules-based index is designed to filter out before a holding reaches the reconstitution trigger.
Treasuries at 4%: does a risk-free yield this close to SCHD’s actually change the calculus?
This is the section where the temptation to move is strongest, so it deserves an honest comparison rather than a brush-off.
The income investor’s observation is valid. A 2-year Treasury near 4%, or a money market fund paying 3.5-4%, offers more current yield than SCHD at 3.0-3.1%, and it does so with essentially no credit risk. On a pure current-income basis, fixed income genuinely wins right now.
The tension between yield and price appreciation is precisely the fault line that the dividend investing vs total return debate has mapped across a decade of backtested data, with a total market portfolio compounding at 10.49% annualised against a dividend-focused portfolio at 9.43% from 2016 to 2025.
The picture changes the moment you extend the horizon. The original source provides a total return comparison against a 7-to-10-year bond ETF that is difficult to ignore.
| Period | SCHD total return | Bond ETF (7-10yr) total return |
|---|---|---|
| 3 years | ~53% | ~9% |
| 5 years | Positive | ~-10% |
| 10 years | ~252% | ~3% |
The read here is an asymmetry you should weigh explicitly. The yield differential with Treasuries is a snapshot of current income. The total return record consistently overturns that snapshot over any horizon beyond two or three years. Over five years, the bond ETF actually lost around 10% while SCHD stayed positive.
There is also a cost advantage that compounds quietly in the background. SCHD carries an expense ratio of just 0.06%, and the Motley Fool described its roughly 29.29% year-to-date total return by mid-September 2026 as a stunning reversal from earlier underperformance.
The practical distinction matters more than the raw comparison.
Pausing new contributions to SCHD in favour of Treasuries is a reasonable choice, particularly for income-focused or near-retirement investors. Selling existing positions to rotate into bonds is a different animal entirely: it is a market-timing bet, and re-entering at the right moment is a call most investors are unlikely to get right.
For a long-term holder, the four-percent Treasury is a better current-income instrument that has historically been a worse wealth-accumulation instrument. Those are two separate questions, and conflating them is where rotation decisions go wrong.
Thirty-five years of Dividend Aristocrats data reinforces the same asymmetry: dividend-growth compounding produced an average outperformance of 1.6 percentage points per year over the S&P 500, with the strongest evidence concentrated in 20-to-35-year windows rather than shorter horizons where current-income instruments can appear to lead.
Valuation discount, long-term compounders, and what would actually justify selling
Rather than argue endlessly for holding, it is more useful to define what would genuinely justify selling. Setting that bar clearly shows how far current conditions sit from meeting it.
The clearest analyst-stated sell trigger comes from the Seeking Alpha piece by Millennial Dividends: if SCHD’s valuation discount to the S&P 500 narrows below approximately 20%, the relative value case weakens materially, because you would be giving up the higher-growth exposure of the broad index for too little discount.
Where does that threshold sit today? SCHD’s blended P/E of roughly 19.3-19.57x against the S&P 500’s 25x is about a 23% discount, near the floor but still above it. The trigger has not been hit.
Independent SCHD fund analysis from Morningstar corroborates the valuation discount relative to the broader market, providing a cross-reference for the blended P/E and yield figures that anchor the current debate about whether the ETF’s income profile justifies its price.
For anyone holding SCHD in a taxable account, the sell-trigger logic gets weaker still. Selling to reposition based on valuation proximity means realising capital gains, an immediate and certain tax cost, in exchange for an uncertain, probabilistic benefit. That trade rarely favours the investor.
The rule-based structure is the quiet advantage here. The methodology embeds emotional discipline that most individual investors cannot replicate during volatility, which is precisely when timing errors get made. SCHD’s own history illustrates the point: the original source notes a 27% gain in 2019 followed by roughly 15% and then approximately 30% in subsequent years, evidence that outperformance streaks tend to extend rather than snap back immediately.
Three conditions would genuinely justify reconsidering the position:
- The valuation discount to the S&P 500 narrows below approximately 20%, eroding the relative value case.
- You are in or near retirement and your current income need exceeds what SCHD’s roughly 3% yield provides.
- You hold SCHD in a tax-advantaged account and have a documented, rules-based reallocation plan, not a timing thesis dressed up as one.
If your situation, your tax status, income need, and horizon, does not tick any of those boxes, the case for selling is weak. For context, StockRover 2025 data showed SCHD up 26.4% year-to-date against its category at 15.3% and the S&P 500 at 12.4%, and the original source estimates roughly 90% of SCHD holders are long-term participants for whom none of the three triggers currently apply.
The case for pausing contributions without selling
Pausing new contributions is a genuinely different decision from selling, with different risk and tax implications. You keep the compounding position intact, avoid realising any gains, and simply redirect fresh cash elsewhere.
For income-focused investors, especially those in or near retirement, the current-yield argument for the pause is legitimate. A Treasury near 4% paying more today than SCHD’s 3.1% is a real advantage for someone drawing income now, even while the long-term total return case for holding the existing shares remains intact.
Making the call: a framework for the 90% who should not be trading this at all
The hold, sell, or stop-adding question is not really about the market. It is about you: your investment horizon, your income need, your account’s tax status, and how large SCHD has grown within your portfolio.
Rather than hand you a verdict, here is a decision tree so you can place yourself. Most SCHD holders fall into one of three situations.
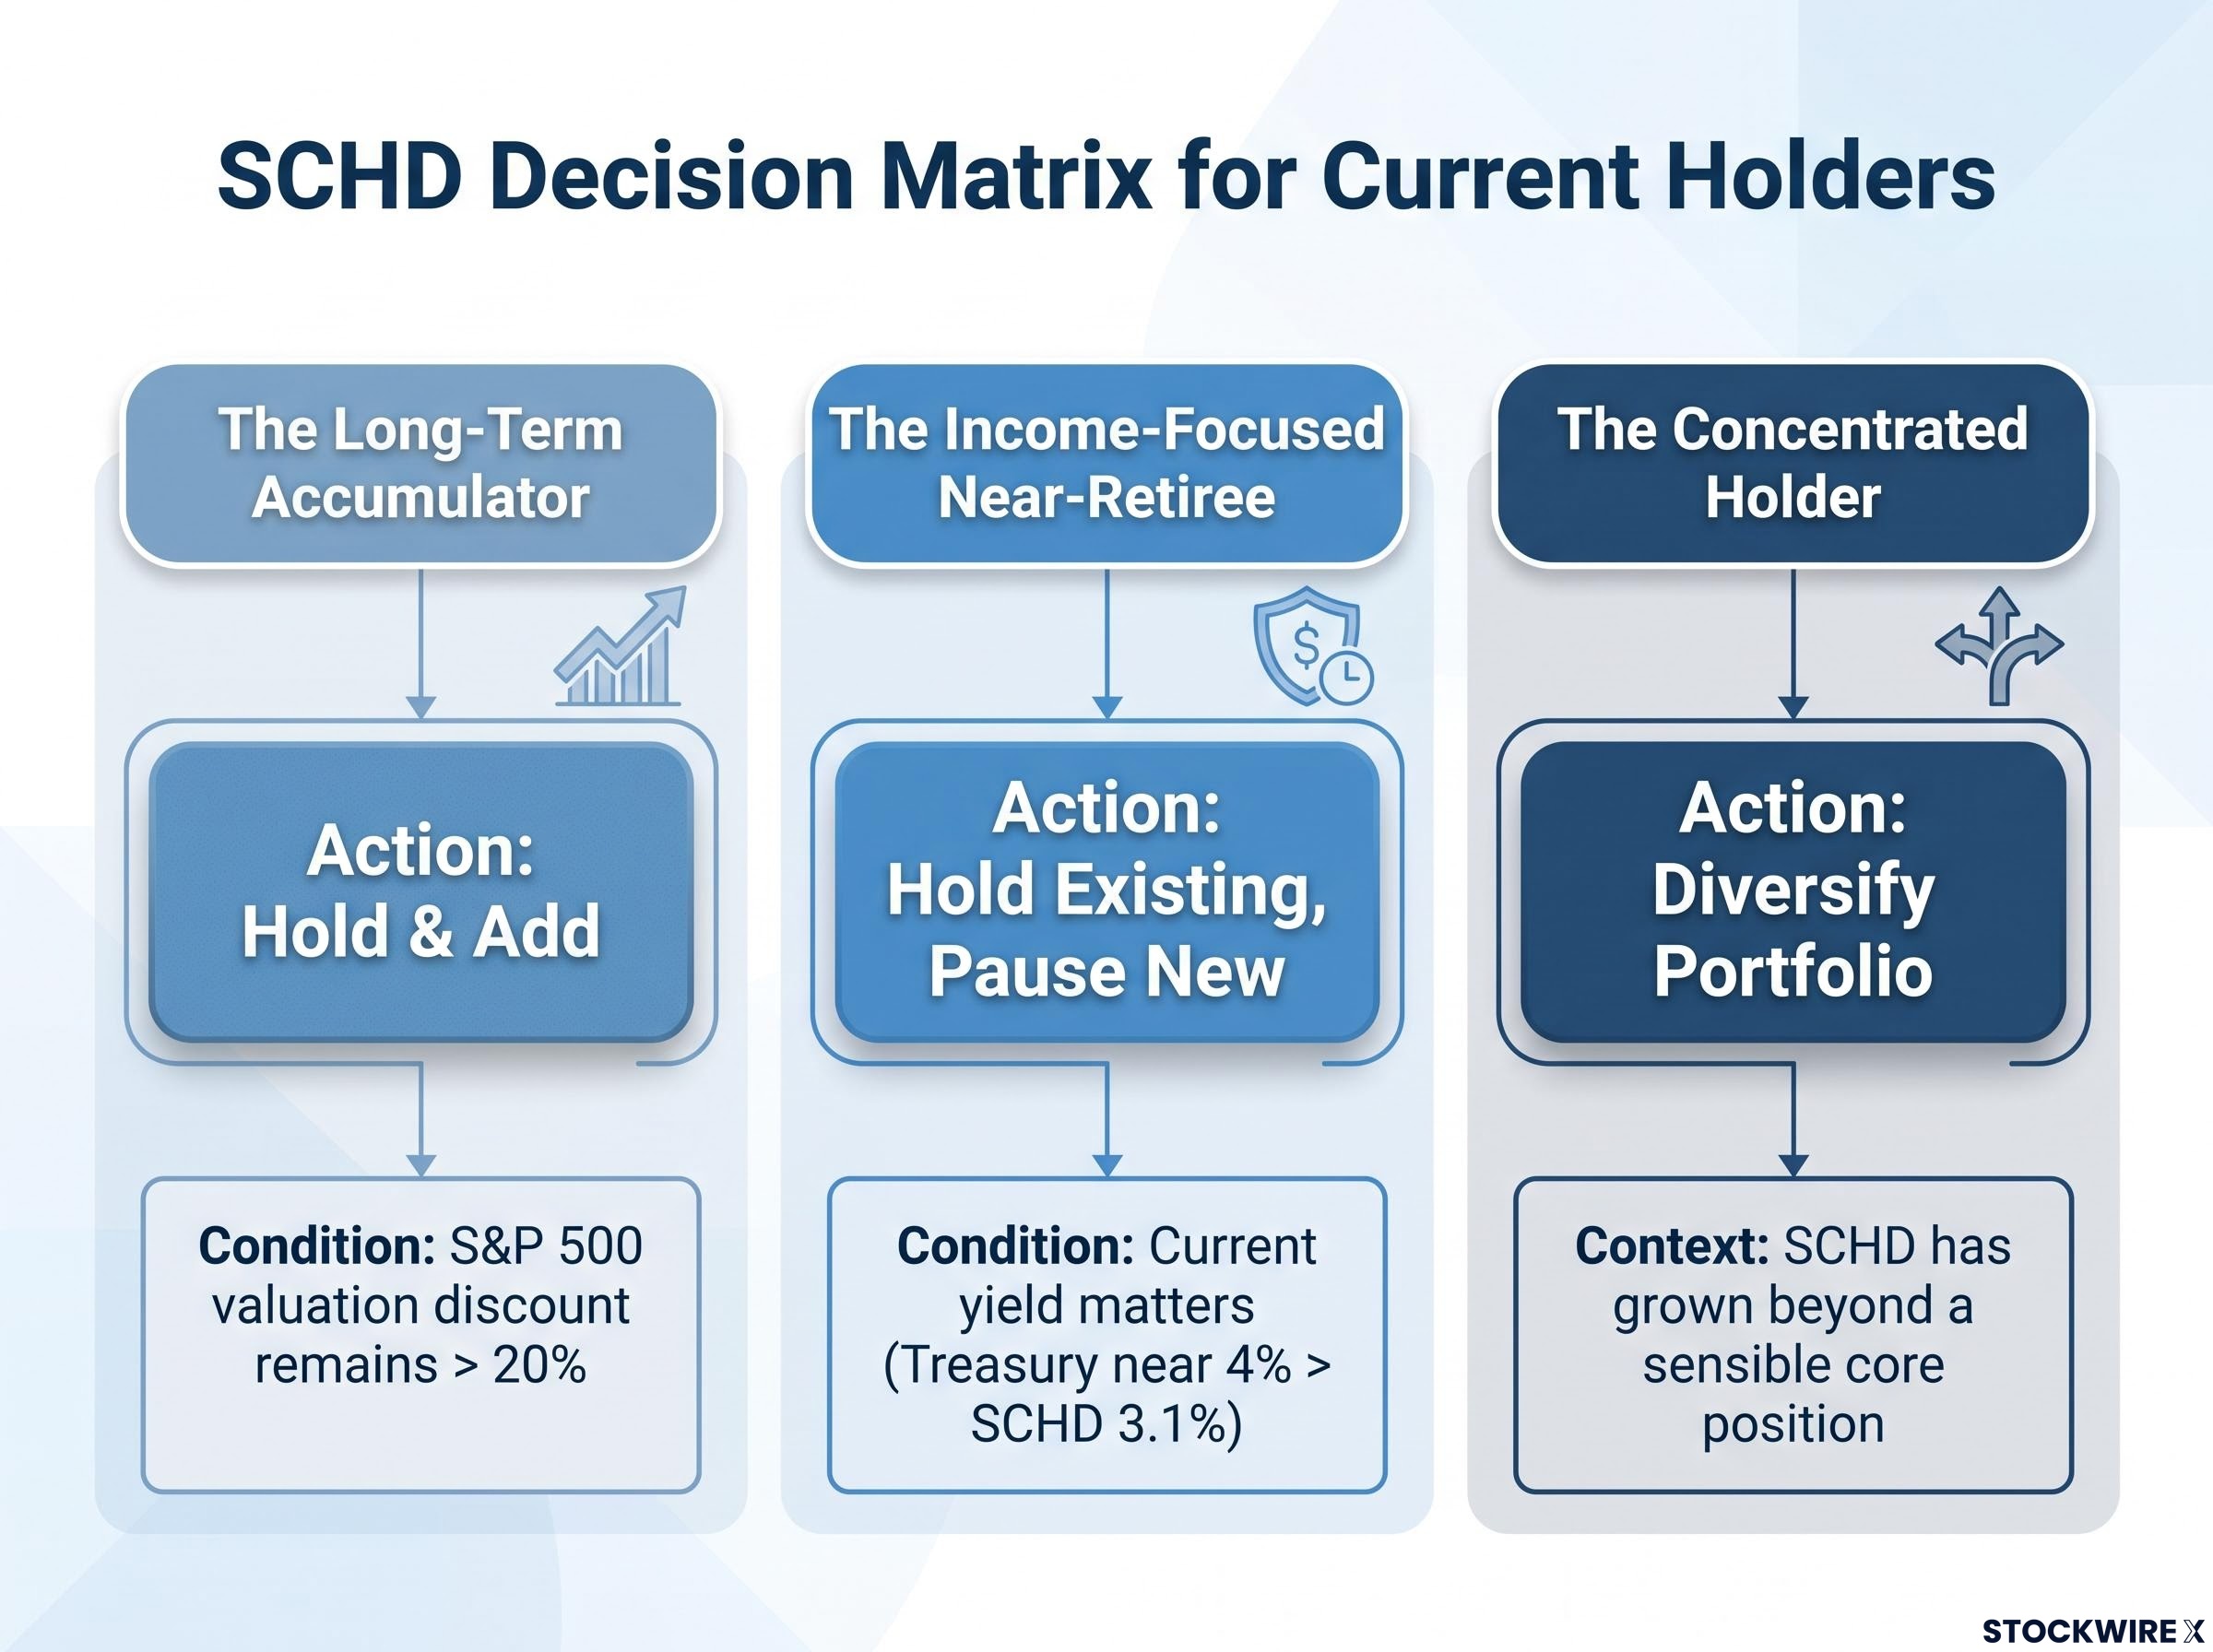
- The long-term accumulator. Years from needing the income, building wealth through compounding. The action is a strong hold, and continuing to add makes sense as long as the valuation discount to the S&P 500 holds above the roughly 20% line.
- The income-focused near-retiree. Current yield matters more than 10-year total return. The action is to hold existing shares while considering a pause on new contributions in favour of higher-yielding fixed income.
- The concentrated holder. SCHD has grown well beyond a sensible core position. The action is to review your overall allocation, not to indict the ETF itself. The fix is diversification, not exit.
Income-focused investors trying to close the gap between SCHD’s 3.1% yield and a retirement income target will find our full explainer on building a $60,000 income portfolio, which models the specific 33/67 SCHD and closed-end fund allocation that reaches a 6% blended yield on any portfolio size.
The original source recommends SCHD as a core position within a diversified portfolio that also holds bonds, higher-yield dividend stocks, and dividend-growth equities. It was never designed to be the whole portfolio.
Investors who exited SCHD during the 2024-2025 underperformance period and did not re-enter before the 2026 rally illustrate the practical cost of timing-driven exits from a buy-and-hold vehicle. They avoided a slump and then missed a roughly 25-30% year-to-date recovery.
The rule-based methodology is the structural answer to all this noise. The index rules exist precisely so you do not have to make a correct timing call, and at 0.06% the cost of letting them run stays negligible regardless of short-term worry.
What the data says SCHD still is, and what it was never supposed to be
Strip away the headlines and the 2026 data confirms something simple: SCHD is doing what it was built to do. It is compounding price and dividend returns at a valuation discount to the market, even where individual short-term metrics fall short of ideal.
The core figures hold up. A TTM yield of roughly 3.0-3.1%, an expense ratio of 0.06%, and a blended P/E of about 19.57x as of 31 August 2026 (Schwab) against the S&P 500 near 25x, with a 10-year total return of approximately 252% anchoring the long-term case. The rule-based, passive methodology is what separates it from actively managed income funds that depend on a manager’s judgment.
There is one variable that genuinely changes the picture. If your income need has evolved beyond what a 3% yield can support, SCHD may no longer be the right primary vehicle, regardless of how strong the long-term total return case remains. That is the honest question to ask yourself, and it has nothing to do with quarterly yield noise.
Looking ahead, two structural variables are worth watching rather than the monthly yield wobble:
- The outcome of the next index reconstitution and how much it reshapes the yield and growth profile.
- The Federal Reserve rate trajectory and how the resulting yield spread between SCHD and short-term fixed income evolves.
This article is for informational purposes only and should not be considered financial advice. Investors should conduct their own research and consult with financial professionals before making investment decisions. Past performance does not guarantee future results. Financial projections are subject to market conditions and various risk factors.