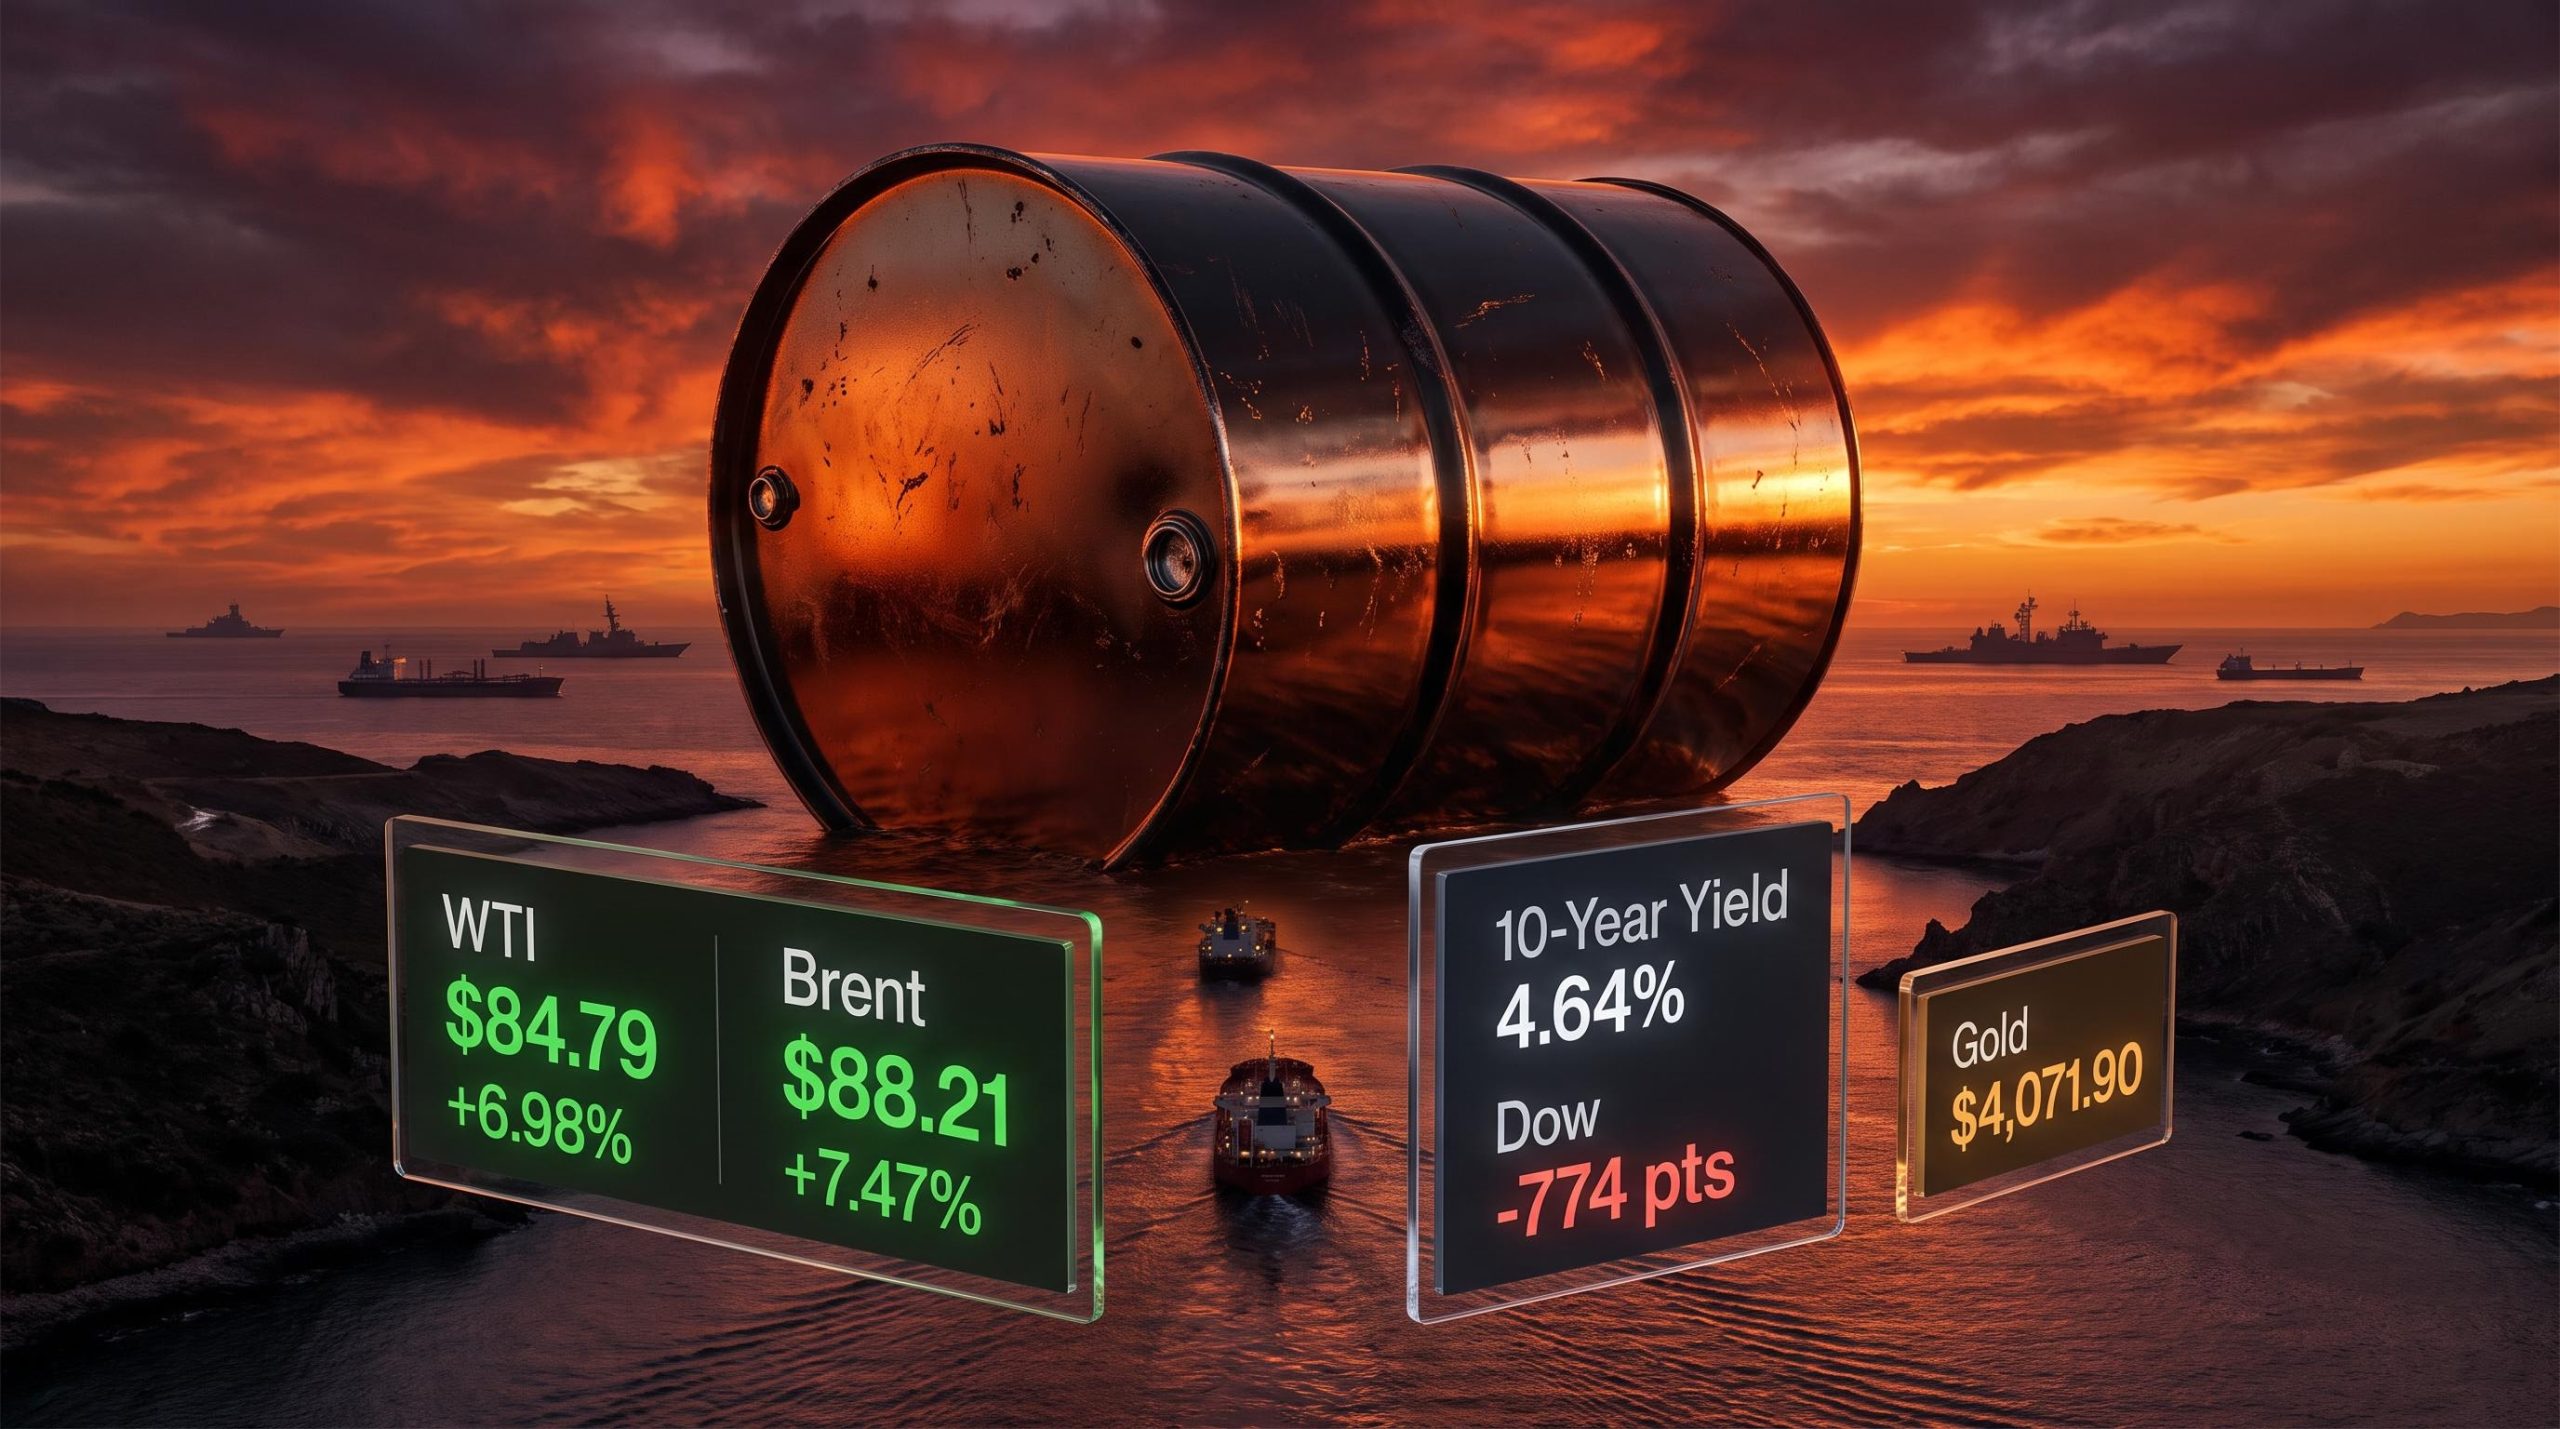
Crude oil posted its largest single-day surge in months on 29 July 2026, with WTI futures climbing 6.98% and Brent rising 7.47%, on the same afternoon the Federal Reserve held interest rates steady. The collision of a geopolitical energy shock and a central bank decision compressed two of the year’s most consequential macro forces into a single session.
The oil price surge was not driven by a supply outage or a demand spike. It was the cost of a diplomatic collapse. The interim U.S.-Iran peace framework that had eased Strait of Hormuz fears since June fell apart in a matter of days, and the risk premium that markets had spent weeks stripping out of crude prices snapped back in hours.
Here is what each moving piece means for your portfolio today: the mechanism behind the oil spike, the reason yields and equities moved in the direction they did, and what the cross-asset pattern tells you about where institutional risk appetite stands right now.
How the U.S.-Iran peace deal collapsed and why oil repriced so fast
The timeline was compressed enough to catch most of the market leaning the wrong way. An interim peace framework reached after the June 2026 FOMC meeting had briefly calmed Hormuz supply-disruption fears, and crude prices softened as traders priced in normalised shipping flows. That framework lasted weeks, not months.
Resumed U.S. military strikes on Iranian targets in mid-July cracked the arrangement open. President Trump declared the ceasefire “over,” and the market repriced accordingly, almost instantly. By the close on 29 July, the damage was clear:
WTI Crude Oil Futures closed at $84.79, up 6.98% on the day. Brent Crude Oil Futures closed at $88.21, up 7.47% on the day. (Investing.com)
An earlier spike within the broader July episode had already pushed WTI to approximately $74.71 (+6.1%) and Brent to approximately $79.07 (+6.6%), according to Reuters, meaning 29 July was the climax of a multi-week escalation, not an isolated headline.
Why the move was so large so fast
The size of the spike reflects what was being unwound. Traders had spent the post-June period discounting geopolitical risk from crude, so the collapse did not just re-introduce that risk; it punished the positioning built on the assumption the deal would hold. That distinction matters: a risk-premium re-entry driven by the failure of priced-in optimism tends to be stickier than a one-day supply scare.
Geopolitical risk premiums on crude behave asymmetrically: they accumulate slowly as diplomatic optimism builds and then collapse in hours when that optimism fails, a pattern Barclays and Goldman Sachs both flagged as the dominant pricing mechanism during the May 2026 escalation cycle.
When big ASX news breaks, our subscribers know first
What the Fed’s rate hold meant on a day oil was already running
The Fed held rates on 29 July as expected. On any other day, the decision would have landed as routine. On a day crude was already up 7%, the hold carried a different weight.
The interim peace framework had given the Fed a benign energy-price backdrop. Calmer oil meant softer headline inflation readings, which in turn supported the disinflation narrative underpinning market expectations for rate cuts later in the year. The ceasefire collapse stripped that backdrop away. Oil above $84 reintroduces upside energy-price risk directly into the inflation calculus the Fed uses to justify any pivot toward easing.
Oil above $84 reintroduces an energy-price component that the FOMC has explicitly treated as a tightening-bias input: the April 28-29 minutes cited Middle East supply disruptions as a direct factor in the inflation outlook, with a majority of committee members flagging conditions as far from meeting the bar for rate cuts.
The bond market priced the implication immediately:
- U.S. 10-Year Treasury Yield: rose to 4.64%, up approximately 0.78% on the day (Investing.com)
- U.S. 30-Year Treasury Yield: rose to approximately 5.14%, up approximately 0.90% on the day (Investing.com)
A 30-year yield approaching 5.14% on the same day oil surges 7% tells you the market is pricing a longer period of elevated rates than it expected that morning. That revision is the transmission mechanism for the equity weakness that followed: higher yields driven by inflation expectations raise the discount rate applied to future corporate earnings, which is why stocks fell even before the Fed said a word.
Why the Strait of Hormuz is the variable every energy investor is watching
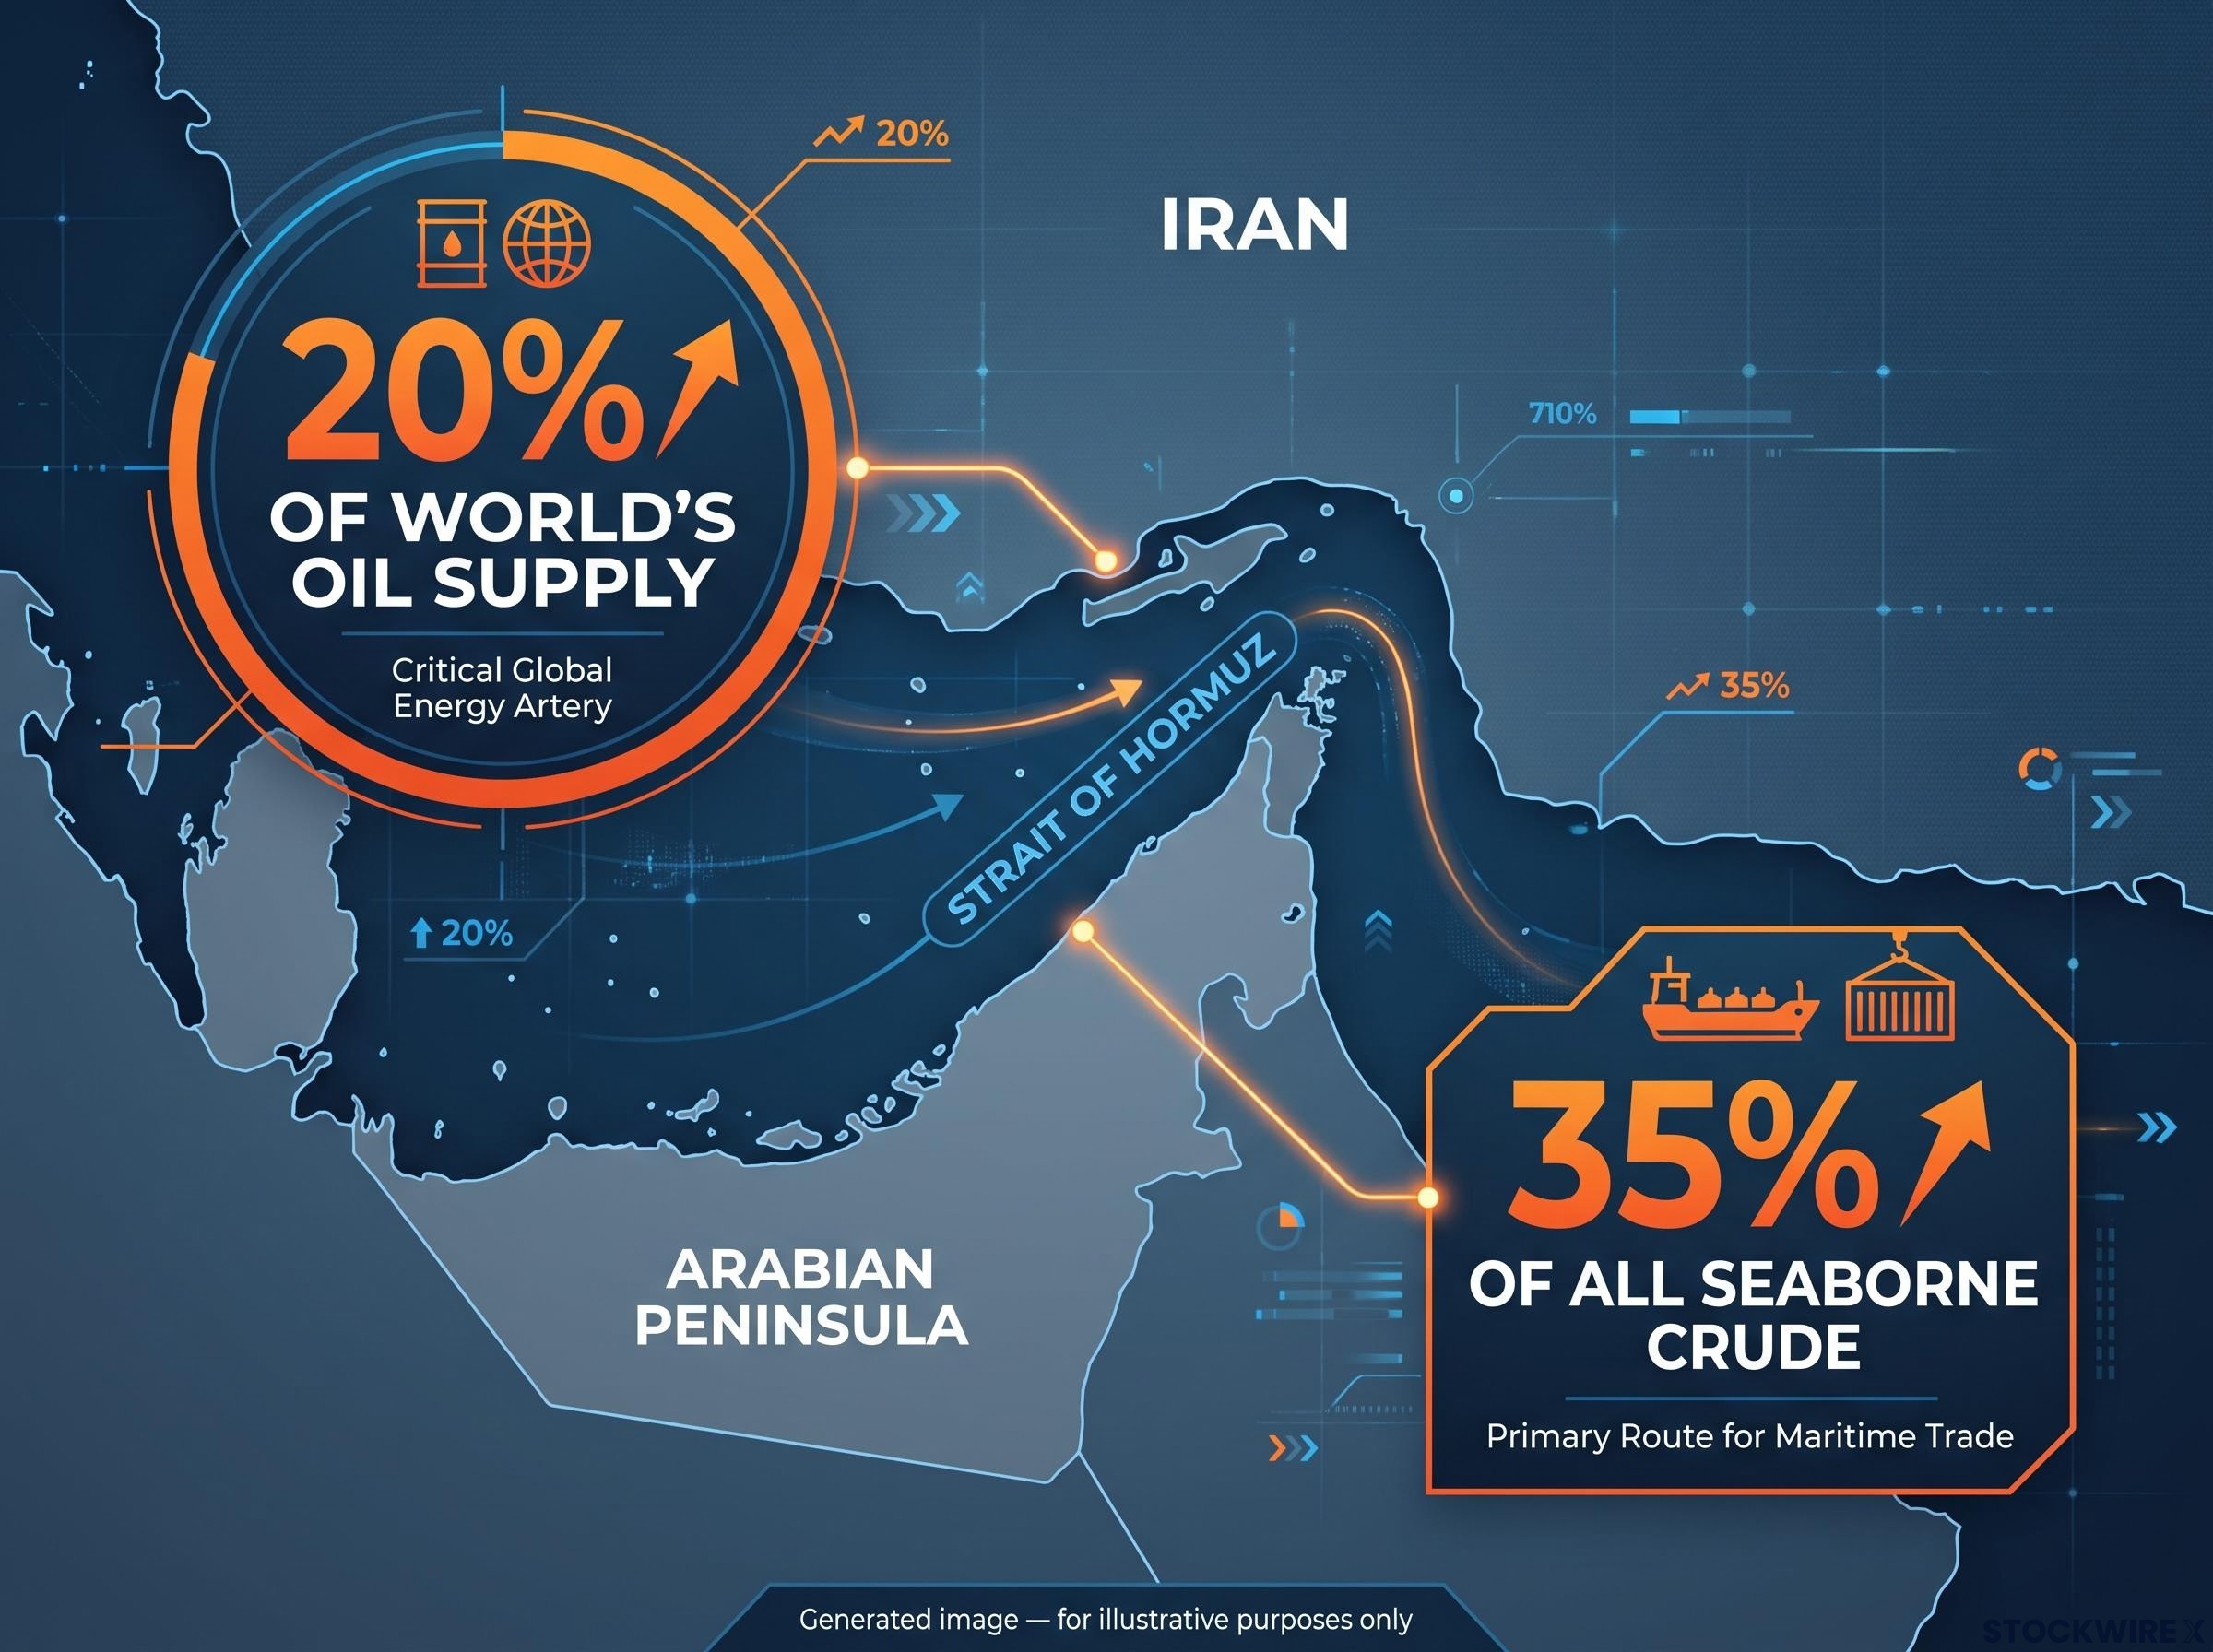
The speed at which a diplomatic breakdown translates into a 7% oil move only makes sense when you understand the physical chokepoint at the centre of it. The Strait of Hormuz is a narrow waterway between Iran and the Arabian Peninsula, and roughly 20% of the world’s oil supply, approximately 35% of all seaborne crude, passes through it.
The EIA world oil transit chokepoints analysis confirms that total oil flows through the Strait of Hormuz averaged 20.9 million barrels per day in the first half of 2025, equivalent to roughly 20% of global petroleum liquids consumption, a volume concentration that makes any diplomatic breakdown an immediate pricing event.
When that passage is under threat, global oil pricing shifts within hours because there is no alternative route that can absorb the volume. The following structural facts explain why:
- Hormuz handles more daily oil volume than any other transit point on the planet
- There is no pipeline bypass capable of replacing the throughput if shipping is disrupted
- Insurance premiums on tanker routes through the strait respond to headline risk in real time, raising the effective cost of crude even when no physical disruption has occurred
The escalation-and-relief cycle since June 2026
The pattern since June 2026 has been consistent: the peace framework produced large oil-price drops and equity rallies as Hormuz flows appeared set to normalise; each deterioration in the framework produced a spike of comparable magnitude in the opposite direction.
If a single political statement can move global oil prices by nearly 7% in a day, the Strait of Hormuz is not background risk for energy investors right now. It is the dominant pricing variable, and it will remain so until a durable agreement replaces the collapsed interim deal. Investors need to treat the escalation-and-relief cycle as repeating rather than resolved.
Semiconductors took the sharpest hit: the yield-duration connection explained
The Dow’s headline drop anchored the equity story:
The Dow Jones Industrial Average fell 774 points (-1.47%) to 51,972.98 on 29 July 2026 (Investing.com).
The S&P 500 dropped 0.45% to 7,395.52, and the Nasdaq Composite slipped 0.26% to 24,813.50. But the chip names told a sharper story beneath the index moves.
Semiconductor stocks are long-duration growth assets, meaning their valuations are built on earnings projected years into the future. When yields rise because of inflation expectations rather than growth optimism, those distant earnings get discounted at a higher rate, and the present value of the stock compresses. That is exactly the mechanism that hit the sector on 29 July.
Semiconductor valuation multiples had already compressed more than 20% from the June 2026 SOX peak before 29 July, meaning the inflation-driven yield rise arrived at a sector already absorbing a post-peak multiple reset and elevated institutional exit positioning.
| Stock | Move (%) | Closing Price | Volume |
|---|---|---|---|
| NVIDIA | -2.18% | $192.72 | ~79.52M shares |
| Micron Technology | -6.46% | $767.50 | ~41.40M shares |
| AMD | -3.17% | $440.23 | N/A |
Micron’s 6.46% decline on an oil-shock day is not a chip story. It is a rates story wearing chip-stock clothing. If you hold semiconductor positions, that vulnerability does not disappear when the session ends; it persists as long as yields stay elevated on inflation risk.
Gold above $4,000 and a rising VIX: what the safe-haven signals are saying
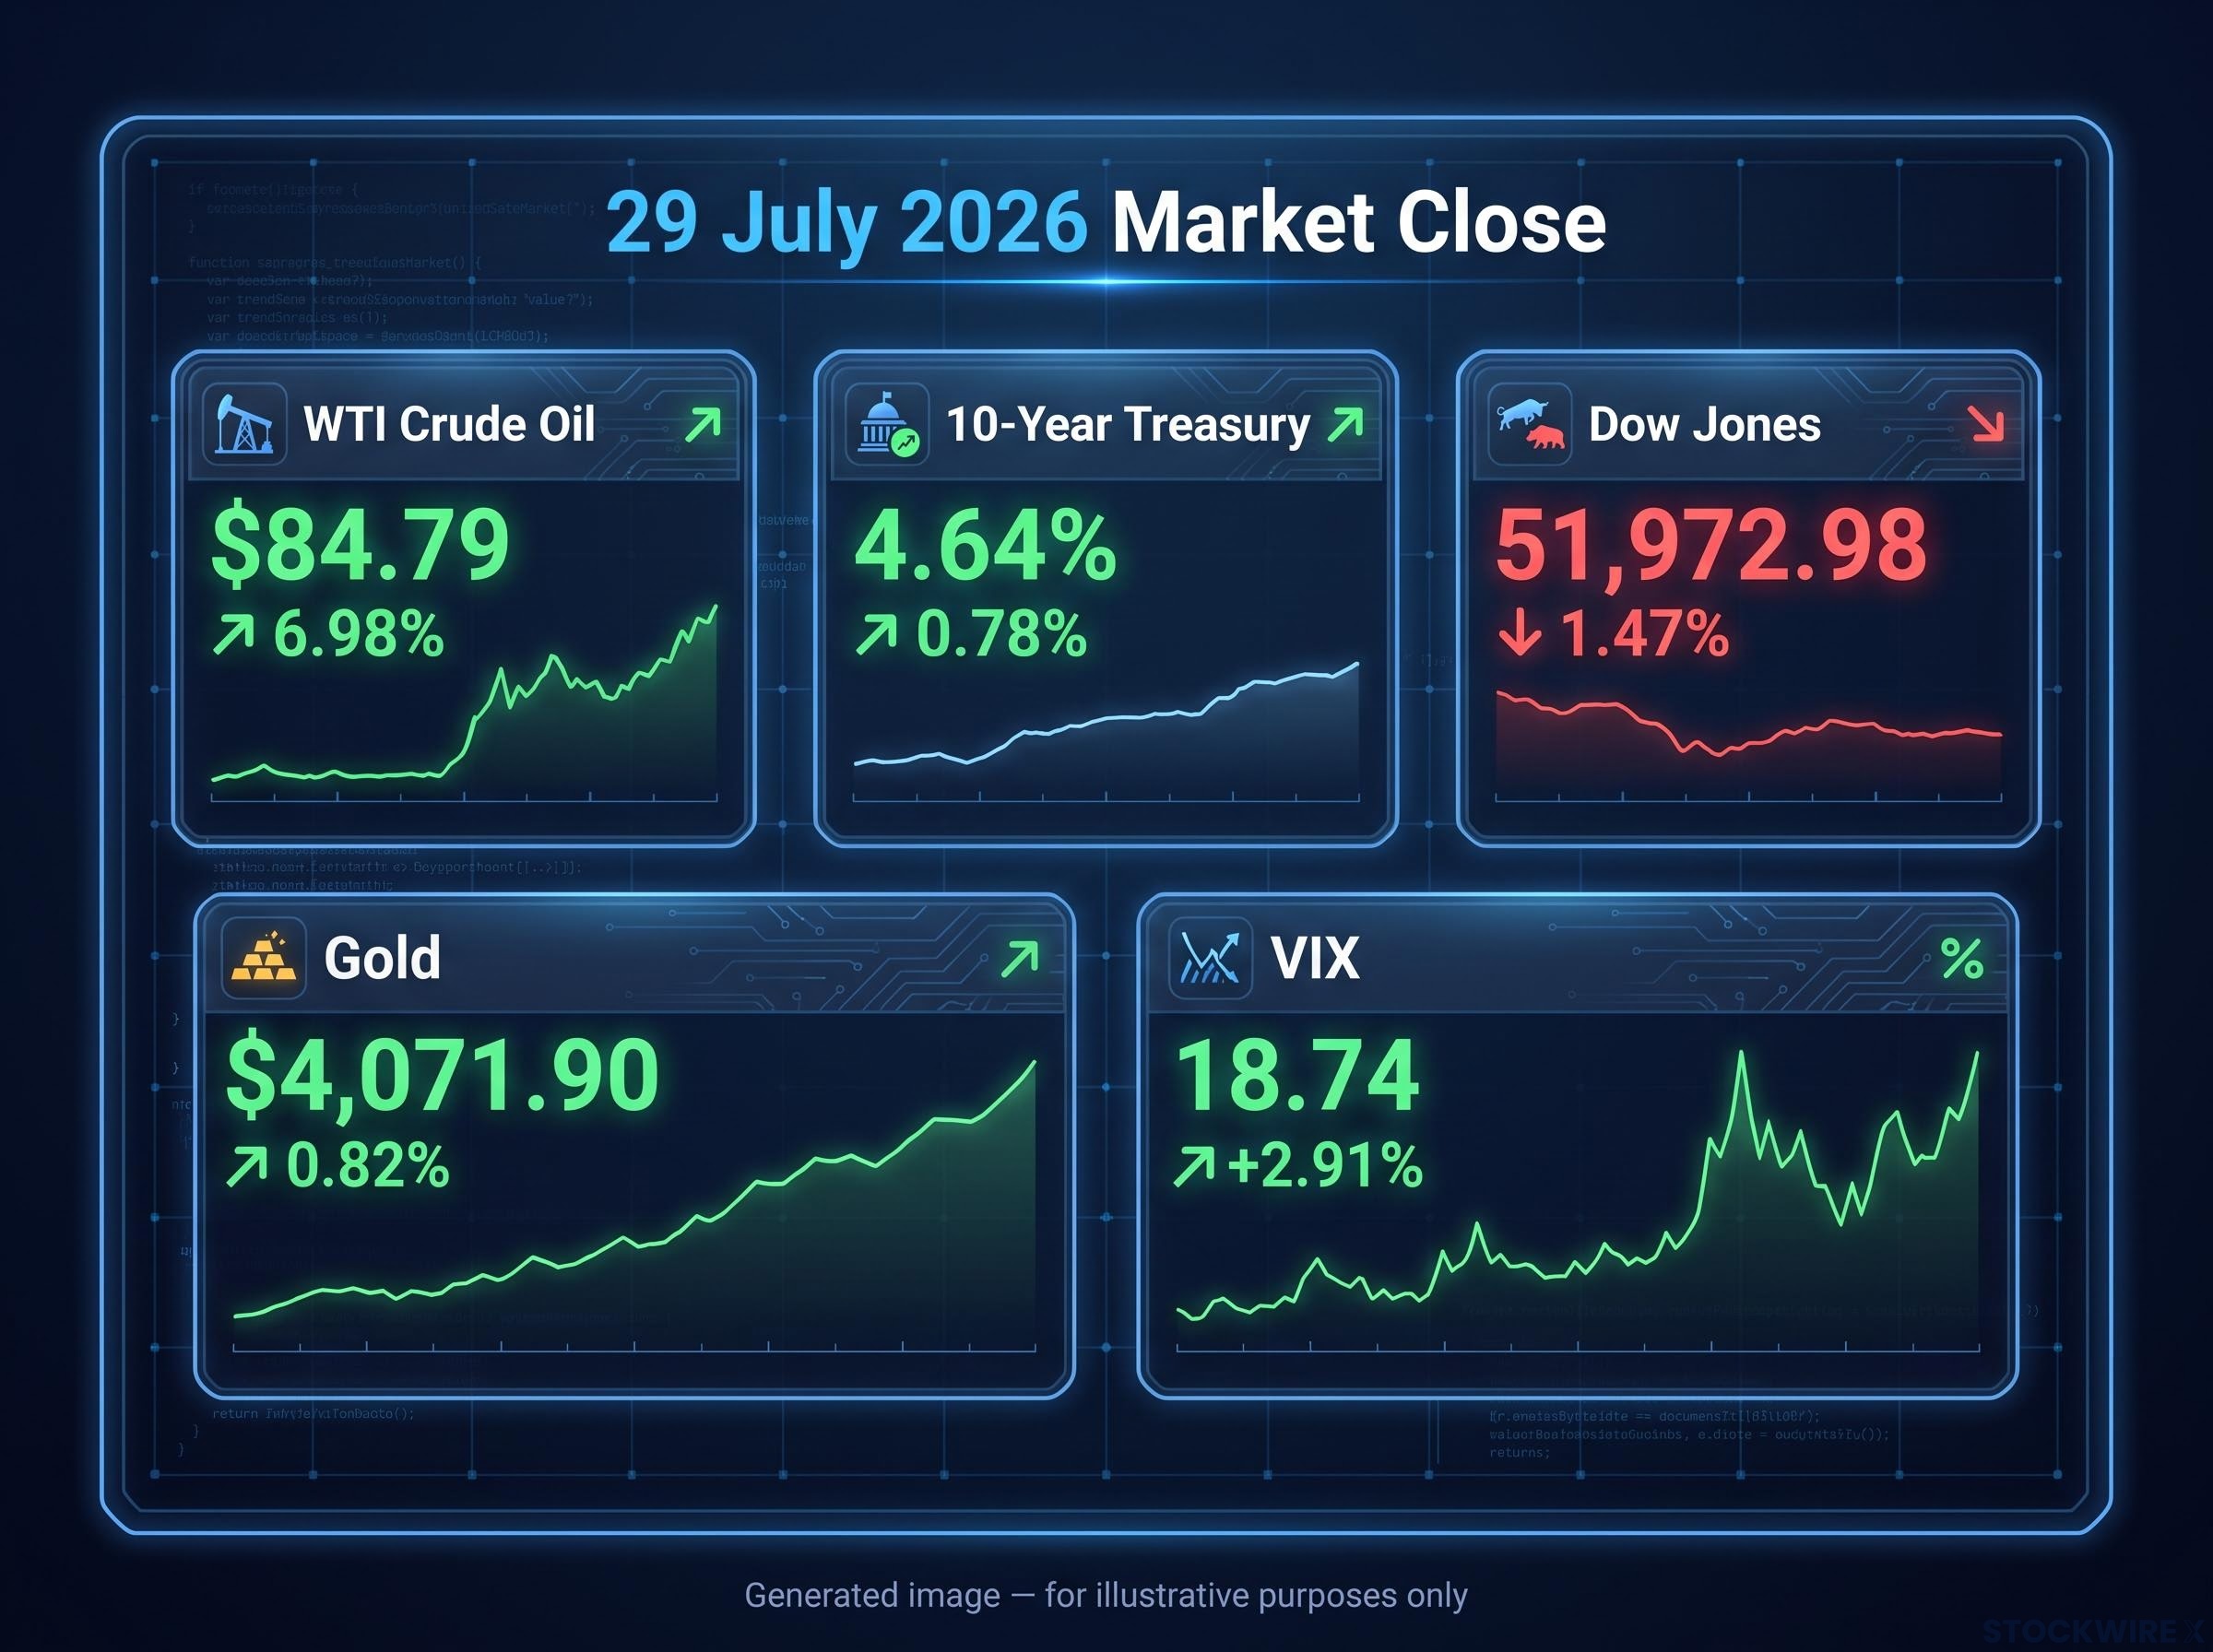
The individual data points are useful. The pattern across them is more useful. Here is the full cross-asset picture from 29 July:
| Asset | Move (%) | Level |
|---|---|---|
| Gold Futures | +0.82% | $4,071.90 |
| VIX | +2.91% | 18.74 |
| U.S. Dollar Index | -0.30% | 100.962 |
| 10-Year Treasury Yield | +0.78% | 4.64% |
| 30-Year Treasury Yield | +0.90% | ~5.14% |
Equities lower, yields higher, gold higher, VIX higher, dollar slightly lower. That is a geopolitical-inflation-shock signature. The mild dollar decline, perhaps counterintuitive in a risk-off session, makes sense when the inflation shock is energy-driven and geopolitical in origin rather than domestic-demand-driven; competing haven demand and capital-flow adjustments can produce a modest dollar dip even as fear rises.
A VIX at 18.74 is not panic. But it is no longer complacency. Combined with gold above $4,000 (Investing.com), the signal is that institutional money has shifted to hedging mode and is not yet convinced the geopolitical situation stabilises quickly.
For investors evaluating whether to reduce risk or add hedges, these two readings together, the VIX and gold, provide a cleaner signal of professional sentiment than any single equity index move. Today’s readings suggest the risk premium is being treated as durable, not transient.
For investors evaluating whether to reduce risk or add hedges after today’s cross-asset shock, our dedicated guide to geopolitical investing strategy covers gold allocation targets, bond duration awareness, and the rebalancing discipline that institutional managers apply when VIX and gold move together in a geopolitical-inflation event.
What changes from here, and what the next catalyst actually is
Two variables will determine whether today marks the opening of a sustained risk-off episode or a spike that fades with the next diplomatic overture:
- Hormuz diplomatic signals: Any renewed peace engagement could produce a reversal as sharp as today’s spike, just as the June framework drove oil lower and equities higher. The cycle has been consistent since mid-year, and it cuts both ways.
- The inflation data chain: If oil remains above $84 into the next Consumer Price Index (CPI) release, the compounding effect of elevated energy prices and a Fed unable to cut will define market conditions for the following quarter.
- Fed communications: Watch for any language shift on the inflation impact of sustained energy prices in upcoming Fed statements or speeches.
- Escalation or de-escalation signals: Renewed military action or a fresh diplomatic channel will move oil and yields before any economic data does.
The 10-year yield at 4.64% and the 30-year at approximately 5.14% are the levels markets will watch for further movement if the oil shock persists through the next inflation print.
The question investors should be tracking is whether the collapsed interim deal marks a structural shift toward sustained conflict or another phase in the alternating cycle. The answer determines whether today’s risk-premium repricing is a trade or a regime change, and positioning for that distinction now, before confirmation arrives, is what separates preparation from reaction.
This article is for informational purposes only and should not be considered financial advice. Investors should conduct their own research and consult with financial professionals before making investment decisions. Forward-looking statements regarding oil prices, inflation, and Federal Reserve policy are speculative and subject to change based on geopolitical developments and market conditions.