American factories reported their weakest month of new orders in half a year, and the market barely flinched. The reason sits beneath the headline number.
The U.S. Census Bureau released its advance report on durable goods orders for June 2026 on 27 July 2026, and the topline figure landed well below expectations. New orders rose just 0.3%, missing consensus forecasts that ranged from 1.6% to 2.5%. On the surface, that looks like a stumble.
It was not. Strip away the noise of volatile aircraft and defence contracts, and the data tells a different story: one of steady corporate investment, persistent technology spending, and a manufacturing base that is expanding, not contracting. Here is how to read the numbers that actually matter in this release, where corporate capital is flowing, and why the headline figure is the worst way to gauge what is happening on factory floors.
Looking past the headline miss to core business investment
The 0.3% increase brought total new orders to roughly $334.8 billion, a recovery from May’s revised 4.0% decline but far short of what forecasters expected. The miss was almost entirely a transportation story.
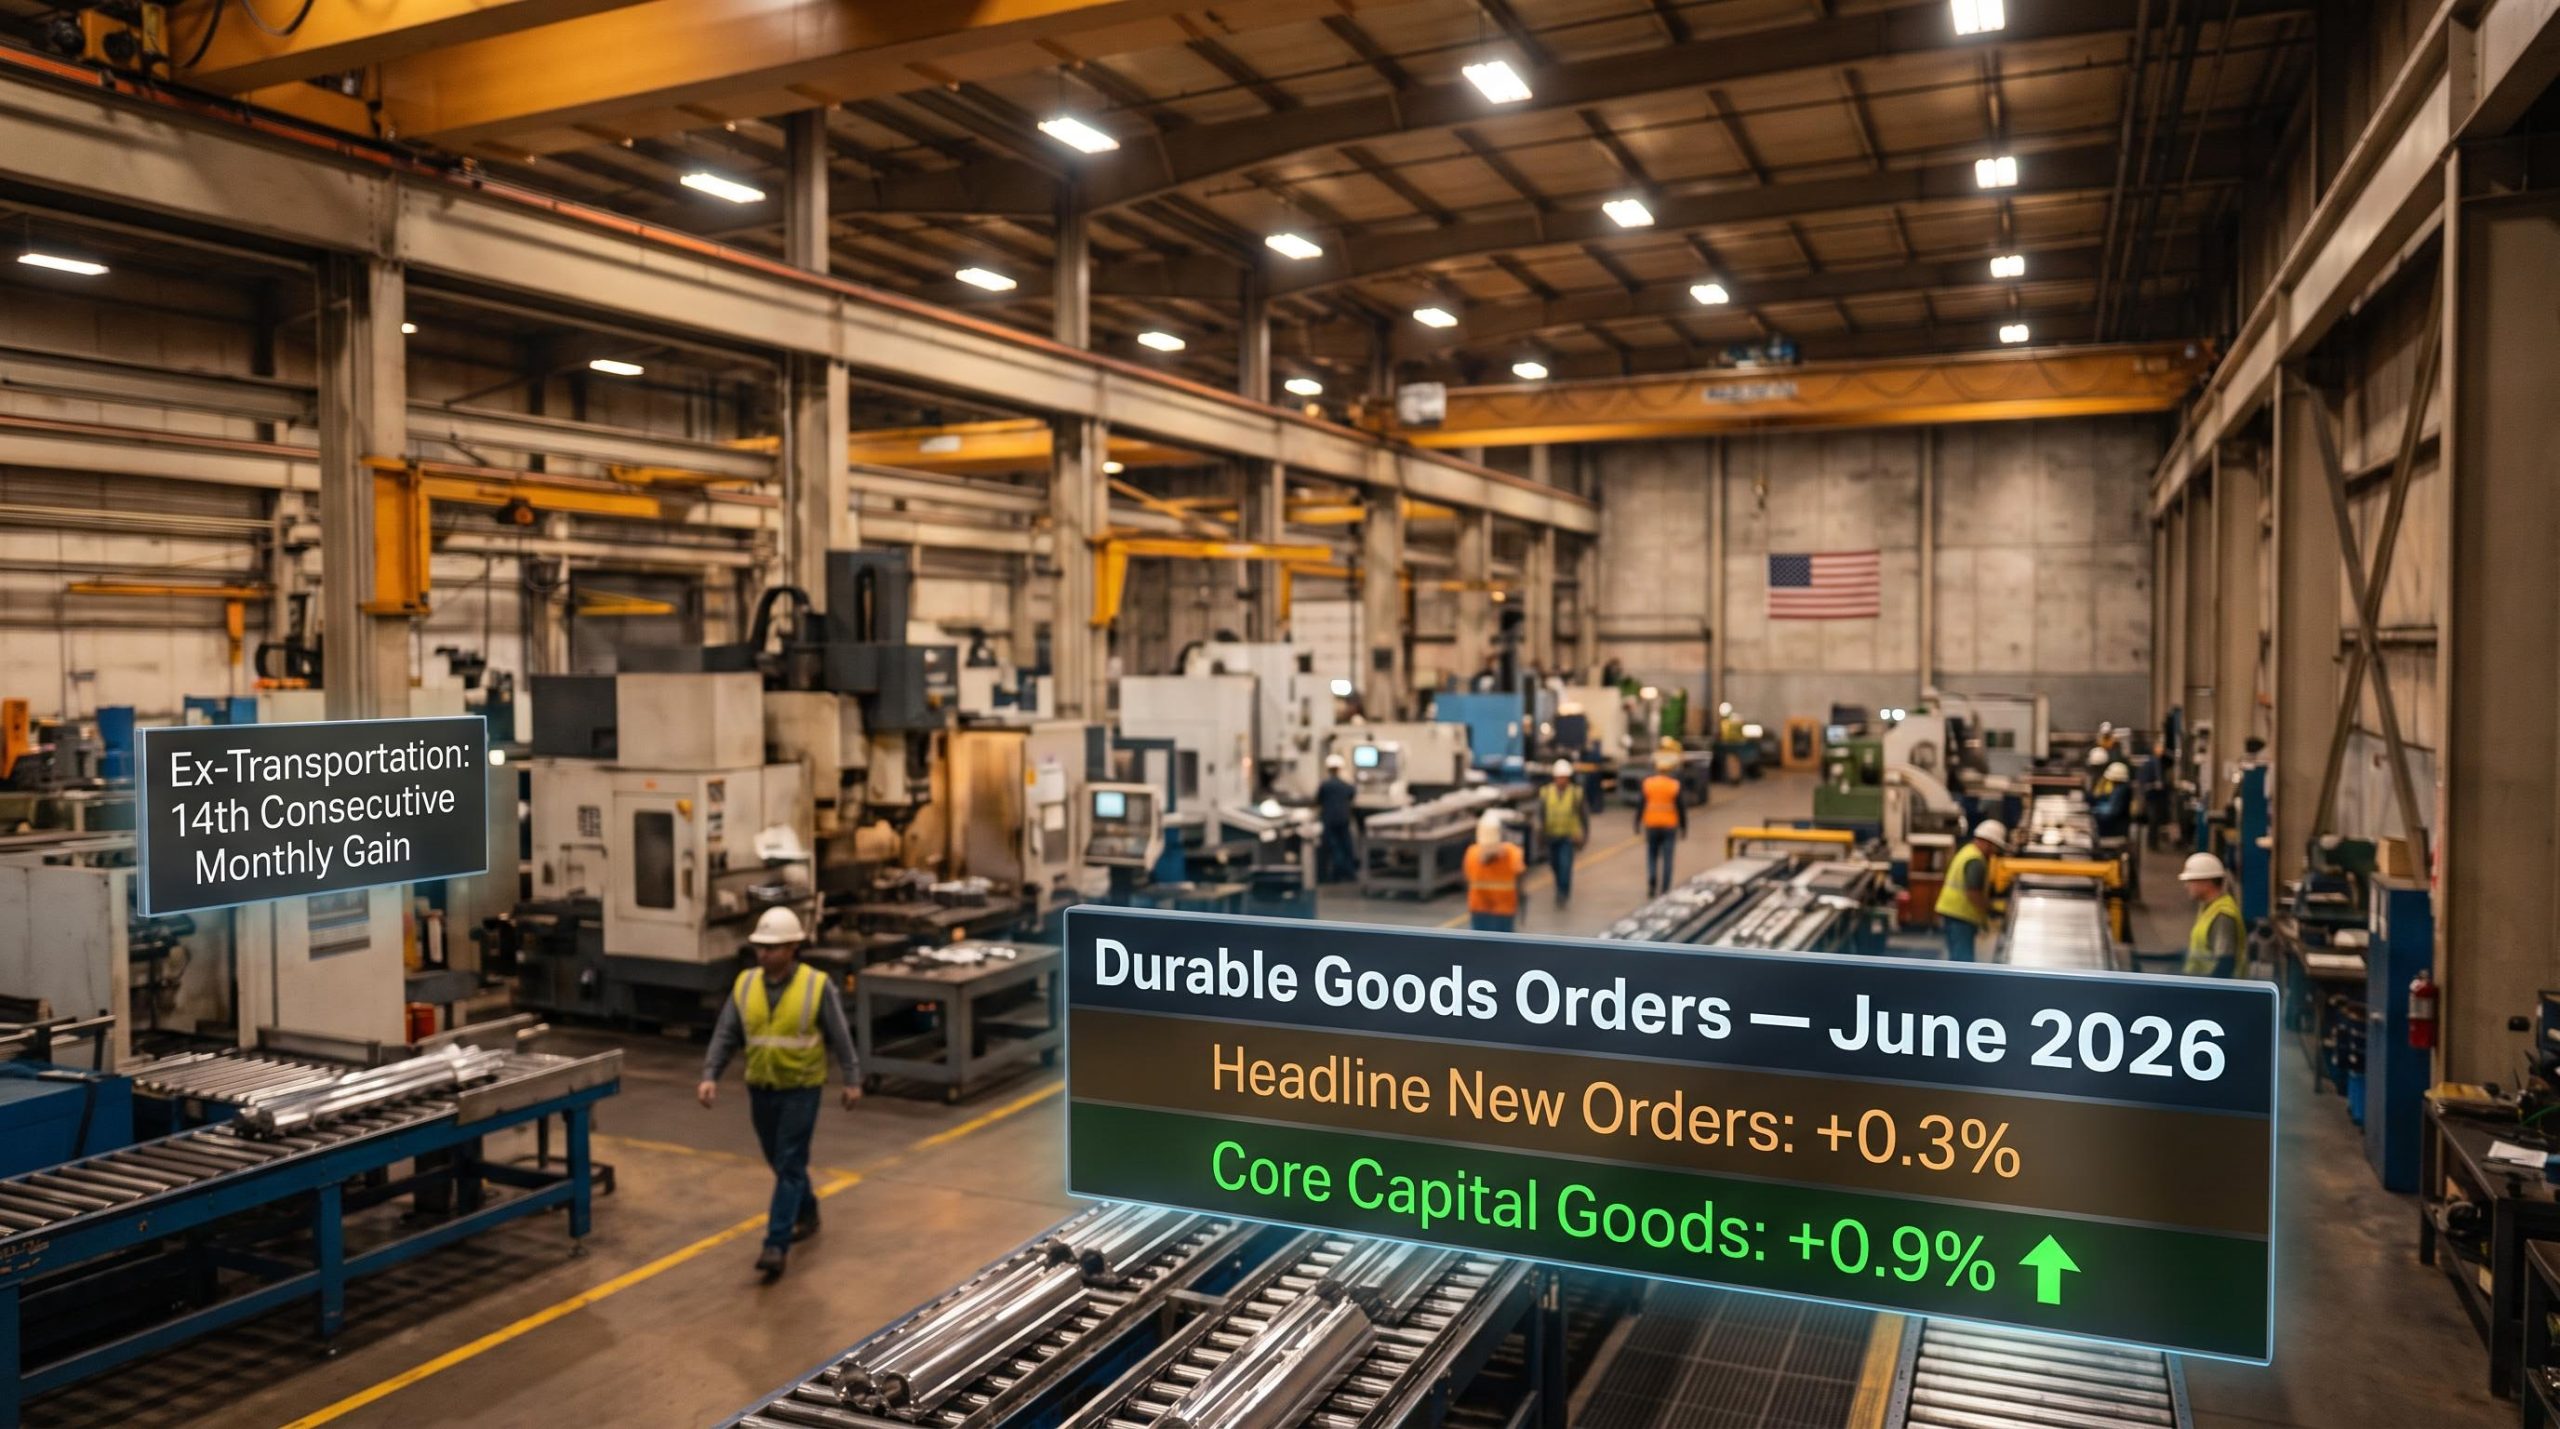
Orders excluding transportation rose 0.6% in June. That marked the 14th consecutive monthly increase in this category, a streak that stretches back to early 2025. When a metric posts gains for more than a year straight, a single soft headline number does not override the trend.
The strongest signal came from core capital goods, which are nondefense capital goods excluding aircraft. This is the figure economists watch most closely for corporate investment intentions. Core capital goods orders rose 0.9% in June, following a 1.9% increase in May. Back-to-back gains of that magnitude tell you that companies are still committing capital to equipment, technology, and expansion. Corporate confidence in the near-term economic outlook, based on where firms are actually putting money, remains intact.
Capital goods orders function as a leading indicator, typically preceding payroll growth by several quarters, which means the back-to-back gains recorded in May and June 2026 carry more forward-looking weight than any concurrent employment or output figure released alongside them.
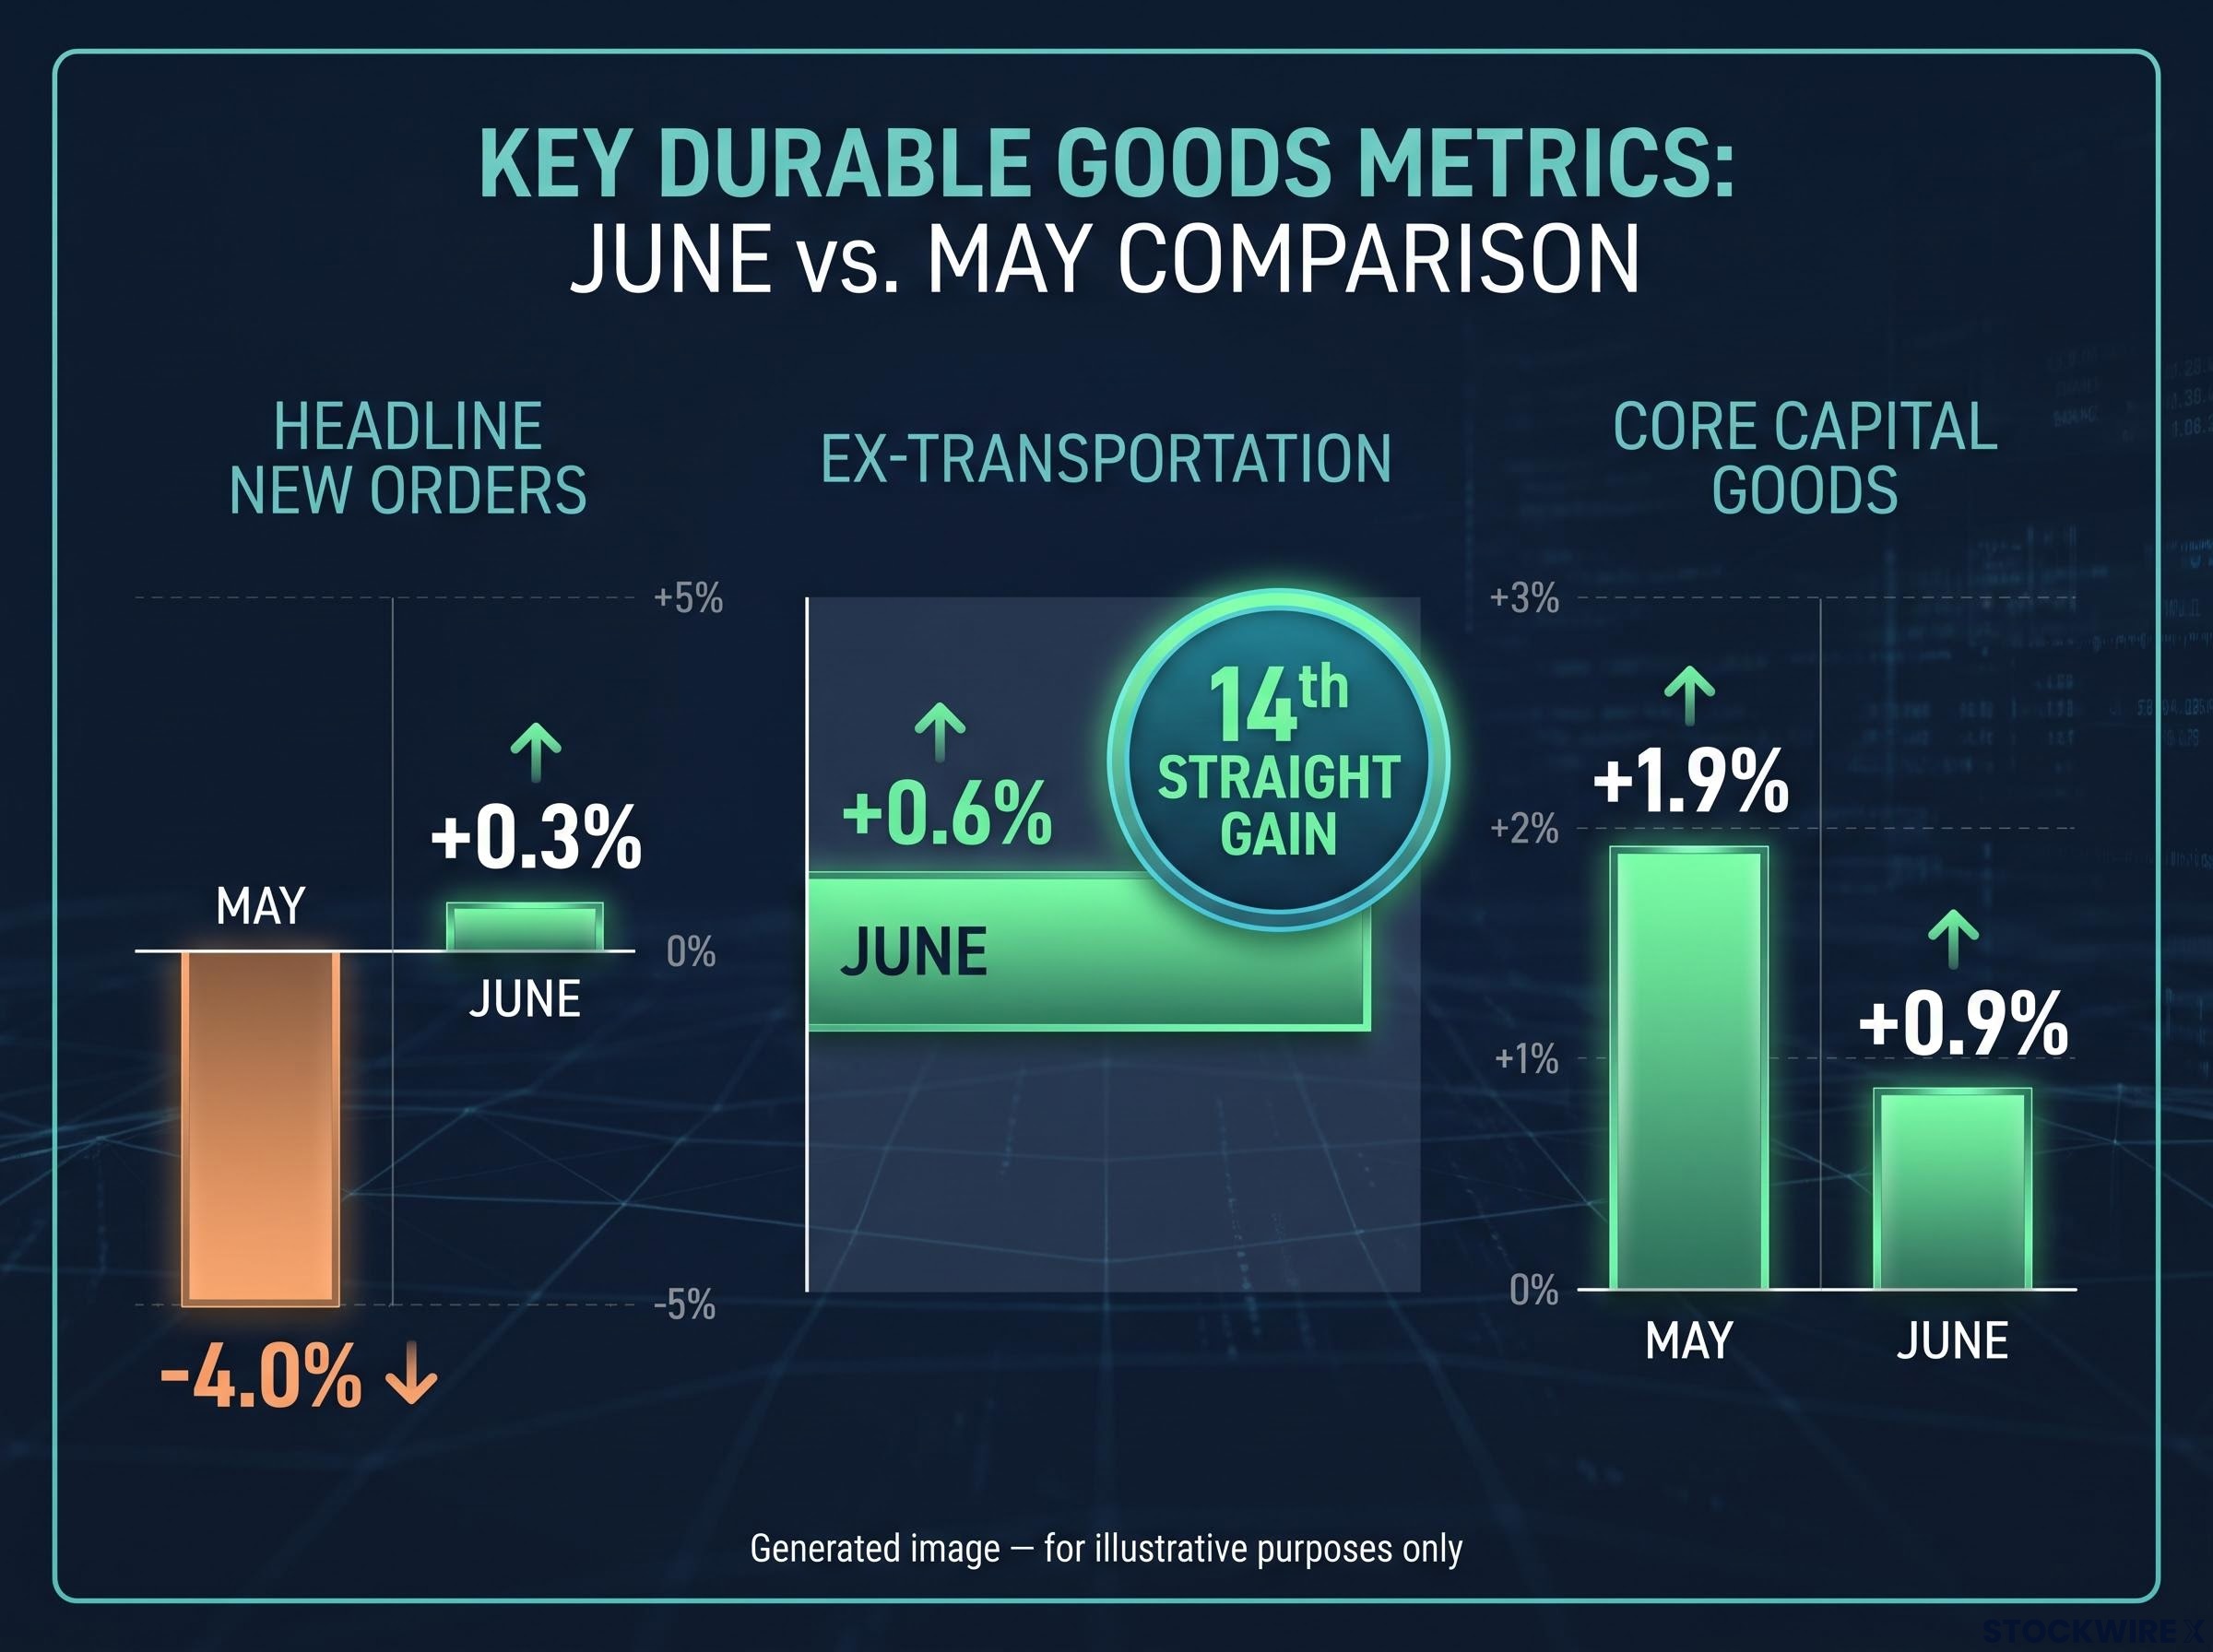
| Measure | June MoM | May MoM |
|---|---|---|
| Headline new orders | +0.3% | -4.0% |
| Ex-transportation | +0.6% | 14th straight gain |
| Core capital goods | +0.9% | +1.9% |
When big ASX news breaks, our subscribers know first
Why this metric dictates the industrial narrative
Durable goods are manufactured products designed to last at least three years: machinery, computers, vehicles, appliances, aircraft. The Census Bureau tracks both new orders and shipments each month, and the distinction matters.
- New orders are forward-looking. They represent contracts placed by buyers for future delivery, making them a leading indicator of factory demand and production activity in the months ahead.
- Shipments reflect current production. They measure what factories are actually delivering right now, not what they have been asked to build next.
June shipments excluding transportation rose 1.0%, building on a 0.9% increase in May. That tells you factories are both receiving new demand and fulfilling existing orders at an increasing rate.
The Census Bureau M3 survey definitions draw a precise distinction between new orders, which capture contracts placed for future delivery, and shipments, which measure goods actually delivered, a methodological boundary that determines how each figure functions as an economic signal.
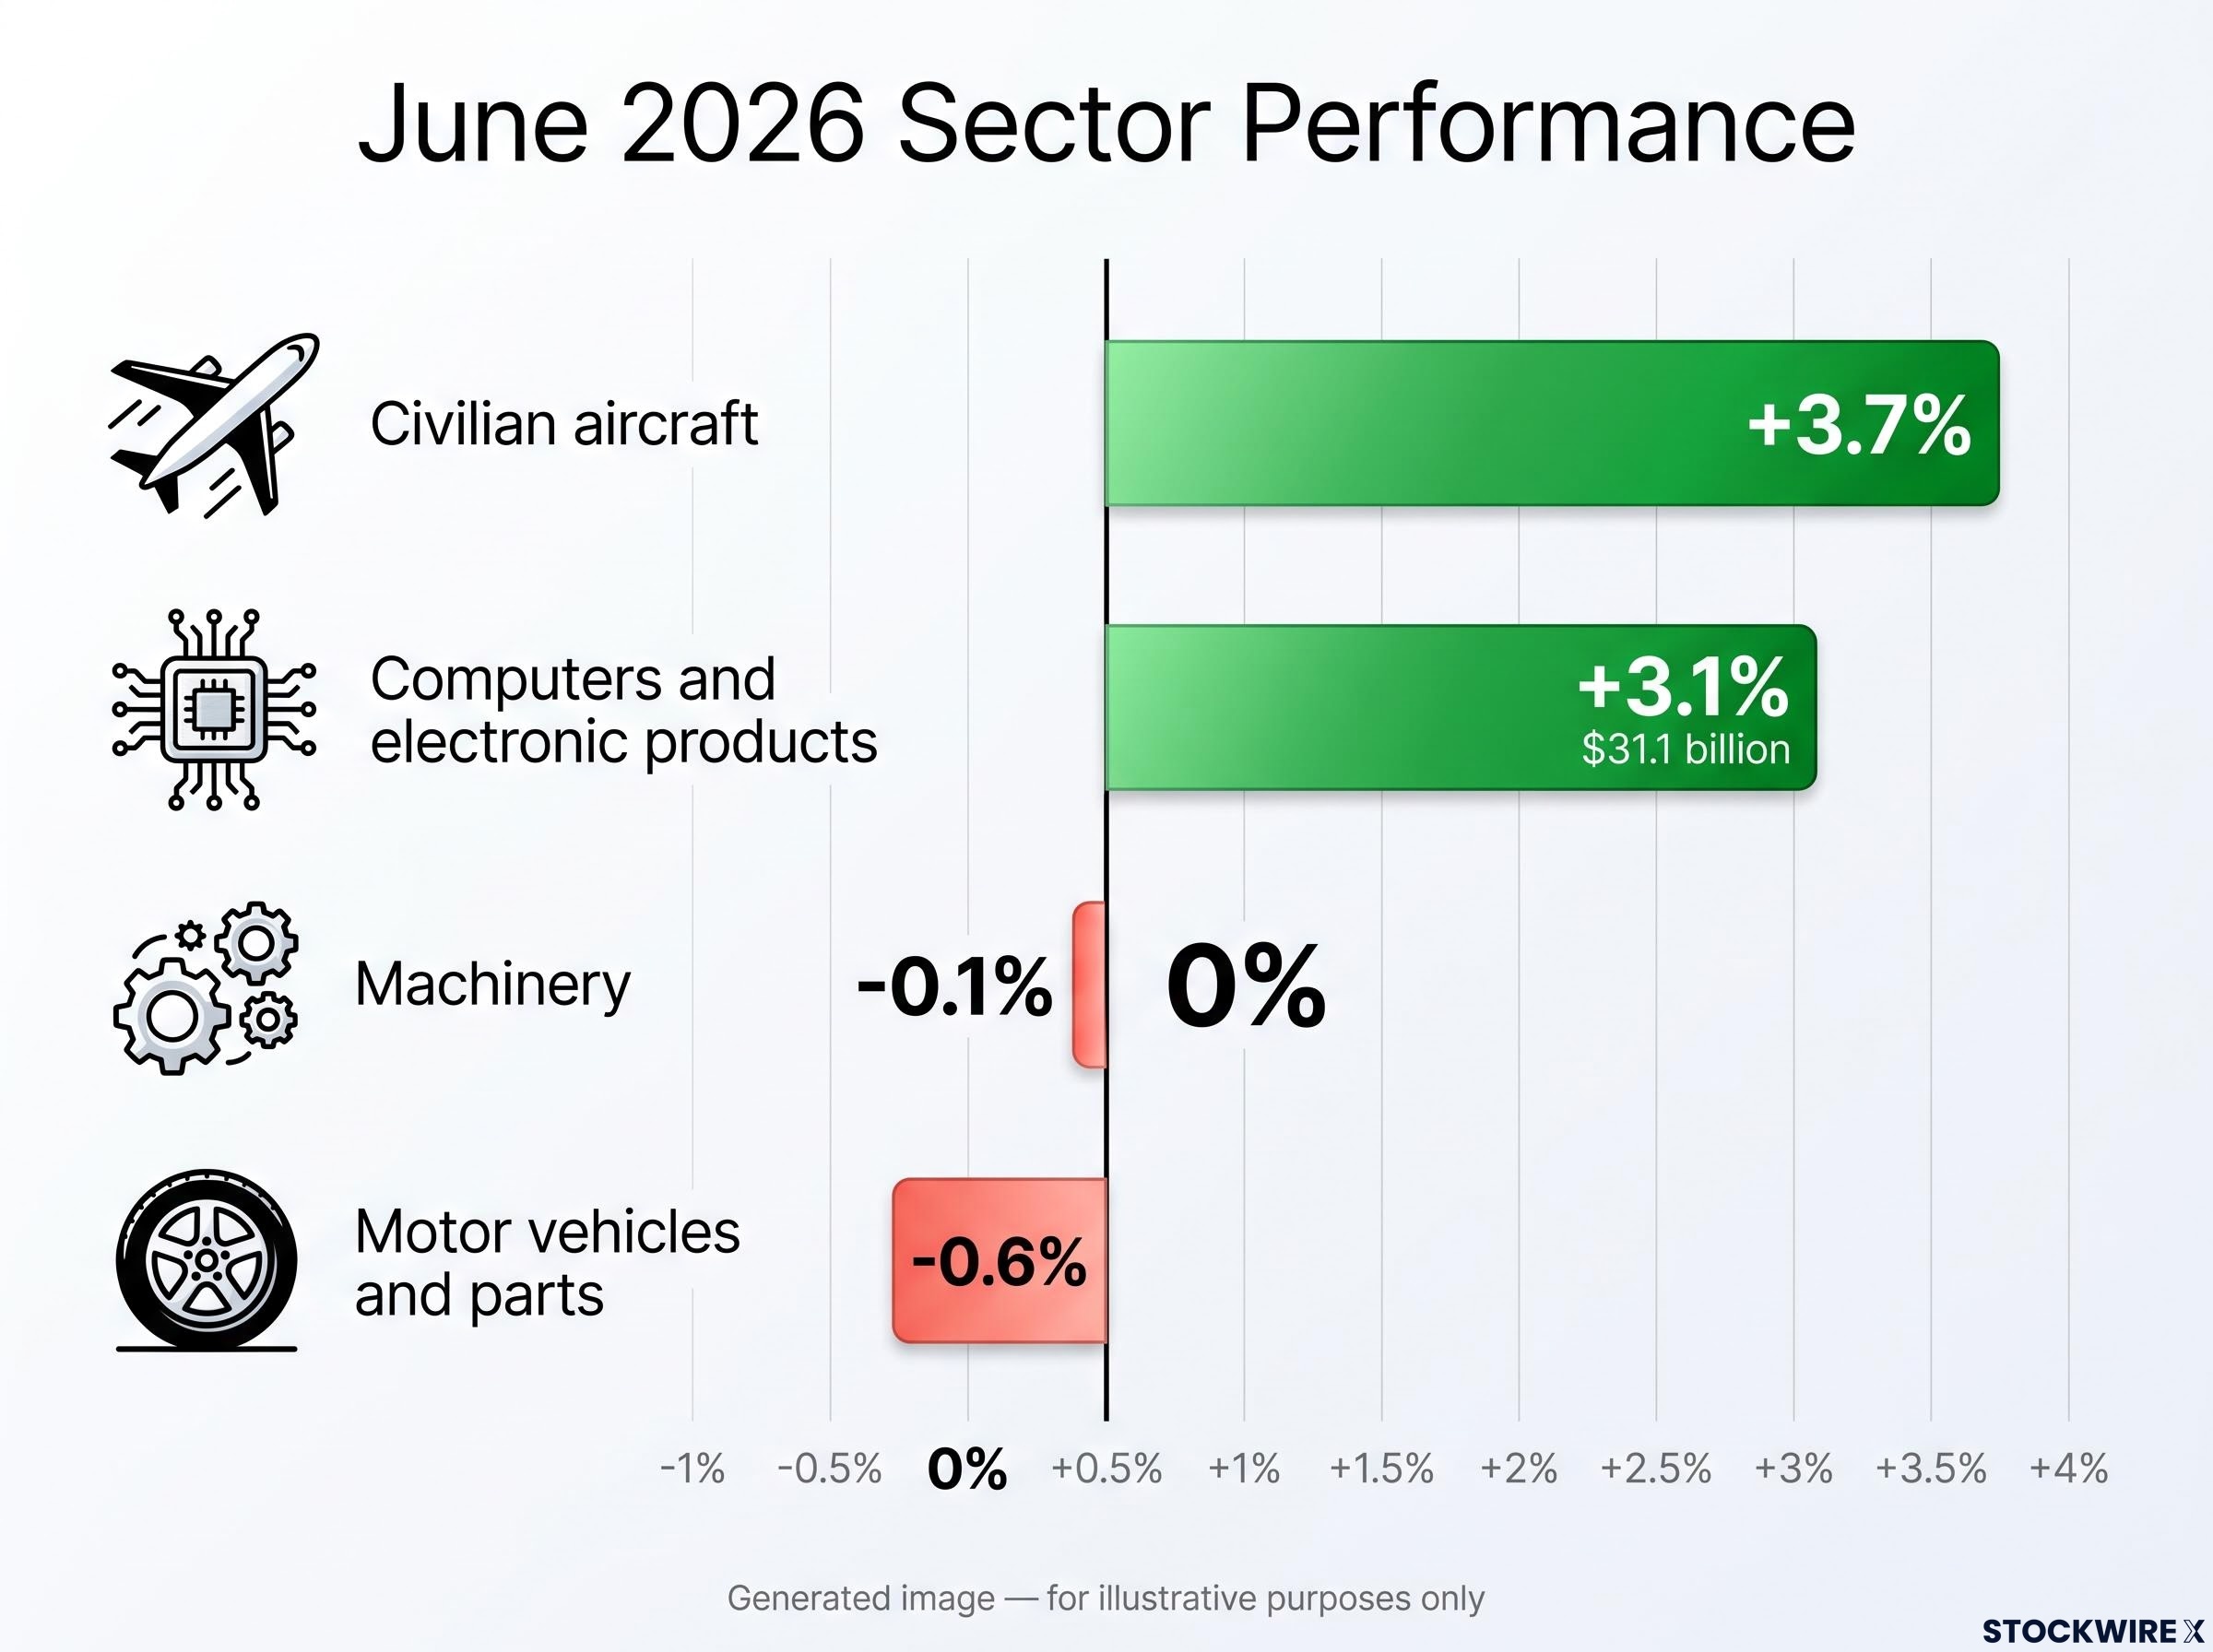
The reason economists routinely strip out defence and civilian aircraft is simple: those categories swing wildly from month to month. Civilian aircraft orders rose 3.7% in June, plunged 51.1% in May, and surged 167.4% in April. A single airline placing or deferring a fleet order can move the entire headline number. Understanding how to filter out those massive, irregular aircraft purchases allows you to read the true baseline of industrial demand without being misled by one-off corporate transactions.
Technology leads the charge while machinery stalls
The clearest winner in the June data was the technology sector. Orders for computers and electronic products jumped 3.1% to $31.1 billion, rising in nine of the last ten months. That persistence matters more than any single month’s figure. It tells you that corporate spending is aggressively prioritising digitisation and efficiency upgrades, a trend worth factoring into longer-term sector positioning.
AI infrastructure spending flowed directly into the national accounts in Q1 2026, with information processing equipment growing at 43.4% annualised, a figure that aligns with the persistent strength in computers and electronic products visible in monthly durable goods releases throughout the first half of the year.
Broader gains across primary metals and electrical equipment supported the overall ex-transportation figure, confirming that June’s strength was not concentrated in a single industry.
Pockets of industrial softness
Not everything moved higher. Machinery orders fell 0.1% in June, snapping a run of growth that had lasted 16 consecutive months without a decline. That is worth noting, but one data point after more than a year of consecutive gains does not constitute a trend reversal. It bears watching in subsequent reports.
Motor vehicles and parts fell 0.6%, the category’s first monthly decline since November 2025, after a 1.1% increase in May. Both of these weak spots remain isolated against the backdrop of broad-based gains elsewhere.
The persistent distortion of nominal data
Every figure in this report carries an asterisk that most commentary ignores. The Census Bureau reports durable goods orders in current dollars, completely unadjusted for inflation. When input prices and component costs remain above pre-2021 norms, a rising order value does not automatically mean factories are producing more. It can simply mean they are charging more.
Total durable goods orders were up approximately 7.4% year-over-year from July 2025 through June 2026, according to FactSet data as of 28 July 2026. That looks like strong growth. But you need to discount that figure by the underlying rate of inflation to understand whether factories are actually moving more physical product or simply recording higher prices for the same output.
The difference between dollar-value growth and physical-volume growth is the single most common misread in government manufacturing data. Cross-checking nominal orders against inflation-adjusted industrial production gives you a far more honest picture of factory activity.
The distinction between nominal versus inflation-adjusted growth matters across virtually all government economic releases, not just durable goods; the same gap between headline CPI and core PCE that complicates manufacturing data interpretation also shapes how analysts read consumer spending and income figures in the same reporting cycle.
This article is for informational purposes only and should not be considered financial advice. Investors should conduct their own research and consult with financial professionals before making investment decisions.
Setting expectations for the third quarter
The June durable goods data paints a stable but uneven picture as the economy moves into the second half of 2026. The headline miss matters less than the 14 straight months of ex-transportation gains, which provide a meaningful buffer against immediate recessionary concerns in manufacturing.
Fourteen consecutive months of ex-transportation gains represent precisely the kind of sustained leading indicator signal that historically informs cyclical sector positioning, with institutional allocators typically waiting for multi-month confirmation in capital goods data before adjusting industrial and technology weightings.
Two variables deserve close attention in the upcoming July report. First, whether the slight machinery contraction extends into a second month or reverts to the category’s established growth trend. Second, whether core capital goods can maintain the investment momentum that has characterised most of the past year. Those two data points will tell you more about the industrial trajectory than any headline number.