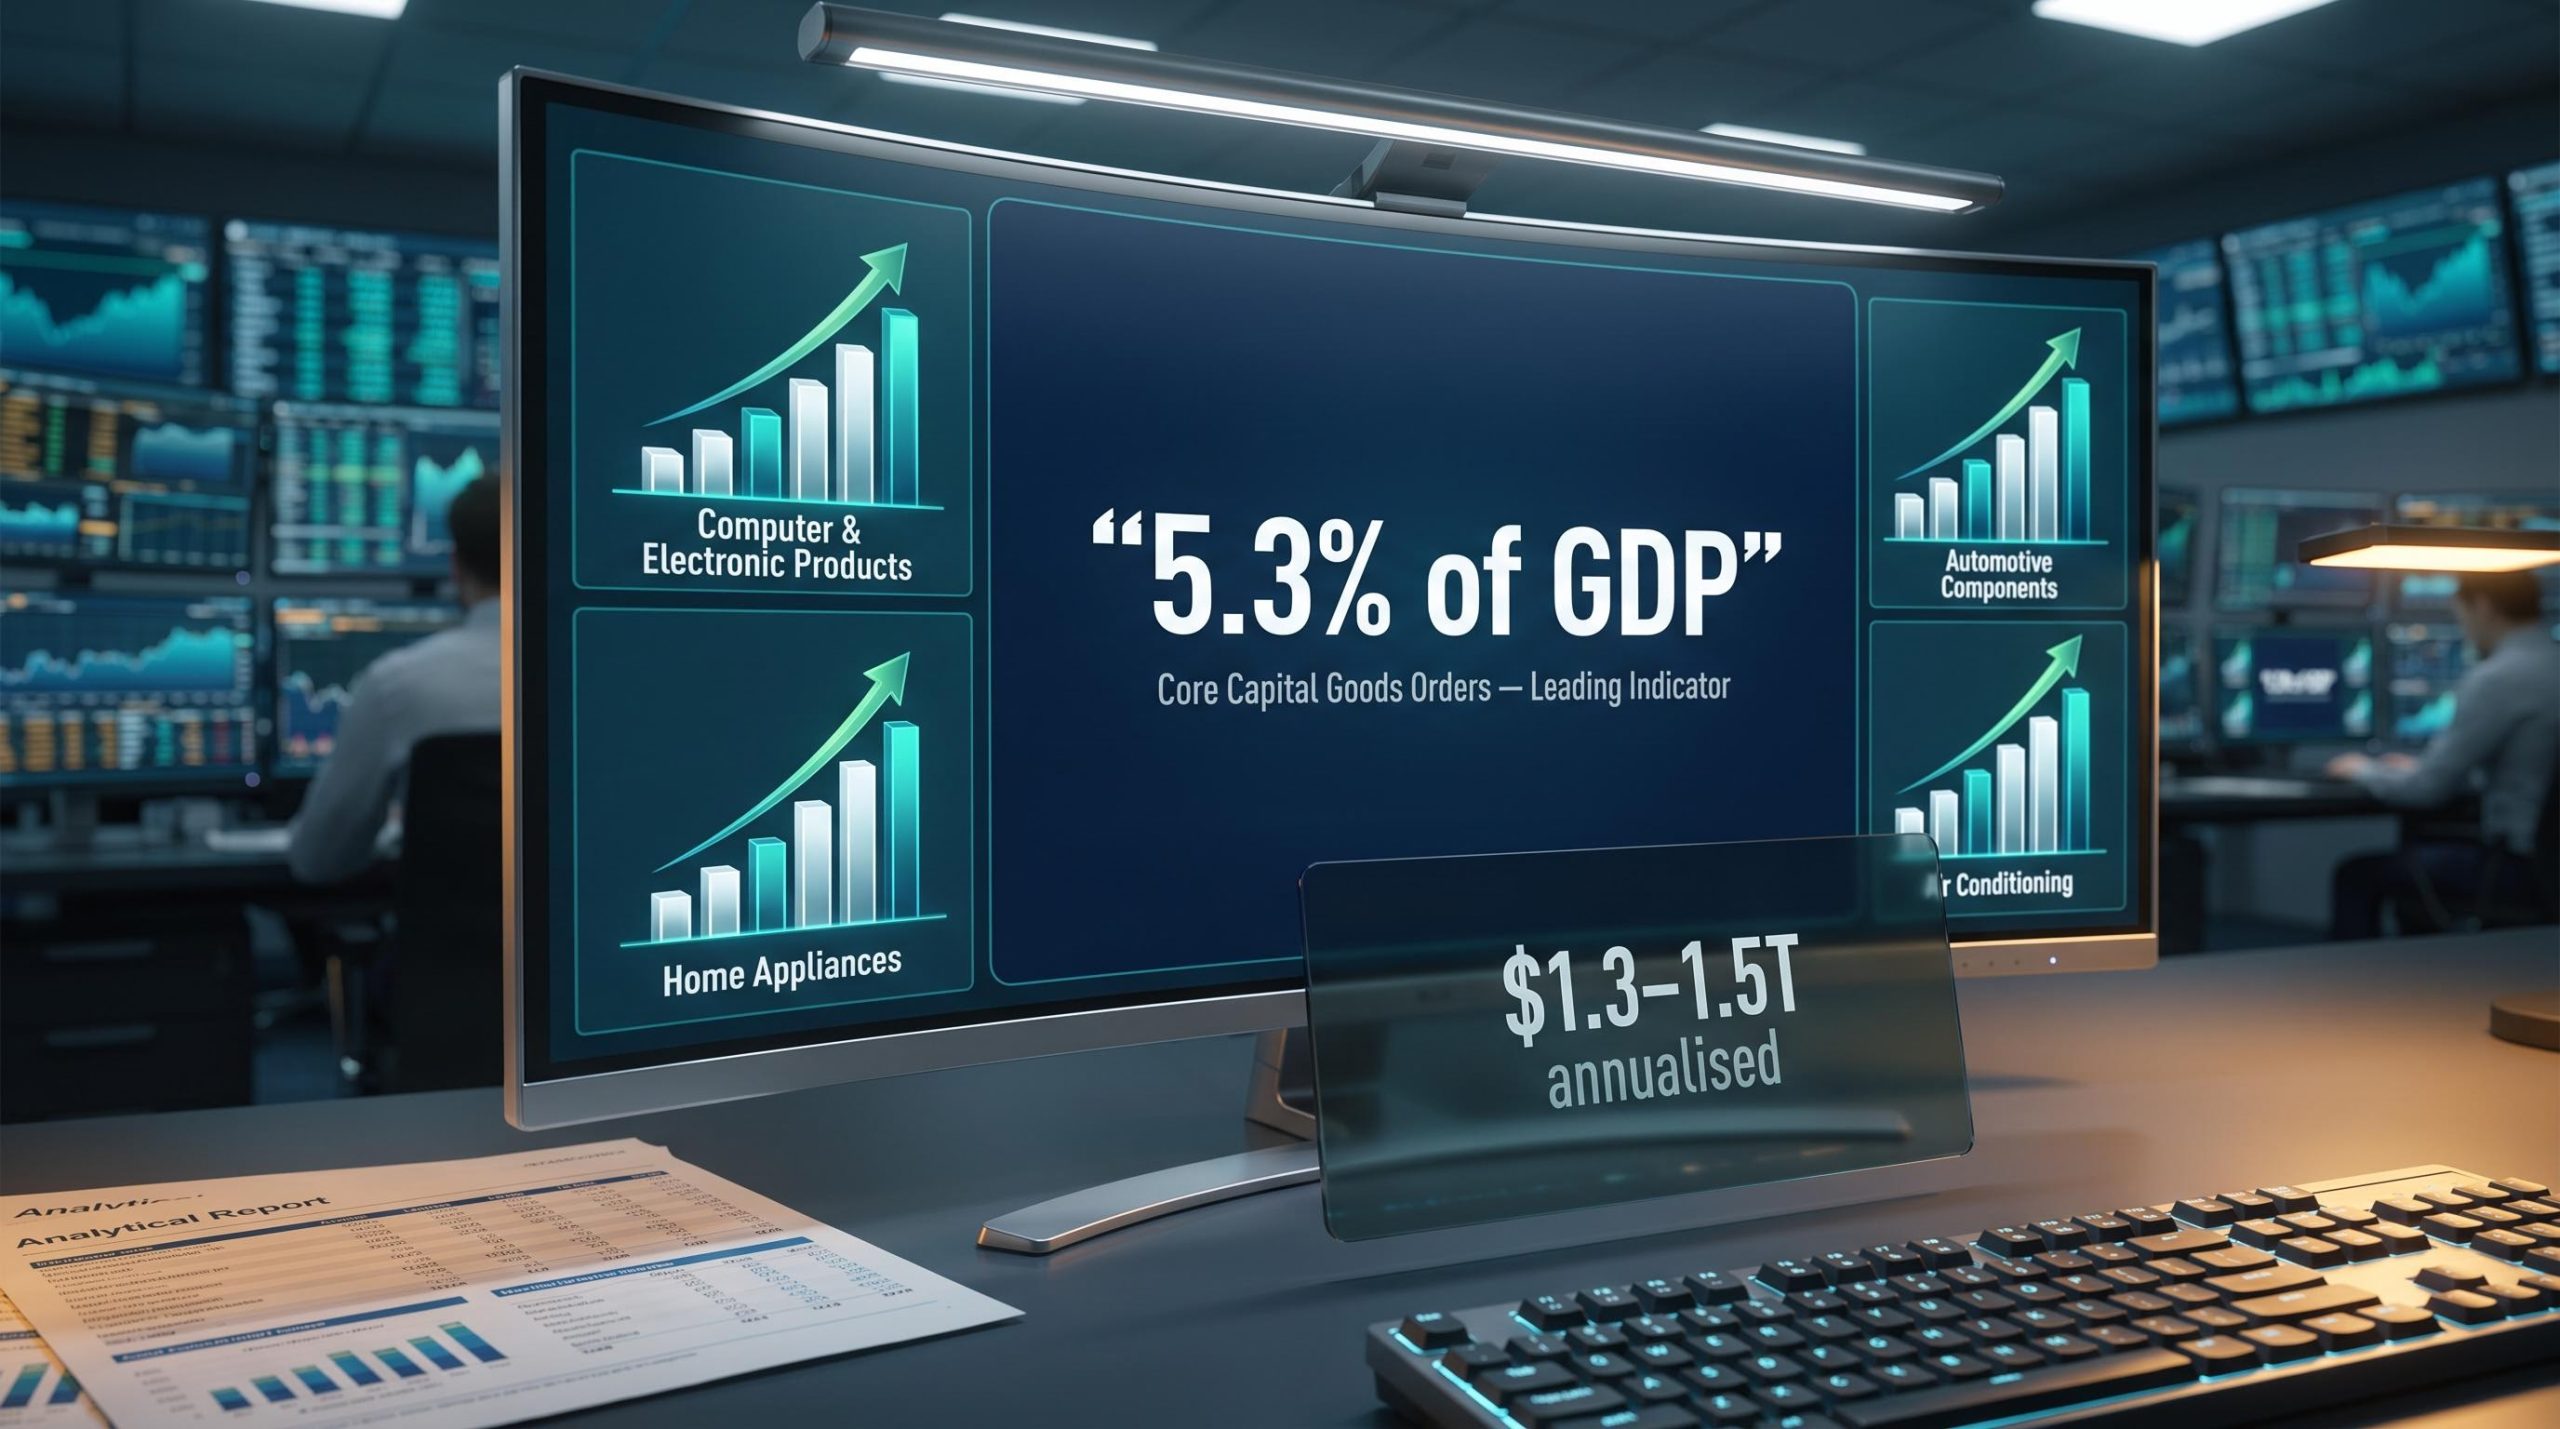
Equipment investment accounts for roughly 5.3% of US GDP. Consumer spending accounts for nearly 70%. Yet when professional economists scan the data for signs of a coming recession, they watch the smaller number more closely than the larger one.
That gap between size and signal power is the tension worth understanding. Through the first half of 2026, media coverage has centred on AI-driven technology spending as the headline story of US economic strength. That framing is not wrong, but it may be obscuring a broader, more structurally informative signal: the pattern of capital goods demand across multiple industries, not just the ones generating the most attention.
After this piece, you will understand what equipment investment actually measures, why economists treat it as an early warning system, how monthly orders data connects mechanically to GDP outcomes weeks before they appear in official accounts, and what the current data configuration is telling you about recession risk. The goal is to give you the same analytical framework professionals use, so you can read economic conditions for yourself rather than reacting to headline GDP figures after the fact.
A small number that carries outsized economic weight
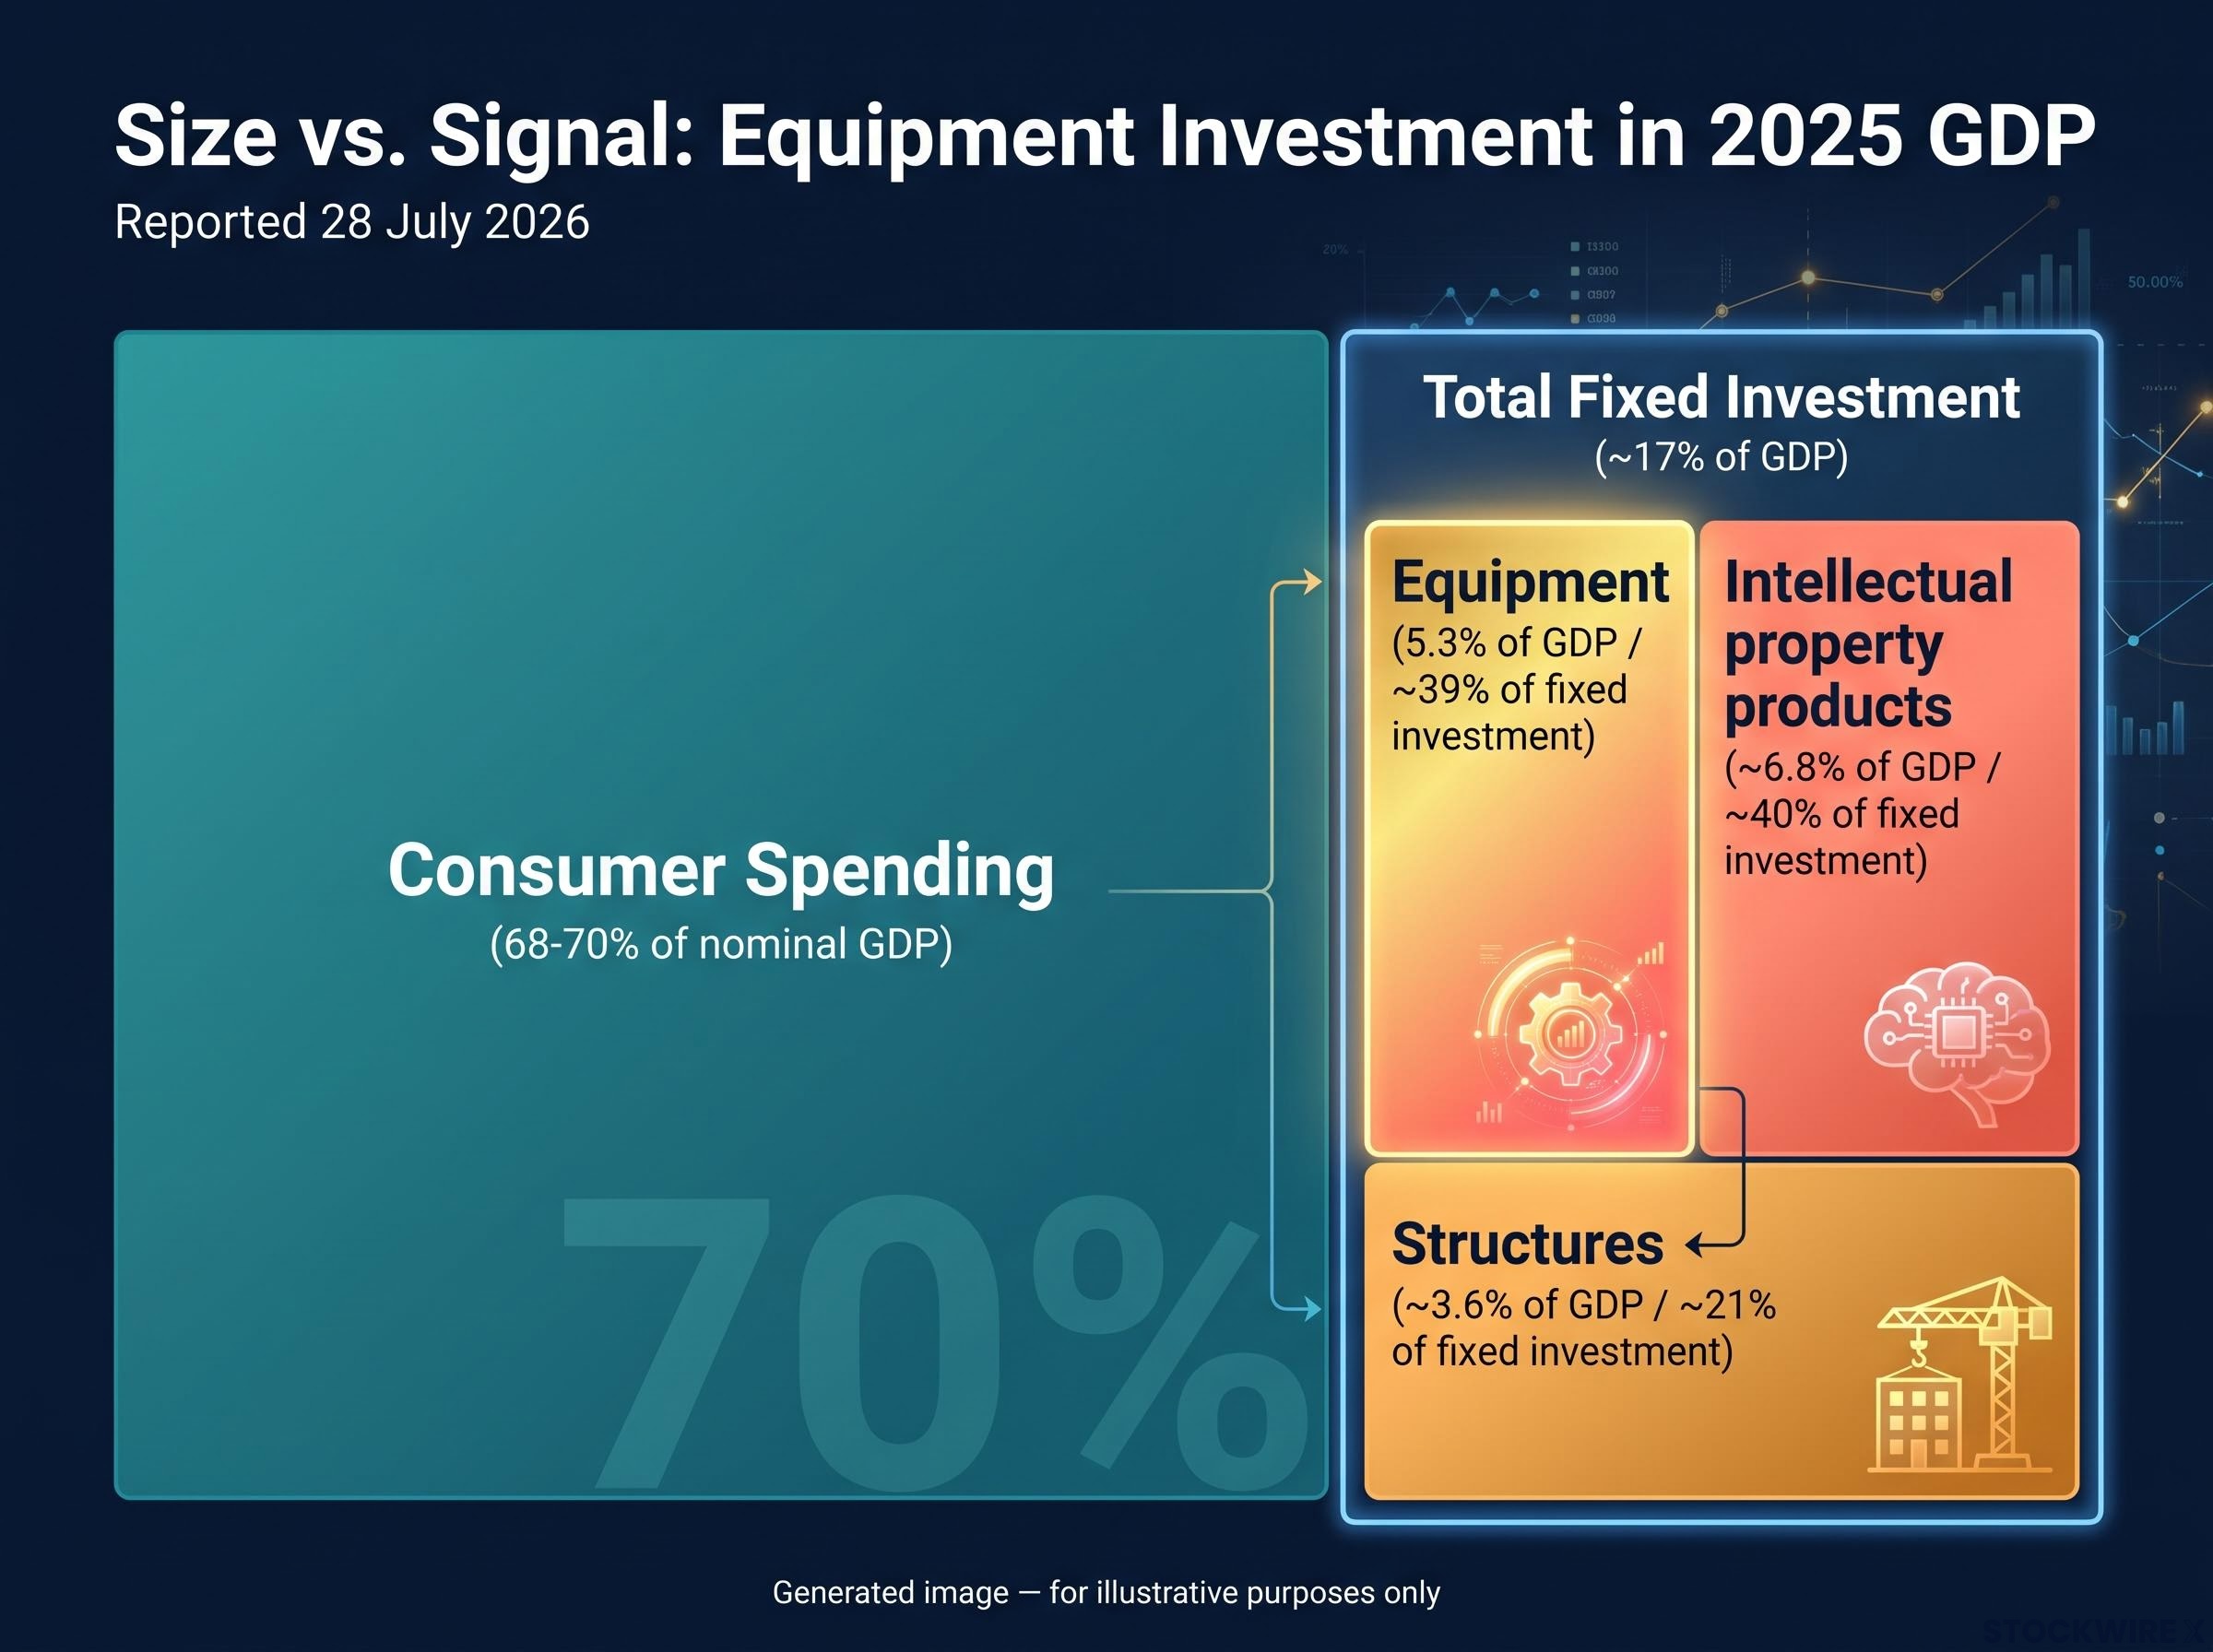
Equipment investment represented approximately 5.3% of total US nominal GDP in 2025, according to Bureau of Economic Analysis (BEA) data reported as of 28 July 2026. In real chained-dollar terms, that translates to roughly $1.3-$1.5 trillion annualised.
To put the size in context, equipment sits within total fixed investment, which accounts for approximately 17% of GDP. Within that fixed investment total, equipment holds about 39% of the share on a nominal basis, structures account for roughly 21%, and intellectual property products (software and research and development) take approximately 40%.
| Component | Approximate GDP share | Approximate share of total fixed investment |
|---|---|---|
| Equipment | 5.3% | ~39% |
| Structures | ~3.6% | ~21% |
| Intellectual property products | ~6.8% | ~40% |
Consumer spending, by comparison, comprises approximately 68-70% of nominal GDP. The scale difference is enormous. But the GDP share tells you how big a component is, not how informative it is about what the economy will do next. Conflating those two measurements is one of the most common analytical errors in economic commentary, and it is why so much recession analysis arrives late.
Consumer sentiment reached a record low of 48.2 in May 2026, a figure that generated significant recession commentary, yet historical analysis shows sentiment typically deteriorates alongside or after equity downturns rather than leading them, making it a lagging indicator in precisely the same way that headline GDP consumption data is.
Equipment investment accounts for just 5.3% of US GDP, yet it ranks among the most closely watched cyclical indicators in professional economic analysis. Size and signal power are different measurements entirely.
When big ASX news breaks, our subscribers know first
What counts as equipment investment, and why it behaves differently from consumption
Equipment investment covers the physical capital goods that businesses purchase and use repeatedly in production over extended periods. The main categories include:
- Transport equipment (trucks, trailers, rail stock)
- Industrial machinery
- Construction and mining equipment
- Electrical gear
- Computers and IT hardware
- Other general-purpose capital goods
These are large, tangible assets. They are not consumed in a single production cycle the way raw materials are, and they are not intangible the way software licences are. They sit on factory floors, construction sites, and distribution centres, and they directly shape a firm’s productive capacity.
The deferability factor: why firms can cut faster than households
The characteristic that makes equipment spending behave so differently from consumption is its discretionary timing. Household spending is dominated by necessities: rent, food, utilities, transport. You cannot easily defer those purchases for six months while you wait for conditions to improve.
Equipment spending works differently. When uncertainty rises, firms can pause or cancel capital expenditure plans quickly by “sweating” existing assets, extending the working life of current machinery rather than committing to replacements or upgrades. The combination of large ticket size and flexible timing means equipment orders can drop sharply ahead of or early in recessions, and rebound early in recoveries.
That deferability is precisely what makes equipment spending an early warning signal. When businesses collectively stop ordering new capital goods, they are telling you that their expectations about future demand, their access to credit, or their confidence has deteriorated, often before those conditions show up anywhere else in the data.
How core capital goods orders translate into GDP months before the fact
The specific data series that professionals track most closely is published by the US Census Bureau as part of its monthly durable goods report, drawn from the Manufacturers’ Shipments, Inventories, and Orders (M3) survey. The series is called new orders for non-defence capital goods excluding aircraft, commonly referred to as “core capital goods orders.”
Why strip out aircraft and defence? Aircraft procurement tends to arrive in large, irregular batches tied to airline fleet decisions rather than reflecting steady underlying demand. Defence purchases are driven by government budget cycles rather than private business investment intentions. Excluding both categories allows the series to isolate the genuine signal from private-sector capital spending.
The mechanical relationship between orders and GDP runs through a four-step transmission chain:
- Firms decide to expand capacity or upgrade equipment and place orders with manufacturers
- Orders register immediately in the Census Bureau’s monthly data, providing real-time visibility
- Over subsequent months, those orders convert into shipments and physical installations at business sites
- Shipments appear as nonresidential equipment investment in the GDP accounts when the Bureau of Economic Analysis compiles quarterly figures
Because orders are logged before the spending hits GDP accounts, the data gives you a genuinely earlier read on the investment cycle. This is not a speculative relationship. It is a documented, mechanical pipeline.
The Conference Board Leading Economic Index formally includes nondefense capital goods orders excluding aircraft as one of its ten components, an institutional recognition that core capital goods orders carry genuine forward-looking signal rather than simply reflecting current activity.
Rising core capital goods orders signal future strength in the business investment component of GDP. Sustained declines signal future weakness. Either way, you are seeing the information months before it appears in official GDP reports.
The recession signal: what happens when equipment orders fall, and what it means when they do not
Three distinct mechanisms cause equipment orders to fall ahead of recessions, and they often reinforce each other:
- Tightening credit conditions: Higher interest rates or stricter lending standards raise the cost of financing large equipment projects, making marginal investments uneconomic
- Profit compression: Falling profits or weaker cash flows reduce firms’ internal funding capacity, forcing them to prioritise existing commitments over new capital
- Sentiment deterioration: When managers grow cautious about the outlook, they defer irreversible commitments to new equipment, choosing to wait rather than commit
When these forces push equipment orders lower, the downstream effects multiply. Fixed investment subtracts directly from GDP. Manufacturing, transport, and related services that supply or depend on this equipment come under pressure. Hiring freezes and layoffs often follow, as firms signal they do not expect near-term demand to justify current headcount.
The empirical evidence supports the idea that this is not just cyclical noise. Research by DeLong and Summers, using cross-country panel data, found that each additional 1% of GDP devoted to equipment investment is associated with approximately 0.2-0.35 percentage points of faster annual GDP growth. The relationship is stronger for equipment than for structures, suggesting equipment embodies new technologies and drives productivity gains beyond its direct contribution.
The DeLong and Summers NBER research used cross-country panel data to establish that the equipment-growth relationship is stronger than for structures, a finding that underpins the widely-held view that equipment spending embodies productivity-enhancing technology rather than simply adding capacity.
DeLong and Summers (1991) found that each additional 1% of GDP allocated to equipment investment is associated with roughly 0.2-0.35 percentage points of additional annual GDP growth, a relationship stronger than for any other investment category.
When firms cut back on equipment, they are not trimming a minor budget line. They are withdrawing the investments most closely linked to future productivity and growth.
Reading the current signal: what late-July 2026 data suggests
As of late July 2026, US Q2 GDP was pending release (scheduled for 31 July 2026), making the orders data the best available forward read on the investment cycle. The picture it shows is constructive.
Broad-based growth in capital goods orders through mid-2026 is viewed by analysts as inconsistent with recessionary conditions and consistent with continued expansion. Credit is moving through lending channels and corporate bond markets, with businesses actively putting capital to work rather than sitting on it. The sustained decline in orders across multiple categories that has historically preceded recessions is not present in the current data.
For you, the data point that matters is not just what equipment orders are doing in absolute terms. It is whether the pattern of sustained, multi-category decline historically associated with recessions is present or absent. Right now, it is absent.
Why the AI narrative is incomplete: the case for reading breadth, not just headlines
Media coverage through the first half of 2026 has correctly identified gains in computer and electronic product orders as a real component of durable goods growth. AI-related technology spending is genuinely contributing to the numbers. That part of the story is accurate.
The Q1 2026 data illustrated this dynamic clearly: private sector momentum ran at 2.2% annualised once government spending swings and import distortions were stripped out, with business fixed investment surging 10.4%, a split the headline figure of 2.0% entirely obscured.
Where the framing falls short is in treating technology spending as the primary explanation for US economic strength. Equipment investment spans far more than servers and semiconductors. The June 2026 durable goods report showed increases across multiple categories, many of them unrelated to artificial intelligence.
| Equipment category | Orders increased (June 2026) | AI-related or non-AI demand |
|---|---|---|
| Computer and electronic products | Yes | Primarily AI-adjacent |
| Home appliances | Yes | Non-AI (consumer durables) |
| Air conditioning units | Yes | Non-AI (construction/industrial) |
| Automotive components | Yes | Non-AI (transport/manufacturing) |
OECD and IMF data reinforce the point: machinery and equipment investment has risen as a share of real GDP across both advanced and emerging economies, reflecting a broad production role rather than a single-sector phenomenon.
When orders are rising across multiple independent equipment categories, the expansion has multiple sources of demand. That makes it more resilient to any single-sector reversal than a technology-only narrative would suggest.
Why does breadth matter to you specifically? Because it tells you how many independent things would have to go wrong simultaneously for the expansion to stall. A tech-only story is a fragile story. Multiple, unrelated sectors all ordering new equipment is a structurally different, and more durable, configuration.
Putting it together: what equipment investment tells you that GDP headlines do not
The framework this article has built runs through three layers, and each gives you a different kind of information:
First, track equipment investment as a share of GDP to understand structural weight. At 5.3%, it is small in aggregate but disproportionately informative about the direction of the business cycle.
Second, watch core capital goods orders monthly for the earliest available signal on business investment intentions. Because orders precede shipments, and shipments precede GDP registration, you are seeing information the headline GDP number will not reflect for months.
Third, assess the breadth of orders growth across categories. A rising total driven by one sector is a different signal from a rising total spread across transport, industrial machinery, household-related manufacturing, and technology. Breadth tells you about resilience.
The limitation of leading with GDP headlines is straightforward: aggregate consumption data tells you what already happened and tends to lag cyclical turning points. Equipment investment and core capital goods orders, in combination with credit conditions and business sentiment, generally provide a cleaner, earlier read on the business cycle.
A single GDP release carries average absolute revision risk of around 0.6 percentage points, meaning a modest consensus miss can disappear entirely in subsequent estimates; the orders data discussed above helps you form a view before revisions become relevant.
The current reading, as of late July 2026, is constructive. Broad-based durable goods expansion, with no sustained order declines across multiple categories, supports a continued expansionary outlook.
Translating constructive equipment orders data into a portfolio stance requires weighing recession probability signals alongside labour market readings; the Sahm Rule at 0.10 in May 2026, well below the 0.50 trigger, reinforces the equipment orders picture of continued expansion rather than imminent contraction.
Three signals that would change the picture
Watch for any of these developments, which would warrant reassessment:
- Sustained decline in core capital goods orders across multiple categories, not a single-month dip but a pattern persisting over several reports
- Tightening credit conditions that raise financing costs materially for equipment purchases, particularly for mid-sized manufacturers who rely on external funding
- Narrowing of orders growth to a single sector (technology-only, for example), which would indicate the broad-based resilience argument no longer holds
None of these conditions is present in the current data. That does not guarantee continued expansion, but it does mean the evidence-based case for imminent recession is weaker than media sentiment sometimes implies.
This article is for informational purposes only and should not be considered financial advice. Investors should conduct their own research and consult with financial professionals before making investment decisions.
Past performance does not guarantee future results. Economic indicators are subject to revision, and forward-looking assessments are inherently uncertain.
The 5% figure that professionals watch most closely
The paradox this article opened with has a straightforward resolution. Equipment investment is 5.3% of GDP, but its leading-indicator properties give it an analytical weight that far exceeds its aggregate size. Professional economists and recession forecasters watch it so closely not because of what it is, but because of what it tells you about what comes next.
The current data configuration, with broad-based order growth across multiple equipment categories and no sustained recessionary signal, is meaningful positive evidence. It is not just the absence of bad news. It is the presence of the specific pattern, widespread capital deployment across unrelated industries, that has historically been associated with continued expansion rather than contraction.
What this understanding changes for you is practical. Economic conditions are best read through the indicators that move first, not the ones that are largest. Equipment investment is the clearest example of that principle in the US national accounts. Once you know to watch for the direction and breadth of capital goods orders alongside the headline GDP number, you are reading the economy the way professionals do, not reacting to it after the fact.
Economic conditions are best read through the indicators that move first, not the ones that are largest. Equipment investment is the clearest example of that principle in the US national accounts.