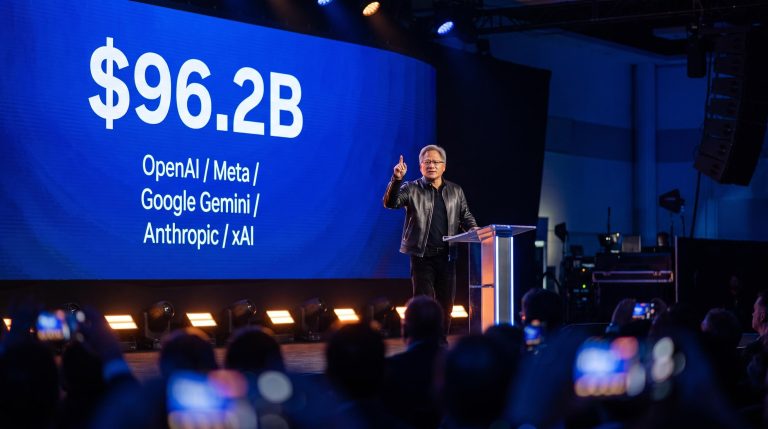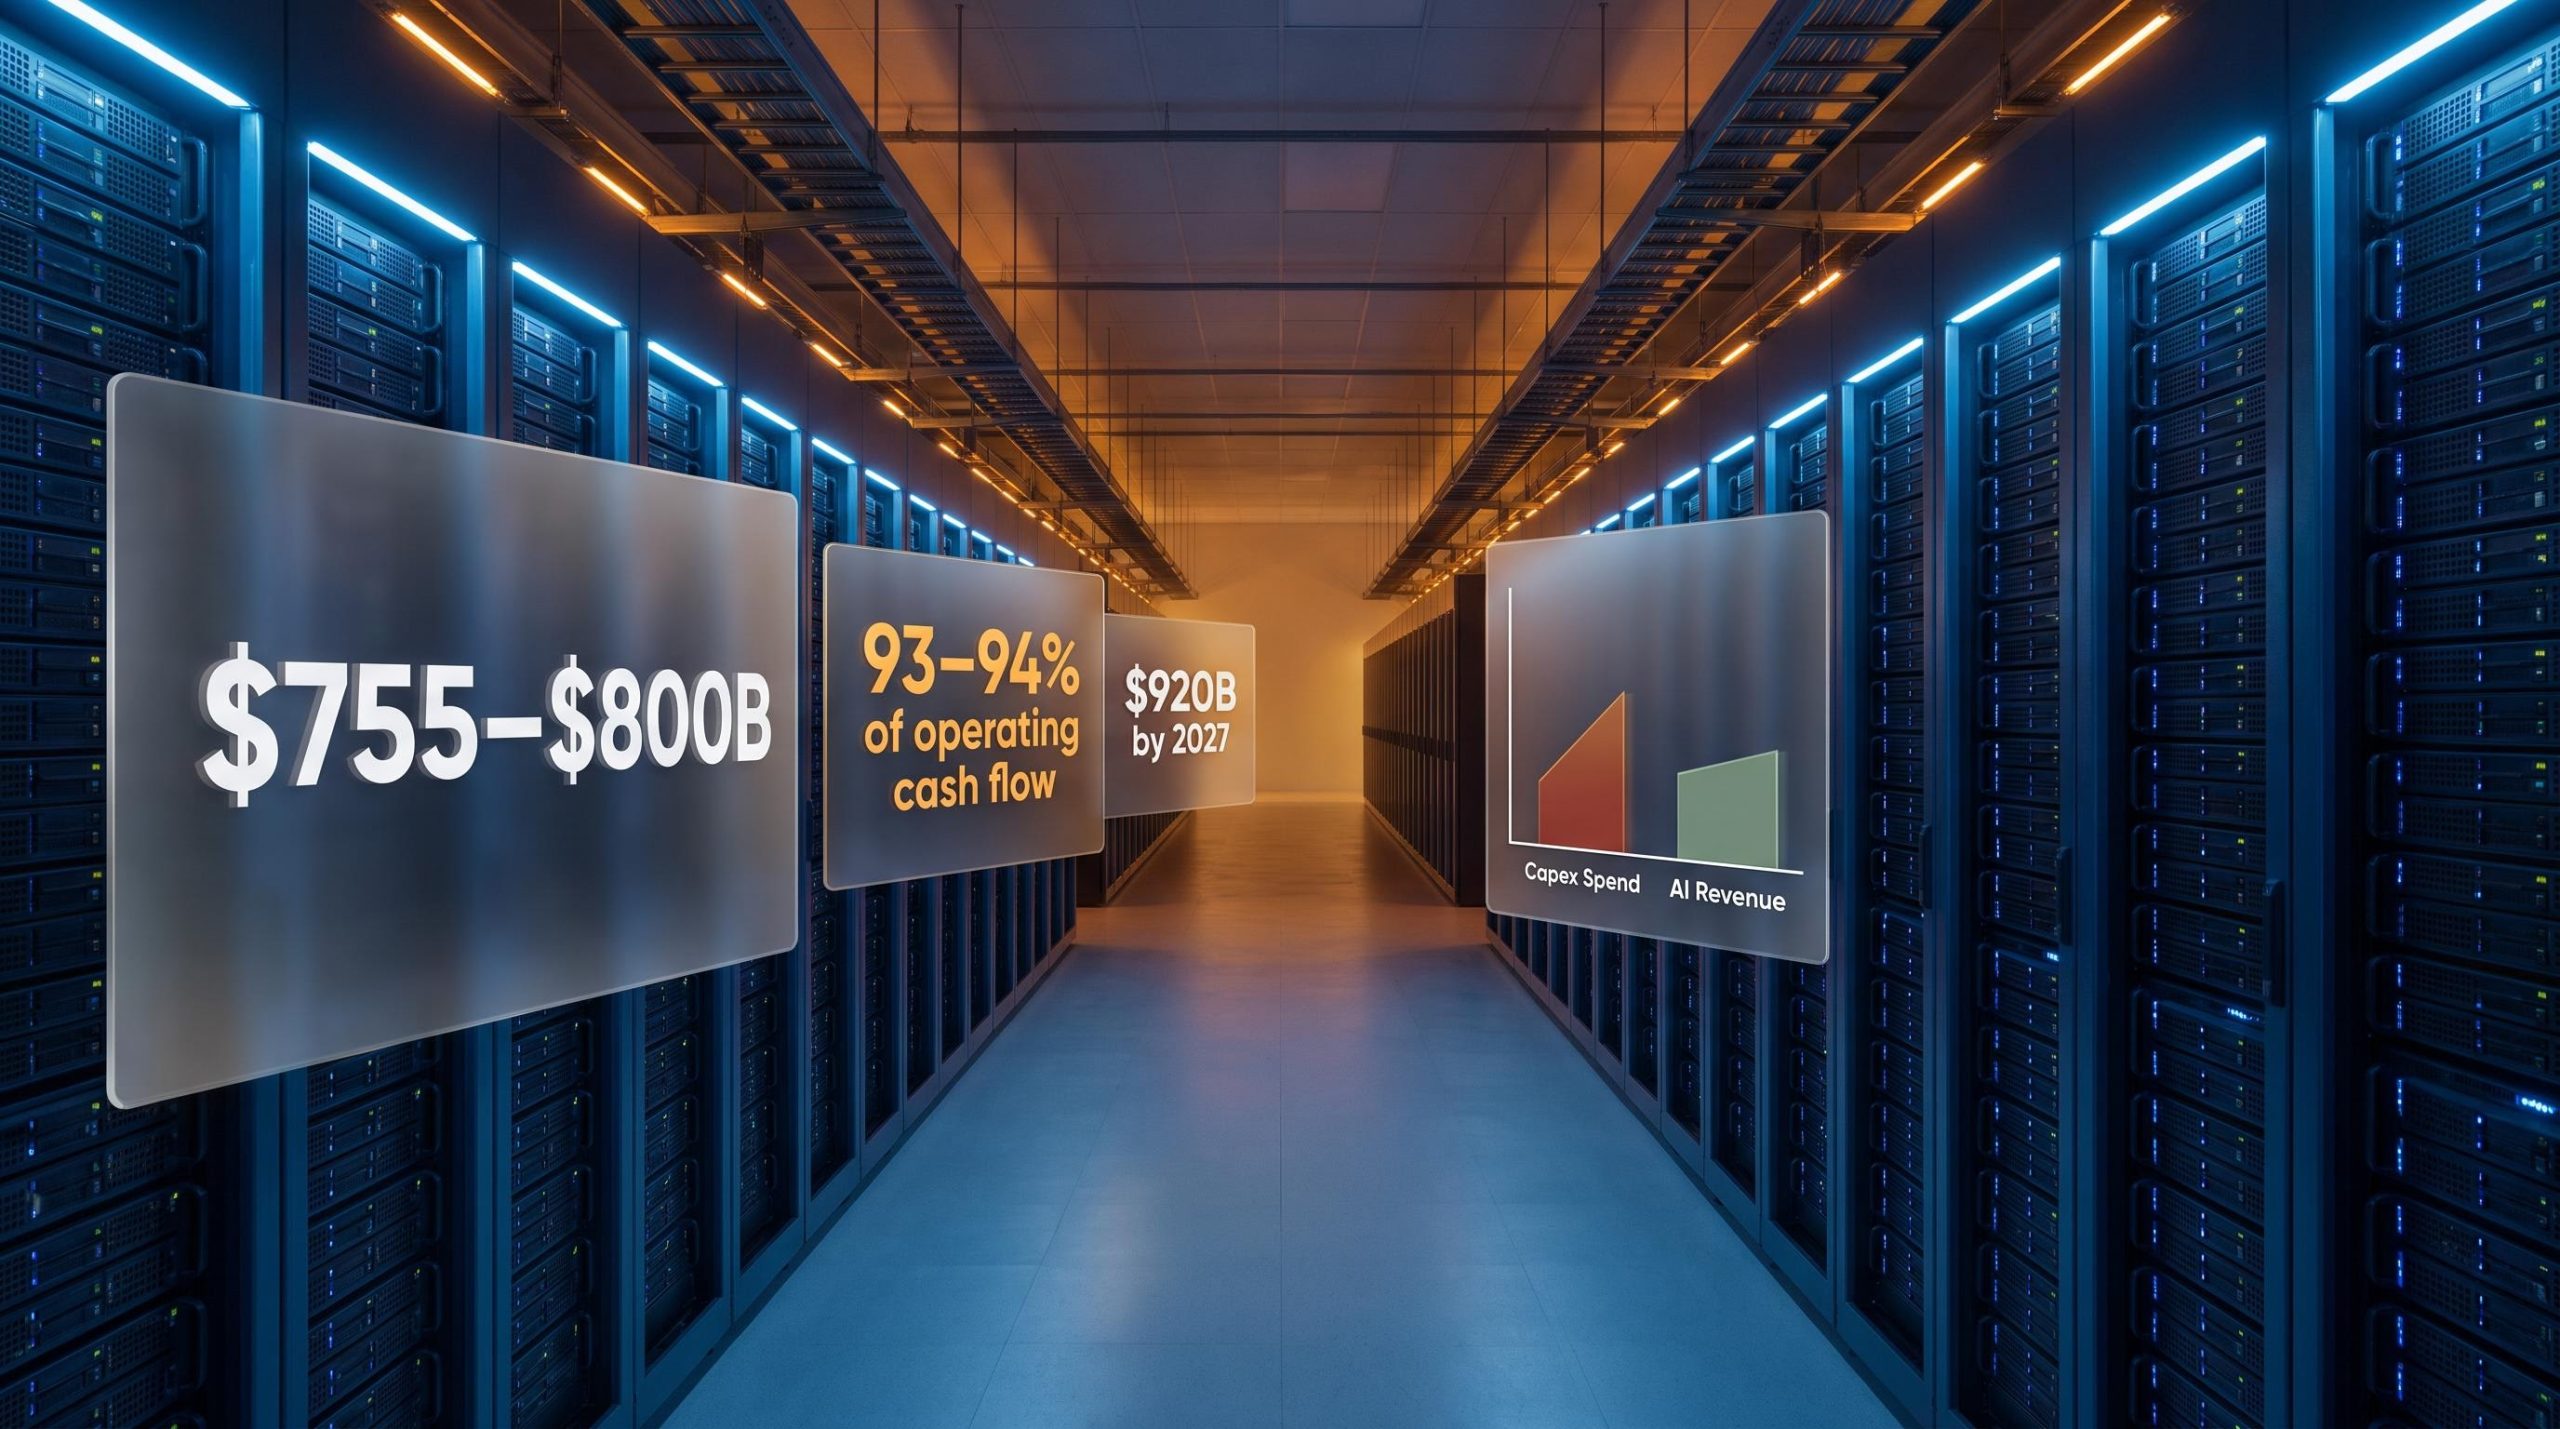
“The companies spending the most on AI are not the ones making the most money from it. Goldman Sachs estimates hyperscaler capital expenditure will reach approximately $755-$800 billion in 2026, a figure that consumes roughly 93-94% of their operating cash flow. That ratio should stop any investor who assumes AI spending and AI returns are the same trade.\n\nThis is a structural shift in how the technology sector allocates capital, and it carries echoes of prior boom-and-bust capex cycles, though at a scale that dwarfs all of them. Markets in the first half of 2026 began drawing a sharp line between companies generating current AI revenue and those primarily acting as capital providers, and the price action punished the wrong side of that line quickly.\n\nThe AI investment boom has now pushed US IT hardware and software spending to 4.9% of GDP in Q1 2026, surpassing both the dot-com era peak of approximately 4.2% and the cloud buildout peak of approximately 3.8%, providing historical scale context that reinforces why the current cycle demands a different analytical framework than prior tech expansions.\n\nHere is a framework for identifying which side of the AI capex divide your portfolio is actually on, and what the warning signs look like before they appear in earnings.\n\n## The scale that rewrites the rules of corporate capital allocation\n\nThe headline figures are large enough to require context. Goldman Sachs projects the largest AI providers will spend approximately $755-$800 billion on AI-related capital expenditure in 2026. Bank of America and Evercore place the range at $800-$900 billion. A core group of seven firms alone is estimated to spend approximately $775 billion, with the five largest exceeding $600 billion.\n\nThese are not one-off investments. Goldman Sachs forecasts 2027 capex rising to $920 billion, while Bank of America and Evercore project it will exceed $1 trillion.\n\nWhat makes the numbers visceral is not the dollar amount but what they represent as a share of the cash these companies generate.\n\n> PIMCO estimates that hyperscaler capital expenditure now absorbs close to 93-94% of operating cash flow, a dramatic rise from the 33-40% range recorded in 2022-2023. These companies are effectively running as capital-allocation machines, leaving almost nothing for buybacks, dividends, or financial flexibility.\n\n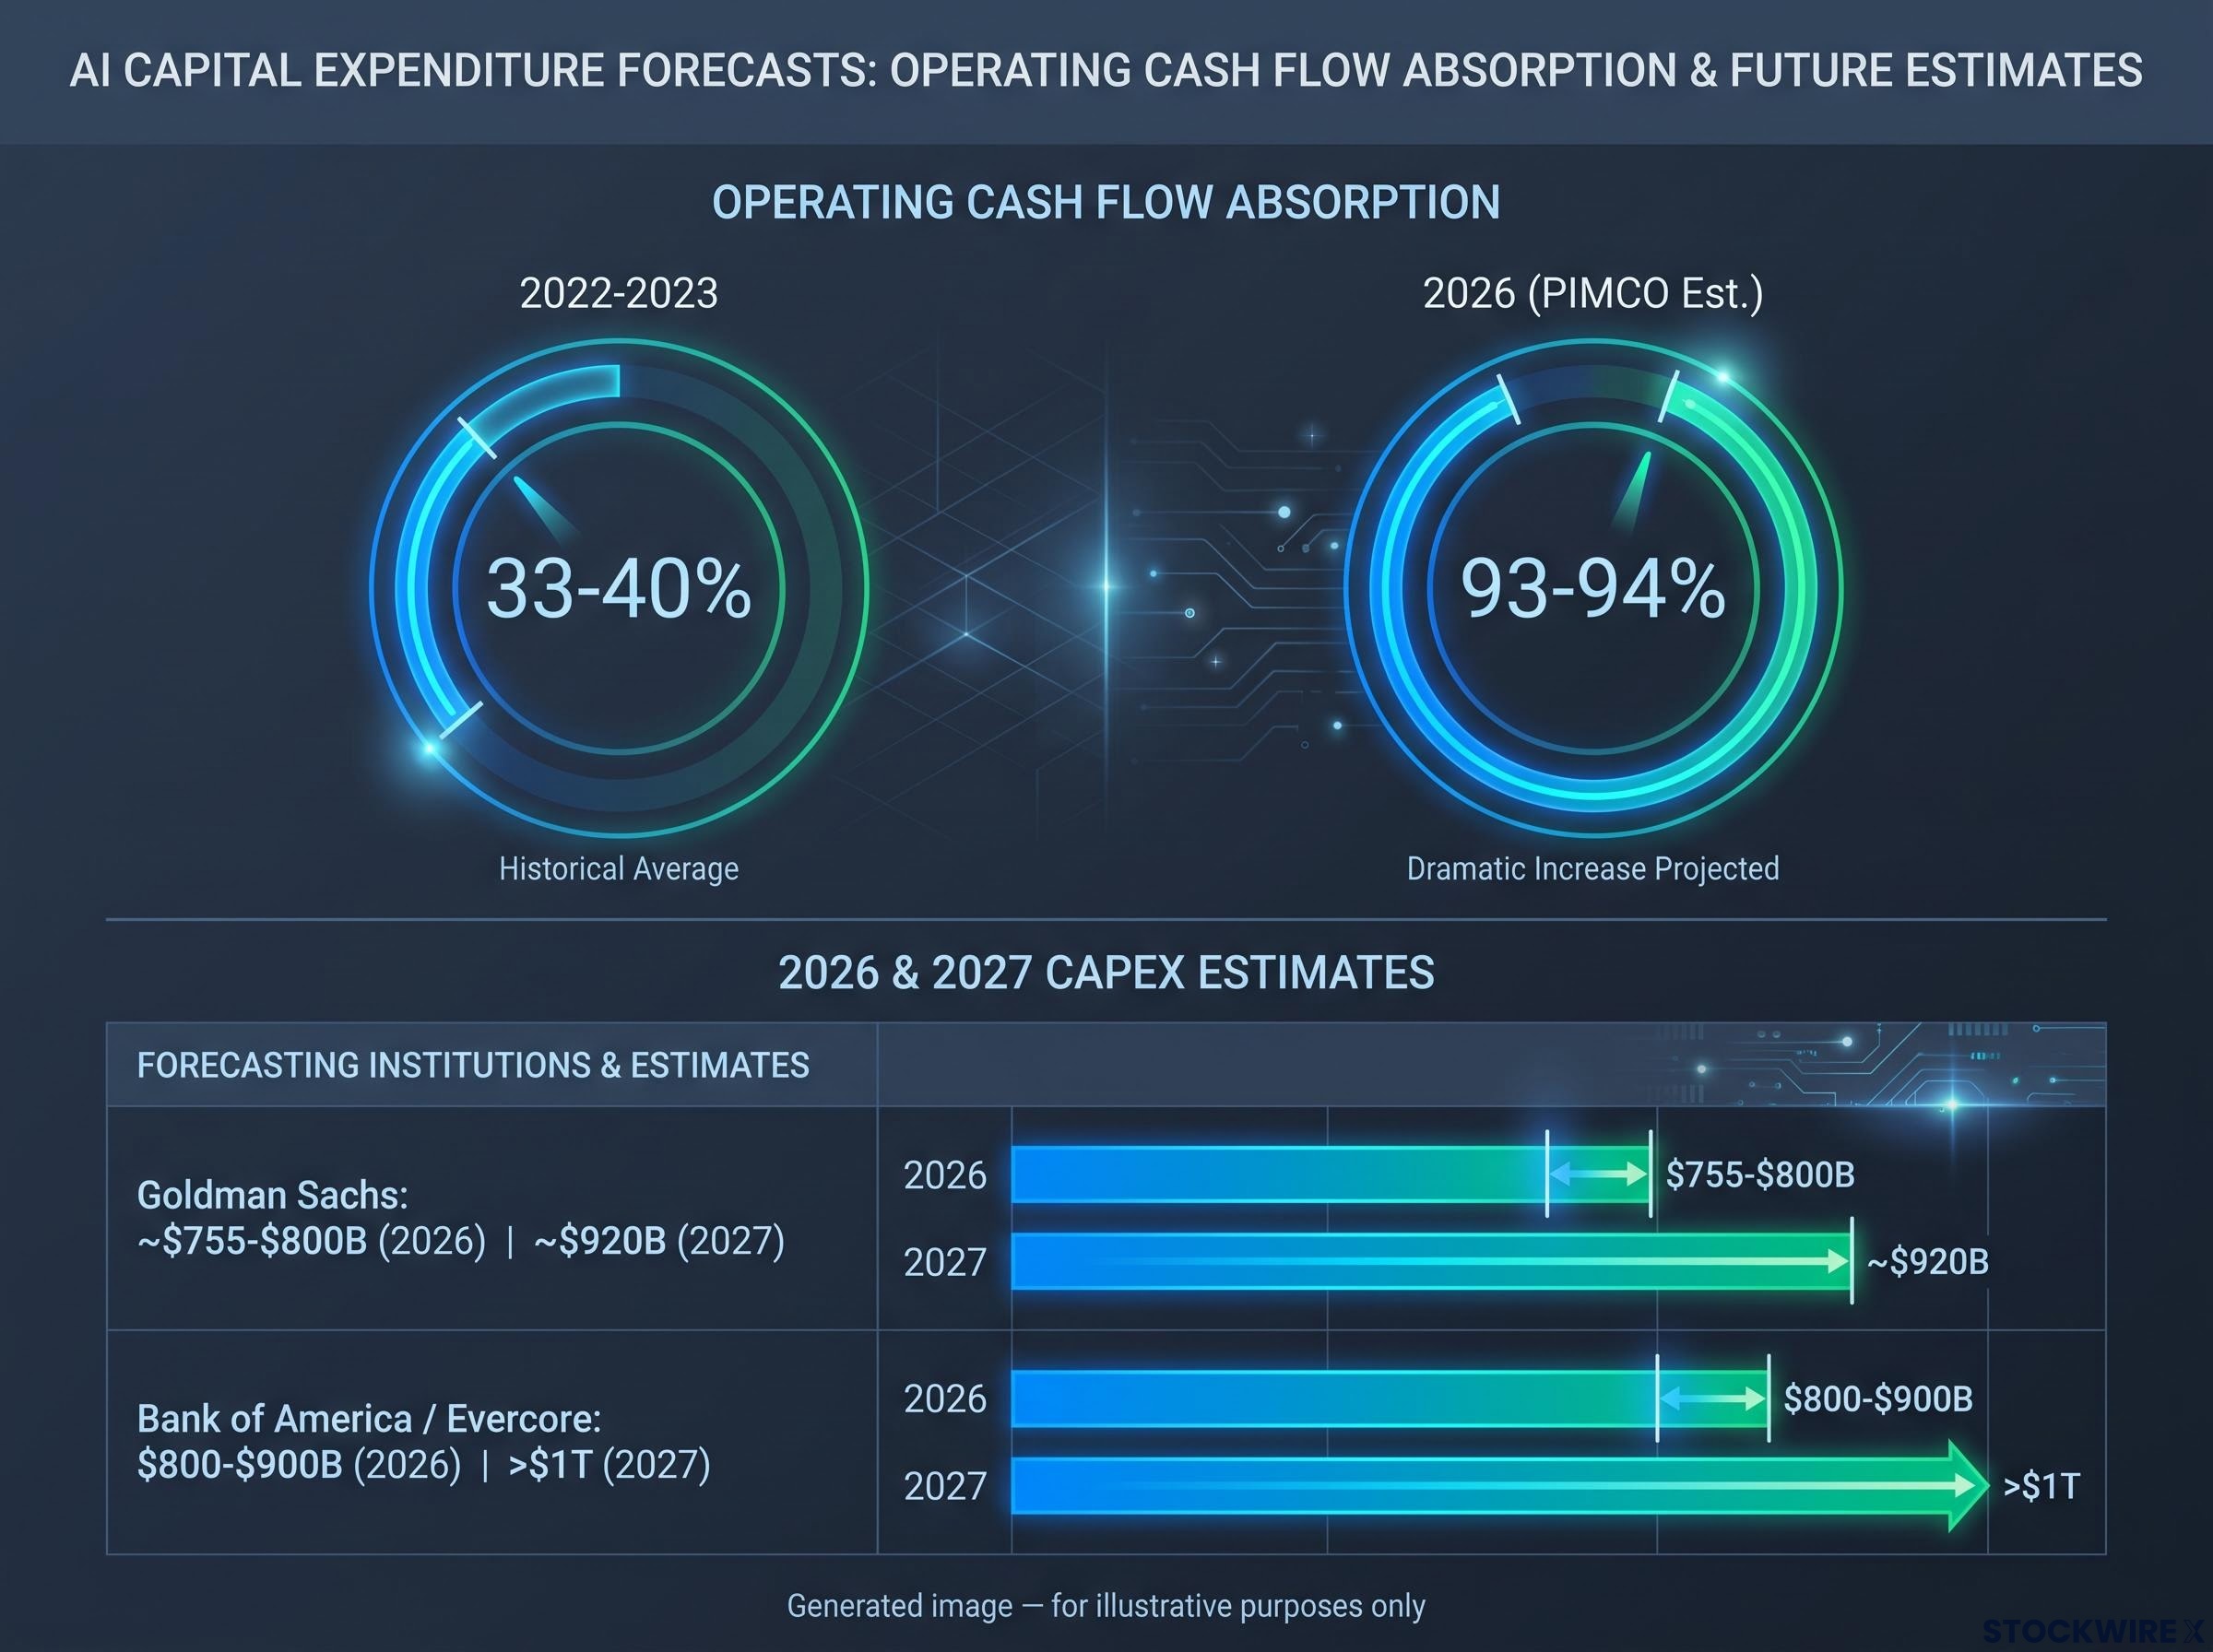 \n\nThat intensity ratio changes the risk profile of owning these equities. When nearly all internal cash is being recycled into infrastructure bets, free cash flow and return on invested capital (ROIC, the profit generated per dollar of capital deployed) guidance matter more than revenue growth in any earnings release.\n\n
\n
\n\n\n\n\n\n\n\n\n\n\n\n\n\n\n\n\n\n\n\n\n\n\n\n\n\n\n\n\n\n\n\n\n\n\n
| Source | 2026 estimate | 2027 estimate | Key context |
|---|---|---|---|
| Goldman Sachs | ~$755-$800B | ~$920B | Largest capex boom in history |
| Bank of America / Evercore | $800-$900B | >$1T | $1.7T annually by 2030 |
| Allianz | ~34% of revenue | N/A | More than double the 1990s internet peak |
| Mill Creek Investment Mgmt | ~30% of S&P 500 capex | N/A | ~4% of US GDP, +0.5-1pp GDP growth |
\n
\n\n### From annual spend to multi-year commitment\n\nThe single-year figures understate the cycle’s duration. Sparkline Capital, citing McKinsey, estimates cumulative AI investment of approximately $5.2 trillion over five years. Bank of America projects annual AI data-centre investment reaching $1.7 trillion by 2030, compounding at roughly 25% per year. Allianz research shows capex intensity at approximately 34% of revenue, more than double the peak during the 1990s internet build-out. This is not a one-year surge. It is a multi-year capital commitment with a trajectory that is still accelerating.\n\n## The beneficiary hierarchy: who is banking the money today\n\nThe defining inversion of this cycle is straightforward: hyperscalers are the payers, and hardware and infrastructure suppliers are the earners. The companies absorbing the most financial risk are not the same companies receiving payment today.\n\nData-centre-oriented chip spending nearly doubled last year, driven by large language model training and generative AI applications. GPU and related suppliers are showing strong earnings upgrades tied to locked-in order backlogs. The supply scarcity in cutting-edge semiconductors is amplifying pricing power across the chain. Six categories of beneficiaries sit downstream from hyperscaler balance sheets:\n\n- GPU and accelerator designers: acute supply scarcity and locked-in multi-year roadmaps give them outsized pricing power\n- Memory and storage vendors: high-bandwidth memory tuned for AI workloads, with demand outstripping production capacity\n- Networking and optical interconnect firms: linking massive GPU clusters requires specialised high-speed components with limited alternative suppliers\n- Power equipment and grid suppliers: data centres draw enormous electrical loads, and power infrastructure cannot be built overnight\n- Data centre owners and operators: hyperscalers are leasing and co-locating capacity at contracted rates with strong order books\n- Engineering and construction firms: large-scale facility development with multi-year project timelines\n\nThese firms benefit from contracted demand and supply constraints. But the supply scarcity currently protecting hardware margins is a temporary condition, not a structural moat. Investors whose hardware positions are priced for permanent scarcity are holding a timing risk they may not have priced correctly.\n\n### Cloud and software: a more complicated picture\n\nA subset of cloud providers with visible AI-specific revenue lines represent genuine near-term beneficiaries within the hyperscaler group. They have disclosed revenue tied to AI training and inference workloads. But they remain distinct from the broader hyperscaler population, which is characterised more accurately as a financing arm first and an earnings beneficiary second. The software sector’s challenge runs deeper, and it took a $2 trillion market-value shock to reveal just how deep.\n\n## The agentic AI disruption and what it revealed about software valuations\n\n> At its worst, the emergence of agentic AI briefly erased roughly $2 trillion in software sector market capitalisation, marking the most severe business-model repricing the sector has faced in twenty years.\n\nThe mechanism was specific. Agentic AI systems, software that can autonomously perform multi-step tasks, threatened the foundation of enterprise software pricing. Traditional models charge per user or per seat, assuming human workers as the primary users. If AI agents replace those human users, the addressable base for seat-based licences shrinks even as total work done increases. More output, fewer billable users.\n\nThe recovery was real but conditional. Leading software companies regained momentum by transitioning their pricing models from per-user charges to billing based on AI-completed work. Revenue held up as automation displaced headcount because the contract structure adapted. Companies that made this shift linked their revenue to the thing that was growing (AI-driven output) rather than the thing that was shrinking (human headcount).\n\nThe distinction between these two pricing models is now the single most important screen for any software holding:\n\nPer-seat pricing disruption is compounding faster than consensus expects: AI-native entrants are benchmarking enterprise analytics replacements at 80-90% lower cost by eliminating seat overhead entirely, making the pricing model transition from seat-based to consumption-based billing not a gradual shift but a competitive discontinuity.\n\n- Seat-based pricing (exposed): revenue tied to human headcount, vulnerable to automation-driven seat reduction, structurally misaligned with AI adoption\n- Consumption or outcome-based pricing (more resilient): revenue tied to AI-completed work, scales with AI adoption rather than against it, aligned with where enterprise value is actually being created\n\n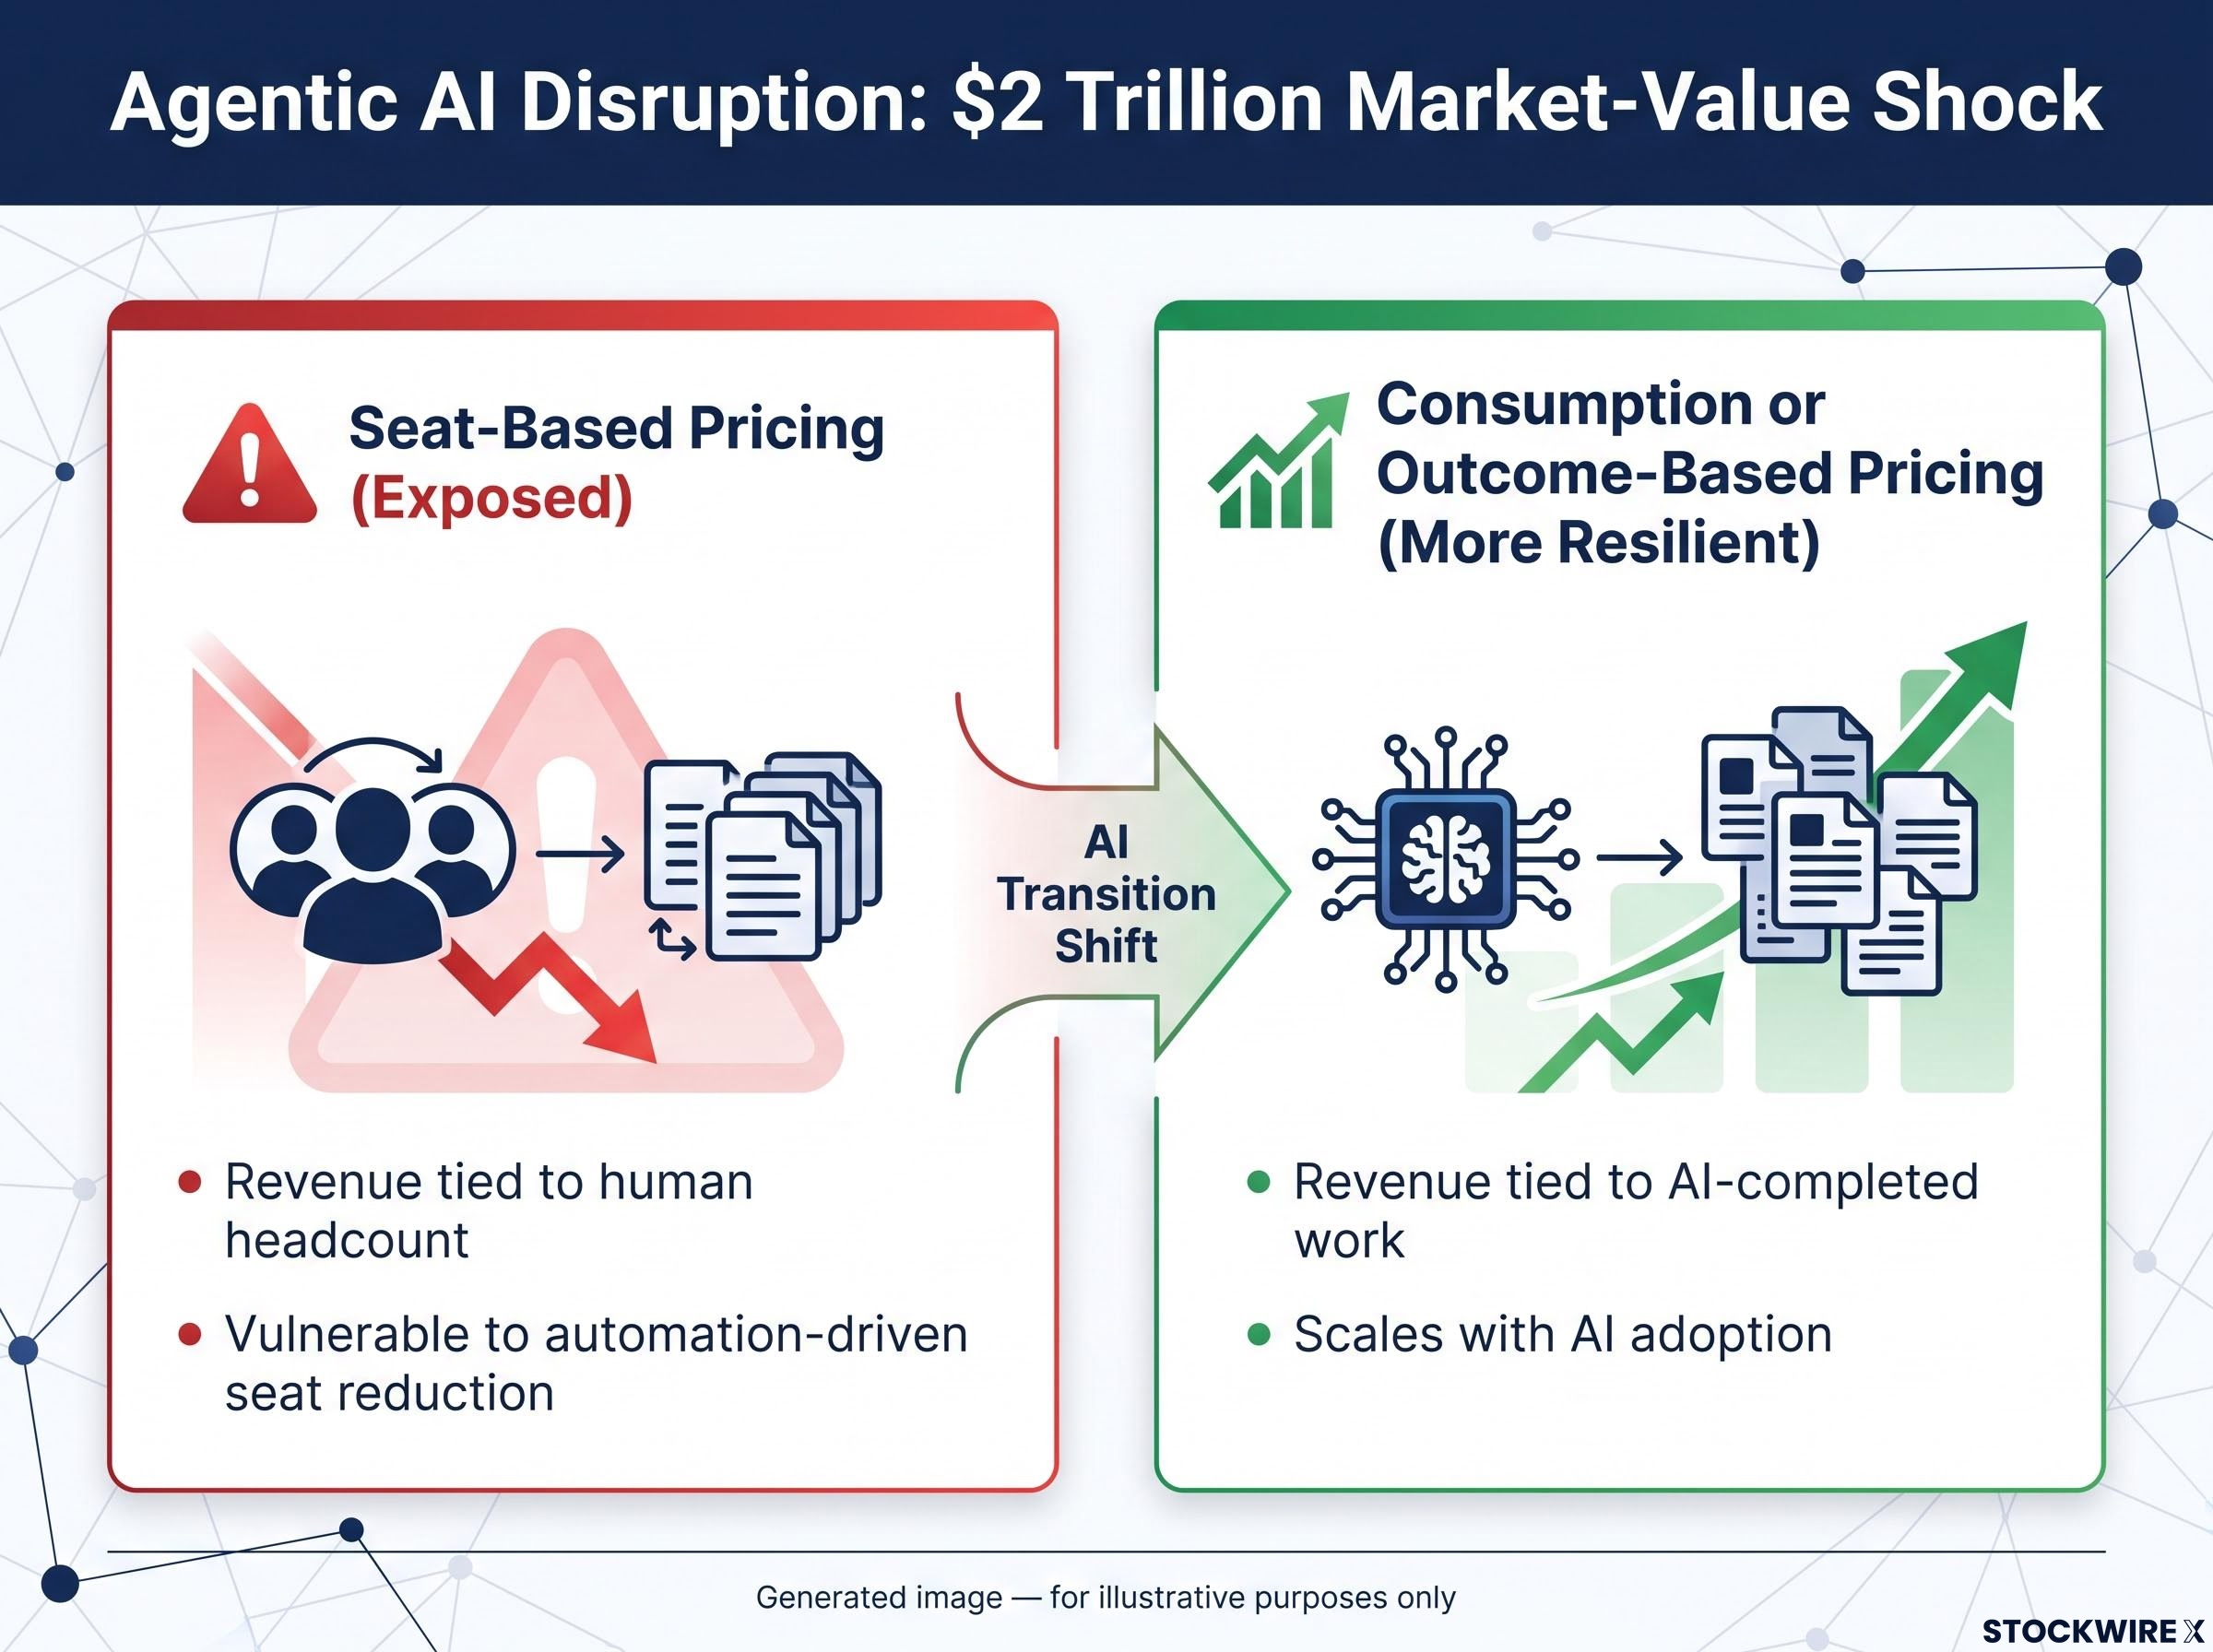 \n\nFor an investor holding enterprise software names, the question is not whether the company has added an AI feature. It is whether the contract structure charges for AI-completed work or still relies on human headcount as the billing unit. The latter remains exposed to compression even if the product is technically AI-enabled.\n\n## Why capex booms often disappoint equity holders\n\nHistorical research across prior capex cycles finds a consistent pattern: large spending booms tend to produce excess capacity, heightened competition, and ultimately declining profitability. Periods of extremely high planned capital expenditure tend to be followed by subpar equity returns. The AI cycle is not exempt from this tendency, and three specific risk mechanisms apply directly.\n\n1. Overinvestment and falling returns: Data centres have long useful lives of 15-20 years, but GPU clusters inside them age much faster, often needing major refreshes in 3-5 years. That asymmetry means the infrastructure generating AI revenue may need to be replaced before it is fully paid back, which changes the ROIC calculus materially from what simple payback models suggest.\n\n2. Scarcity-to-normalisation margin risk: Today’s high margins for hardware suppliers depend heavily on scarcity. Tight supply of high-end chips has allowed outsized pricing and gross margins. But capacity is expanding. As more fabrication plants, packaging facilities, and data centres come online, supply-demand imbalances will ease, eroding the pricing power currently baked into hardware valuations.\n\n3. Financing and balance-sheet risk: As capex absorbs nearly all operating cash flow, some hyperscalers have turned to debt markets to fund incremental spending, raising fixed-cost burdens. Debt makes the cycle more binary for equity holders: if returns materialise, leverage amplifies upside; if they do not, it magnifies downside.\n\nHyperscaler debt issuance reached approximately $121 billion in 2025, roughly four times the five-year average, with a further $100 billion projected in 2026, making the financing mechanics behind the capex surge a separate and compounding risk layer beyond the capex figures themselves.\n\n### The adoption lag scenario\n\nThere is a distinction that matters here: technology success and investment success are separate questions. AI may work exactly as advertised and still produce subpar equity returns if monetisation lags capital deployment. Bear-case scenarios include overbuild leading to excess capacity, adoption lag causing sharp free-cash-flow deterioration, margin compression as supply normalises, and asset obsolescence shortening economic lifespans.\n\nThe economic life of current-generation hardware may not be fully paid back within its peak margin window if revenue ramps are slower than base-case assumptions. Monetisation lagging spending can force equity repricing even when the underlying technology succeeds.\n\n## How to read AI exposure in any portfolio\n\nThe analysis above is useful only if you can apply it to specific holdings. Four diagnostic dimensions convert the macro picture into a personal portfolio interrogation.\n\n
\n
\n\n\n\n\n\n\n\n\n\n\n\n\n\n\n\n\n\n\n\n\n\n\n\n\n\n\n\n\n\n
| Dimension | Hardware / Infrastructure | Software / Platform |
|---|---|---|
| Monetisation timing | Near-term, visible today | Longer-term, contingent on pricing model shift |
| Capital intensity | High cyclicality, large capex requirements | Lower capex, but business-model risk |
| Key risk | Overcapacity and margin compression as supply normalises | Seat-based revenue shrinkage from agentic AI |
| Portfolio signal | Strong order backlogs, disclosed AI revenue | Pricing model transition evidence, consumption-based billing |
\n
\n\nThe index concentration angle makes this more urgent than most investors realise. The ten largest S&P 500 constituents represent approximately 40% of total index weight, according to MSCI index data. Before 2020, that figure was around 20%. According to D. E. Shaw & Co. in its February 2026 paper \”The Concentration Game,\” for the top-ten weight to revert to pre-2020 levels, the remaining 490 companies would need to rally more than 160% while the largest holdings stayed flat.\n\nCorporate capital allocation across the Russell 1000 reached a 27.1% year-over-year surge in capex to $1.3 trillion in Q1 2026, while free cash flow yield fell to a 20-year low of 2.6%, indicating that the valuation risk is not confined to hyperscalers but sits across the broader equity market wherever AI infrastructure spending has outrun underlying fundamentals.\n\n### What passive index ownership actually means for AI exposure\n\nIf you own a standard US or global equity index fund, you are already running a highly concentrated AI bet, whether you chose to or not. The question is whether you are doing so intentionally with a view on the risk, or incidentally without one.\n\nThe pattern extends beyond the US. South Korea and Taiwan together account for roughly 50% of MSCI Emerging Markets capitalisation, per MSCI EM index weights. Broad EM allocations implicitly carry significant AI hardware exposure through the semiconductor supply chain.\n\nSix diagnostic questions you can answer about your own holdings before your next portfolio review:\n\n1. How much of your equity exposure is effectively an AI bet? Look through index funds and identify hyperscalers, major chipmakers, and data-centre operators.\n2. Is your AI exposure mostly in hardware and infrastructure or software and platforms?\n3. Where is AI revenue already visible in the P&L today, with disclosed line items, versus promised in management presentations?\n4. What is the capital-intensity story? What are management’s ROIC targets and timeframes for AI capex?\n5. Are you comfortable with your index concentration, or are you owning AI mega-caps incidentally?\n6. In credit allocations, how does the borrower’s leverage change if AI revenues disappoint by 20-30%?\n\nPractical warning signs to monitor include declining free cash flow, rising debt levels, and aggressive useful-life assumptions on AI hardware assets.\n\n## Where the AI capex cycle goes from here, and what that means for positioning\n\nThe hardware-versus-software bifurcation is the defining portfolio choice of the current phase. Markets in the first half of 2026 rewarded demonstrated monetisation and penalised narrative-only AI exposure. That pattern is not guaranteed to persist, but the principle behind it is durable: cash flow visibility commands a premium when capital intensity is this high.\n\nThree monitoring signals worth tracking between earnings cycles:\n\n- Supply normalisation indicators: as fabrication capacity expands, watch for hardware margins to compress and pricing power to fade\n- Software pricing model transitions: evidence of consumption-based billing adoption (or failure to adopt) determines which software names survive the agentic AI disruption\n- Hyperscaler free cash flow trajectories: the gap between capex and cash generation tells you whether the financing burden is sustainable or accelerating toward debt dependency\n\n> According to PIMCO, when AI is considered alongside defence and energy-security investment, the combined spending cycle could contribute as much as $14 trillion to global capital expenditure across approximately five years, a figure that underlines how durable this structural tailwind is.\n\nThat figure tells you this is not a one-year trade to time but a multi-year structural shift to position for deliberately. The quality of individual company selection within AI matters far more than the binary question of whether to have AI exposure at all. Thematic leadership rotates: energy transition led in 2025, AI and semiconductors led in 2026. The cycle will turn again, and the investors best positioned are those who can distinguish between a durable AI investment thesis, one backed by visible current revenue, credible ROIC targets, and pricing models aligned with how AI actually creates value, and a capex cycle participation trade that is simply a bet on sentiment sustaining longer than fundamentals currently support.\n\nThis article is for informational purposes only and should not be considered financial advice. Investors should conduct their own research and consult with financial professionals before making investment decisions. Financial projections referenced are forward-looking and subject to market conditions and various risk factors. Past performance does not guarantee future results.”
AI concentration risk is not limited to single-stock exposure; a Morningstar basket of 34 AI-related names gained approximately 50.8% in 2025 but produced extreme return dispersion within that gain, with some names posting triple-digit returns while others fell double digits, illustrating why layer-level diversification matters as much as headline thematic exposure.
The substitute versus complement framework provides the most operationally useful screen here: companies where AI deepens product value and raises switching costs occupy a materially different risk position than single-feature SaaS vendors, basic CRM tools, or reporting dashboards where the core function is replicable by an AI agent.
Circular financing structures have begun appearing at the edges of the AI supply chain, most notably in arrangements where chip suppliers reportedly underwrite the infrastructure capacity required to consume their own products, creating contingent liabilities that may not appear on balance sheets until triggered.
Goldman Sachs data centre capacity forecasts were revised sharply upward in late July 2026, nearly doubling the prior base case to 217 GW by 2030, with $6 trillion in supportable capex projected across the buildout, a figure that reinforces the multi-year duration of the infrastructure spending cycle the current phase represents.