Most investors watching the market ahead of a Federal Reserve decision assume the price action is a verdict on the economy. Strong jobs data, cooling inflation, a hawkish tone: these move the tape, or so the story goes.
The reality is far more mechanical. Much of what happens in the days before a rate decision has little to do with the macro case and everything to do with invisible plumbing: dealer hedging, the sensitivity of option positions, and enormous expirations that reset the market’s structure overnight.
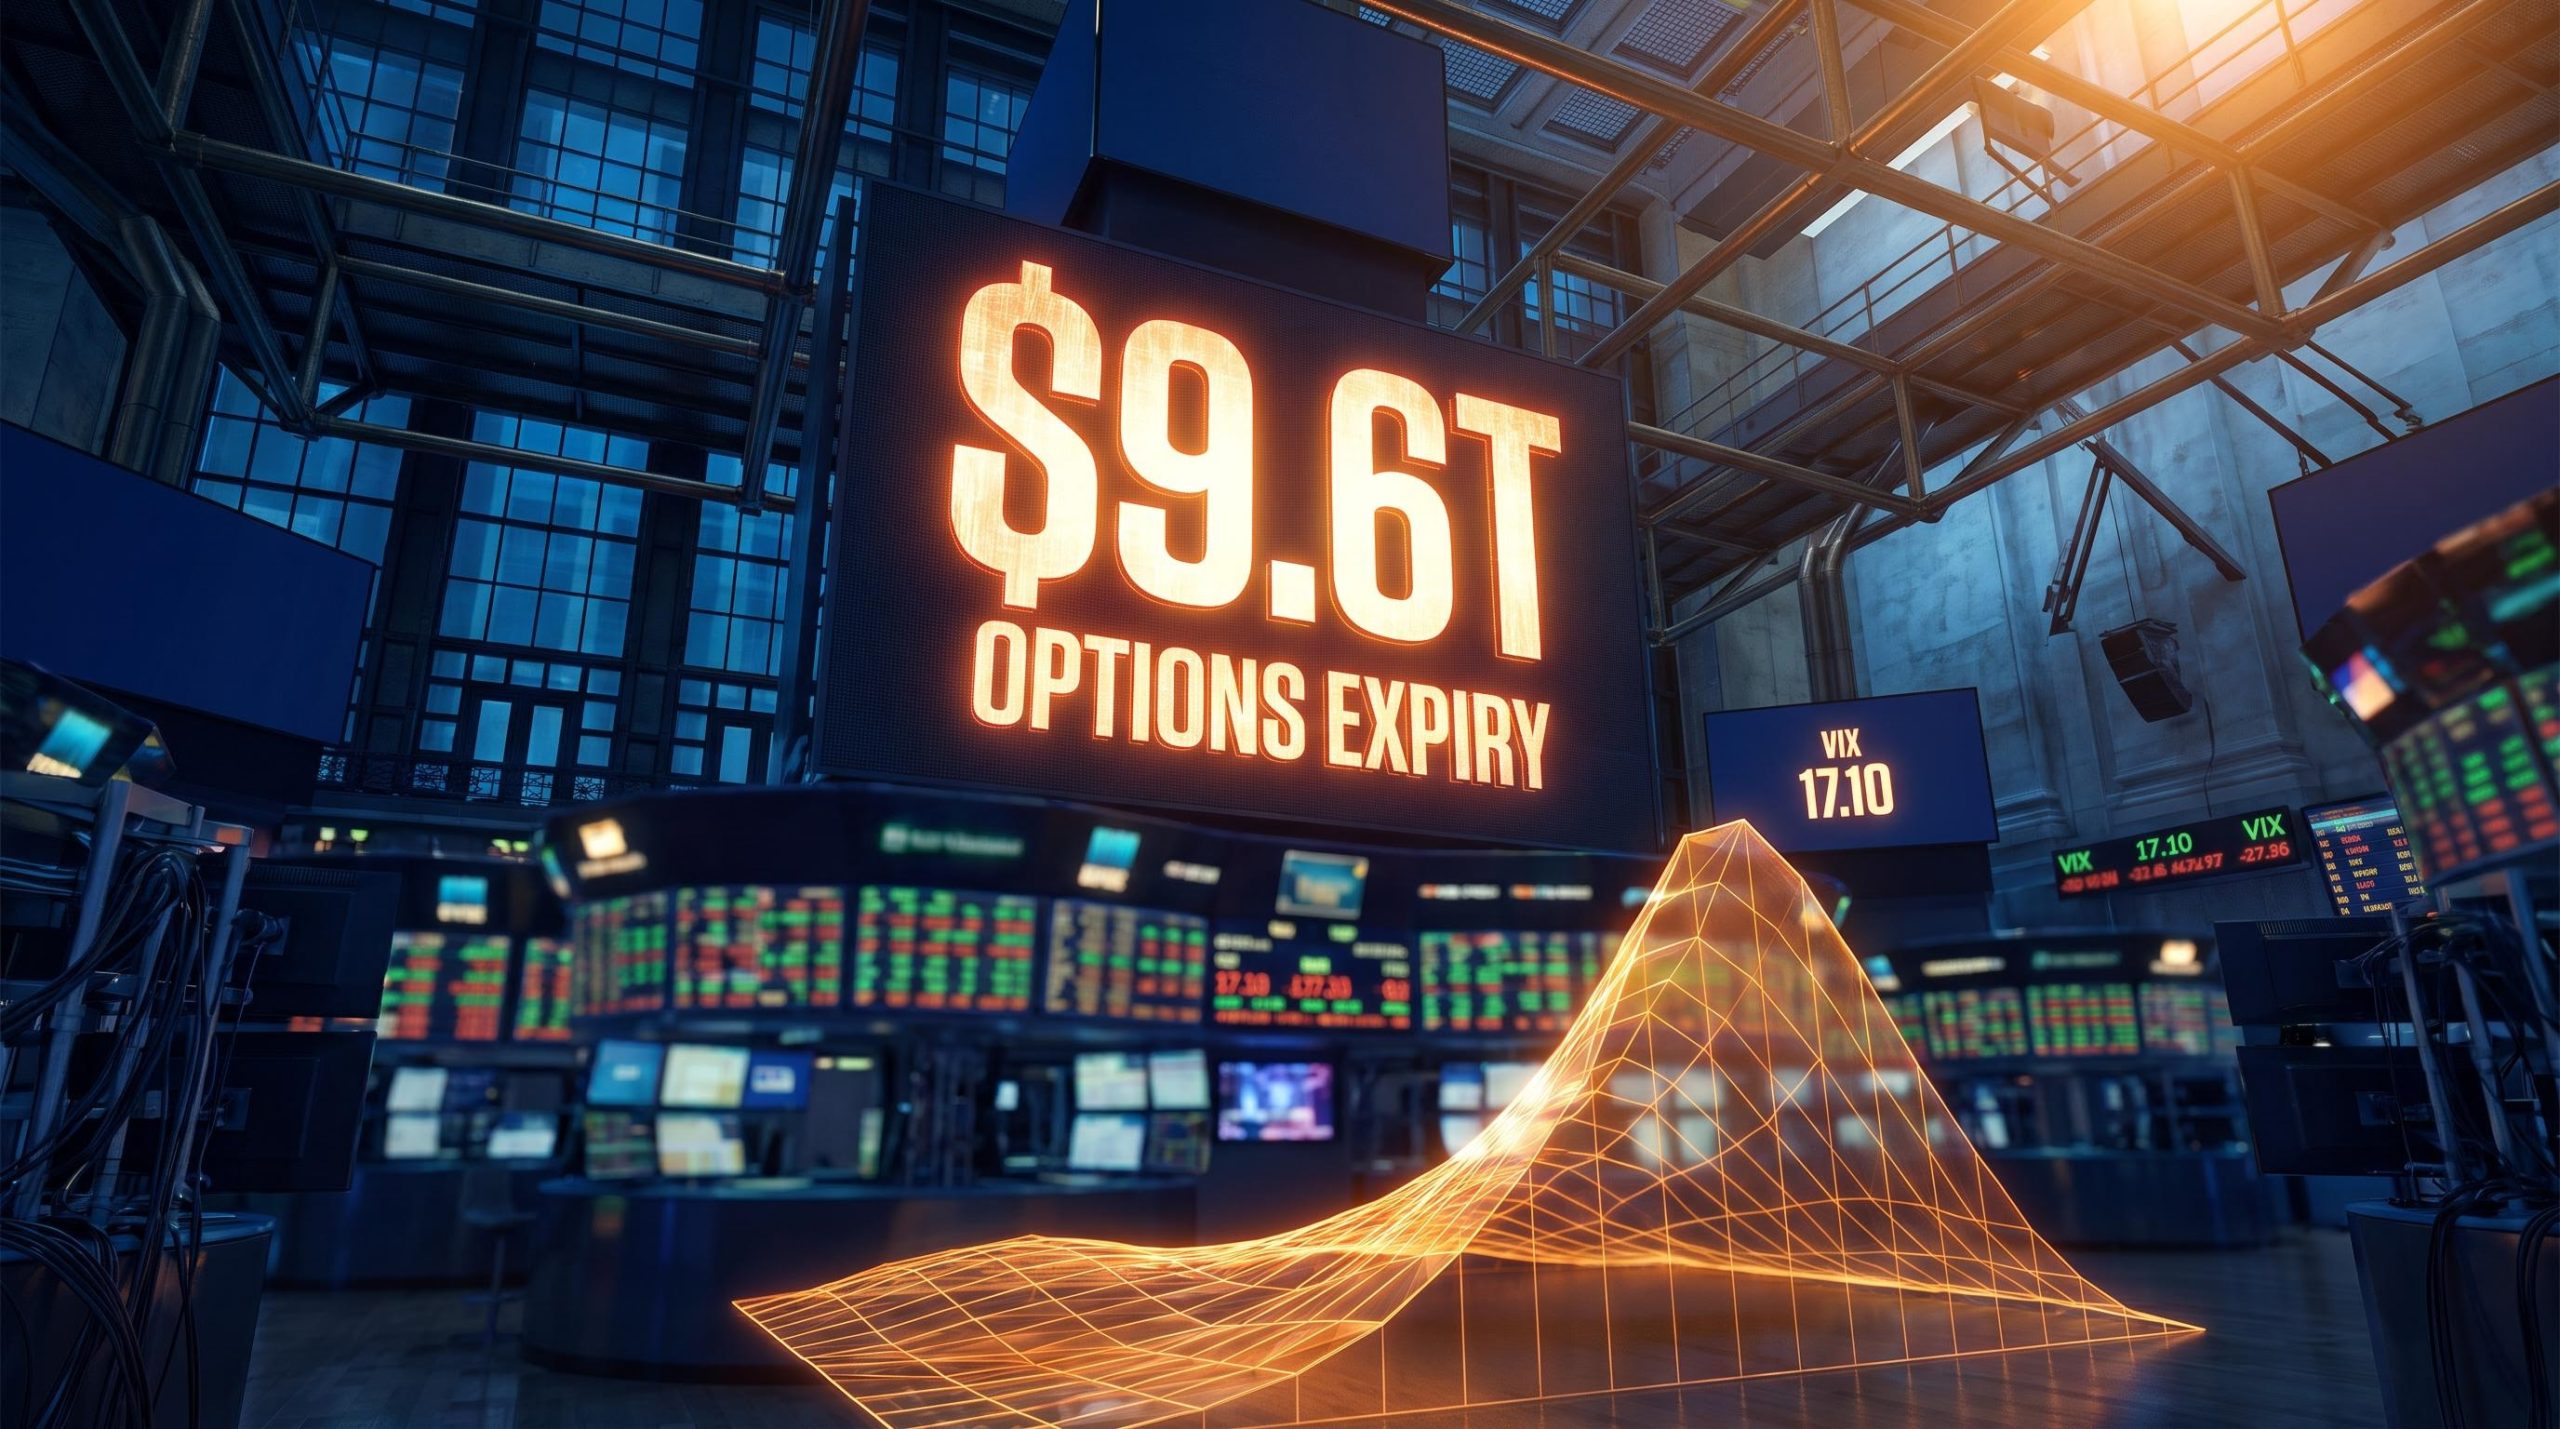
That plumbing is under unusual strain right now. As of mid-September 2026, options market skew (the premium investors pay for downside protection over upside) has climbed to a one-year high, while the headline VIX sits deceptively low around 17.10.
That divergence is arriving at the worst possible moment: a widely expected Fed rate cut colliding with a record-breaking options expiration in the same week.
Here is what the data actually tells you about reading volatility pricing, understanding dealer flows, and protecting your portfolio through a high-density event week.
The invisible forces compressing the market before expiration
On a screen, a mega-expiration week often looks strangely calm. Dips get bought within minutes, rallies fade just as fast, and realised volatility drifts lower even as trillions in notional value sit on the books. That stillness is not conviction. It is engineering.
The engineers are options dealers, and the tools forcing their hand are two of the lesser-known option sensitivities: Vanna and Charm.
Dealer gamma positioning determines whether hedging flows stabilise or amplify price moves: when the S&P 500 trades below its zero-gamma flip level, dealers must sell into declines rather than absorb them, turning the same mechanical buffer that creates pre-expiration calm into an accelerant on the way down.
How Vanna and Charm dictate market direction
Vanna measures how an option’s delta (its directional exposure to the underlying) shifts when implied volatility changes. As volatility drifts lower into expiration, the deltas of out-of-the-money put options shrink. Dealers who sold those puts and hedged by shorting stock or futures must now buy that hedge back to stay neutral.
Charm is delta decay tied purely to the passage of time. As the clock runs down, out-of-the-money options steadily lose delta, which forces dealers to buy shares into weakness and generates a slow upward drift.
Put together, Vanna and Charm push dealers to buy dips and sell rips over and over, suppressing the very volatility the market is bracing for. This is why the window roughly 1 to 1.5 weeks before expiration has historically been the most favourable stretch for selling volatility within a typical four-week cycle.
The zero-day dynamic
This mechanism has been amplified by the explosion in zero-days-to-expiration (0DTE) options, contracts that are born and die on the same trading session. These now account for nearly 50% of all S&P 500 (SPX) option volume.
That concentration traps enormous hedging flows into a single day. Day to day, it dampens movement further. But it also builds fragility, because when those positions expire and dealer gamma flips, the stabilising buffer vanishes in an instant.
You need to see pre-expiration calm for what it usually is: an artificial product of dealer hedging, not genuine bullish conviction. Read a mechanical holding pattern as fundamental strength and you will be badly positioned the moment the buffer disappears.
When big ASX news breaks, our subscribers know first
Decoding the 24-hour pre-announcement drift
There is a second hidden force at work around Fed days, and it is one of the most durable anomalies in modern markets: the pre-FOMC drift.
The pattern is remarkably specific. According to research by Lucca and Moench, later reinforced in a 2026 Federal Reserve Board working paper (FEDS 2026-023), the S&P 500 generated an average excess return of 49 basis points (0.49%) in the 24 hours running from 2:00 p.m. the day before a decision to 2:00 p.m. on the day itself.
Stretch that across the roughly eight scheduled meetings each year and something startling appears. That single narrow window accounted for around 80% of the entire realised equity premium between 1994 and 2011. Options-based measures broadly agree, pegging the long-term Federal Open Market Committee (FOMC) risk premium at about 45 basis points.
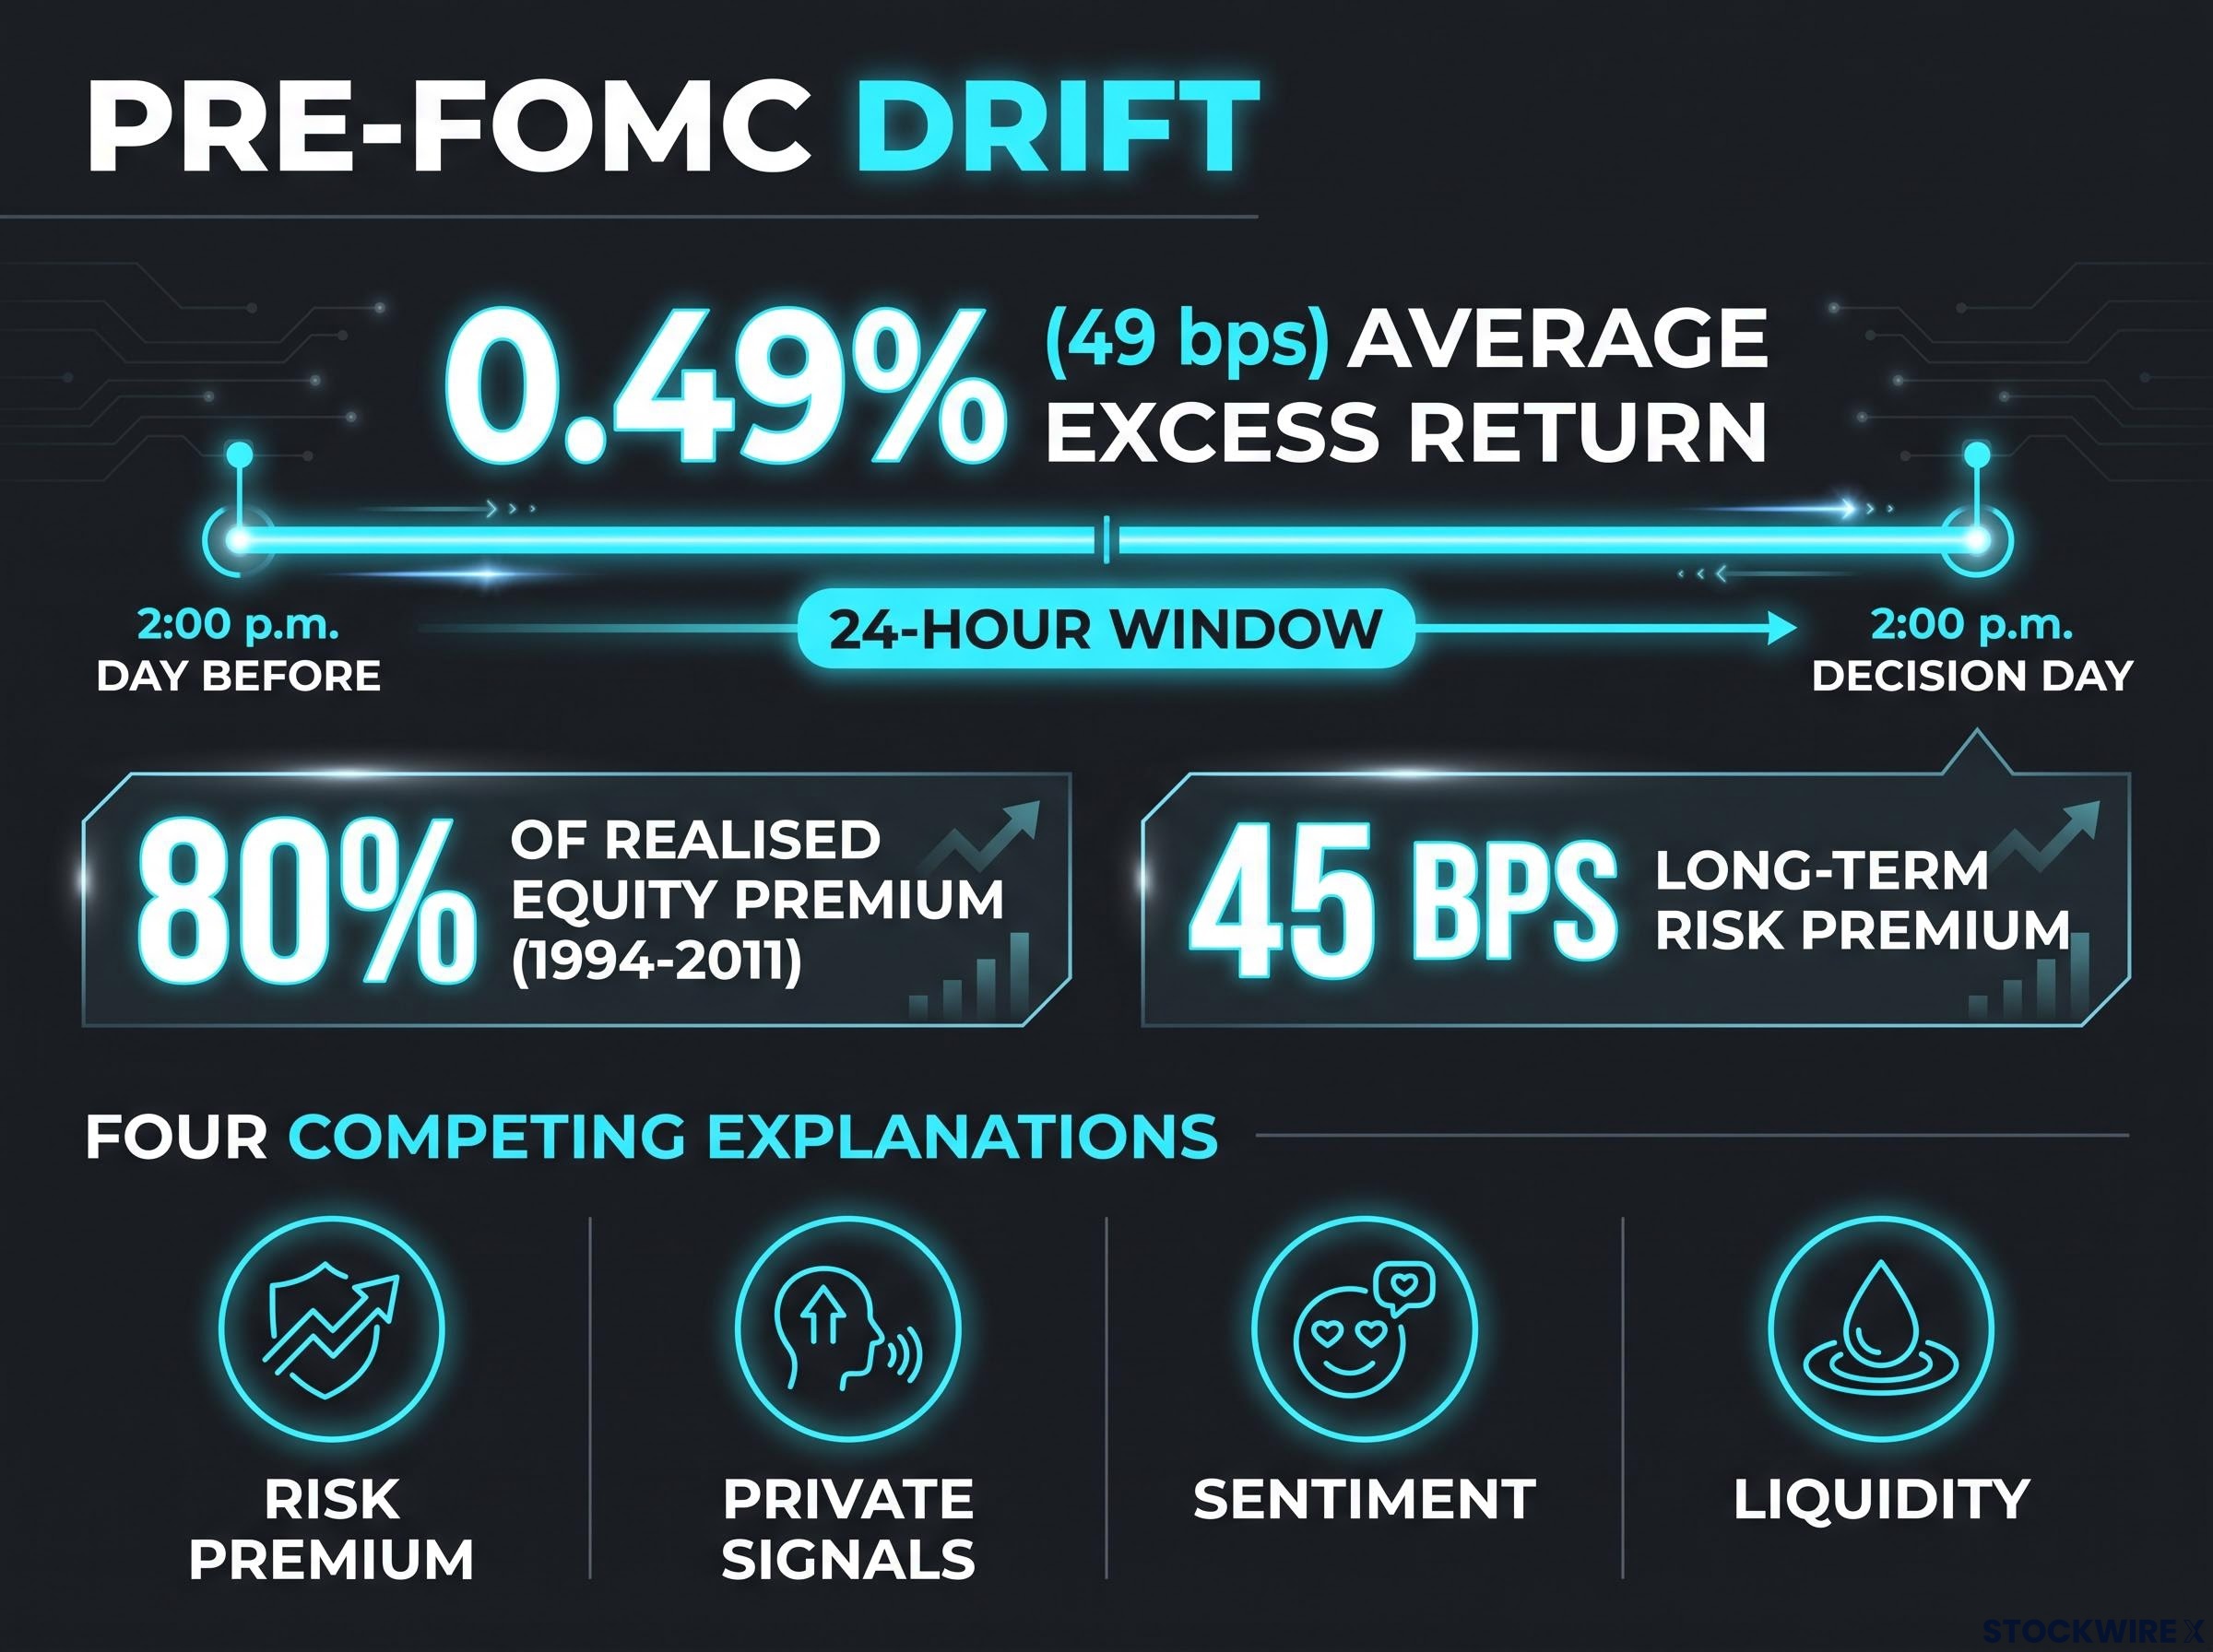
Why does this happen? Researchers have offered four competing explanations, and each captures part of the picture:
- Risk premium: The drift compensates investors for holding non-diversifiable policy uncertainty risk, and it tends to be stronger when easing is expected or the VIX is elevated.
- Private signals: Informed trading during the window gradually leaks policy news into prices, nudging them upward.
- Sentiment: The effect is strongest when investor sentiment is high, pointing to behavioural biases or simple inattention.
- Liquidity: Thin pre-announcement liquidity correlates with weaker pre-announcement returns.
There is an important caveat. Recent studies suggest the anomaly has attenuated through the 2020s, linked to lower uncertainty and structural changes in how policy information is disseminated.
FOMC implied volatility for the S&P 500 has historically priced at roughly 0.8%, about 30% below the premium embedded before CPI releases, a baseline that makes the current skew elevation stand out sharply against the typical pattern of compressed event-day pricing.
This history tells you exactly when the market has traditionally priced in policy uncertainty, and it gives you a way to separate statistical probability from the media noise that surrounds every rate decision. A durable tendency is not a guarantee, and this one is fading.
Navigating September’s historic expiration and Fed collision
Now bring both forces into the same week. This September, the mechanical calm and the pre-Fed drift are set against the largest options expiration ever recorded.
Citadel Securities data projects a record $9.6 trillion in total US stock options expiring by 18 September 2026, with $6.2 trillion of that concentrated on that single Friday. The prior benchmark, the 18 June 2026 event, totalled $8.3 trillion overall.
That scale is not an abstraction. It means the enormous cushion of dealer hedging that has been smoothing every dip is scheduled to expire in the same window the Fed delivers its verdict.
| Expiration event | Total expiry notional | Single-day peak / context |
|---|---|---|
| September 2026 | $9.6 trillion | $6.2 trillion on 18 September; record total, colliding with FOMC |
| June 2026 | $8.3 trillion | Included an adjusted $7.7 trillion single-day figure |
| December 2025 | $7.1 trillion | Quadruple-witching, roughly $5T in SPX |
The Fed backdrop raises the stakes further. Markets have priced in a rate reduction, with the probability of no change placed at slightly better than 5%. When pricing reaches that level, contradicting it becomes its own risk, and failing to deliver a cut would likely trigger aggressive volatility.
Two turning points frame the near term:
- The immediate Fed window, where VIX September options cease trading, September futures expire Wednesday morning, the statement lands at 1:00 p.m. Central Time, and triple-witching follows later that week.
- A second window roughly one and a half weeks later, coinciding with quarter-end.
Treat this week as uniquely fragile. The protective buffer of dealer hedging is set to vanish at the exact moment the central bank speaks, with skew already at a one-year high and the S&P 500 one-month 25-delta put-over-call skew sitting at 4.36 volatility points.
Why selling volatility into elevated skew is a trap
A low VIX is a seductive thing. Since November 2024 the index has averaged around 15.1, and at those levels selling options for income feels like collecting free money. In this environment, that instinct is a trap.
Implied volatility is the single number that compresses all of the market’s collective anxiety about future price movement into every option price and Greek on your chain, and the divergence between its headline reading and skew is precisely what makes the current setup unusual.
The tell is in the divergence. Headline volatility looks calm, but skew (the extra premium buyers pay for downside puts over upside calls) has climbed toward a one-year high. A high SKEW index alongside a subdued VIX means tail insurance is expensive, and institutions are paying up for crash protection for a reason.
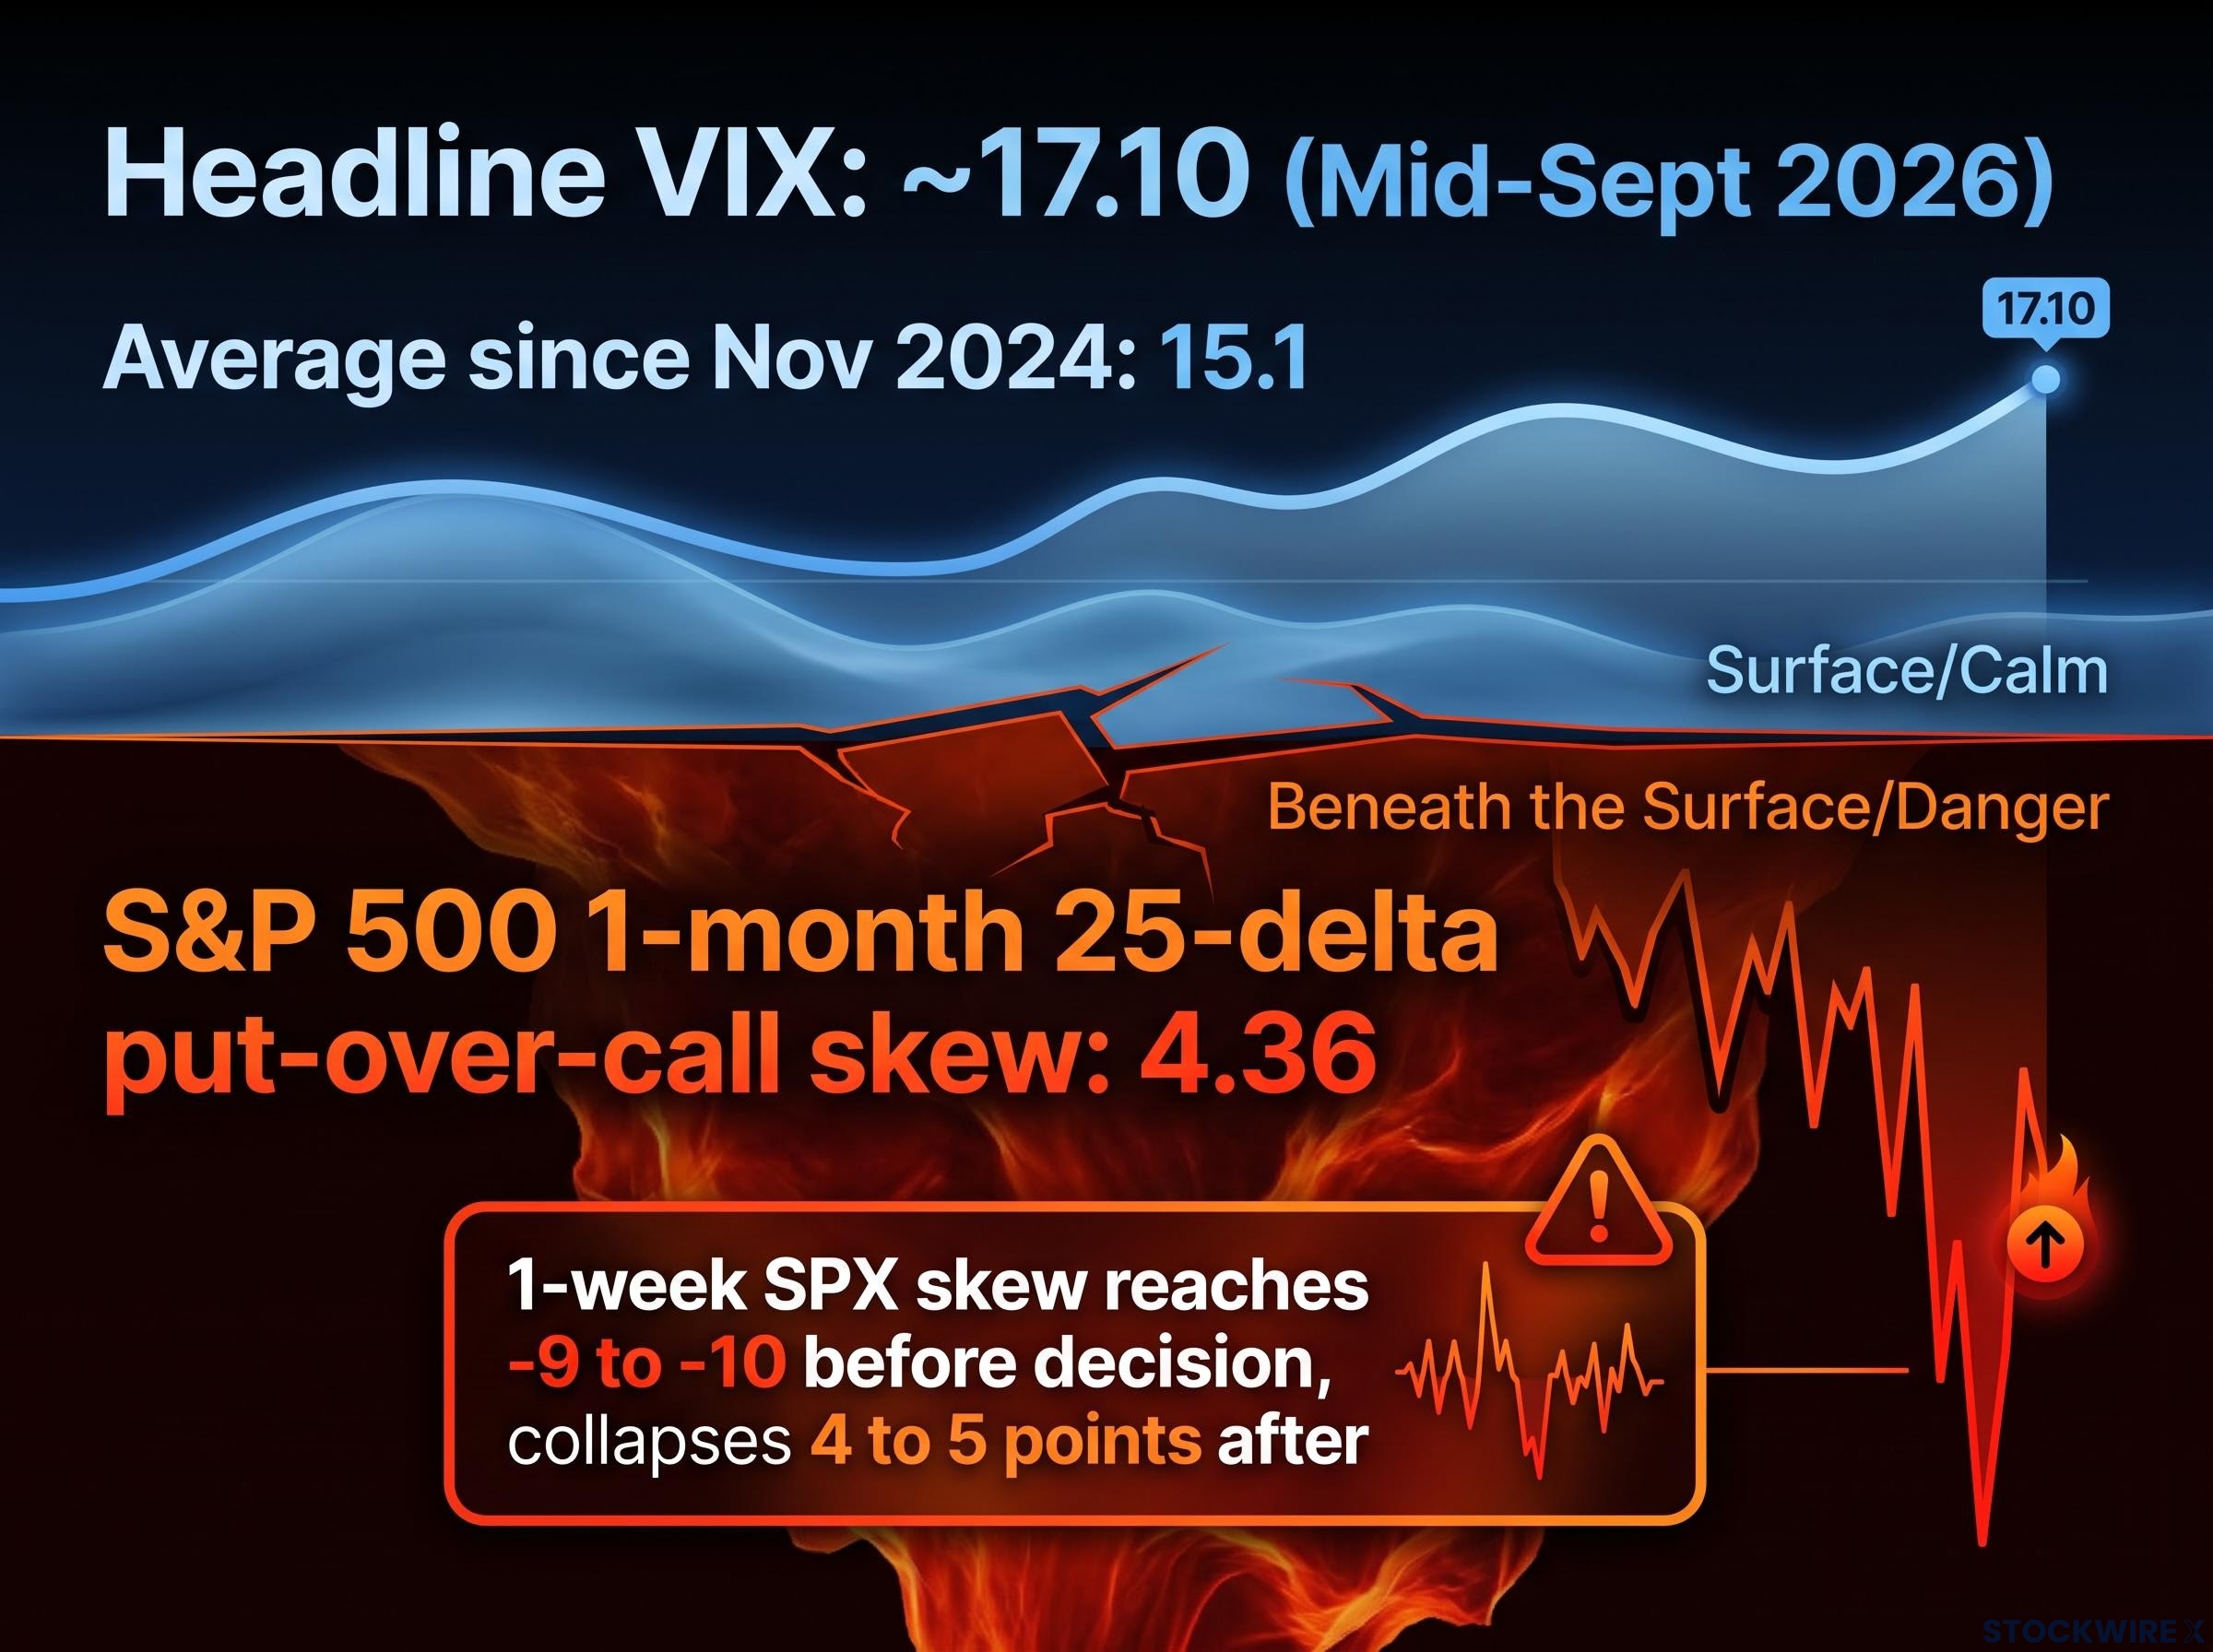
The academic evidence is blunt about why. Abnormal negative skewness and kurtosis in equity returns consistently intensify as FOMC dates approach. A one-week SPX skew can reach -9 to -10 volatility points before a decision, then collapse by 4 to 5 points once the event resolves.
Strategy backtests that short volatility two days before an FOMC meeting show a fat-tailed distribution. Average returns can be positive, but the severe losses cluster tightly around surprise decisions, hawkish pivots, and unexpected shifts in the dot-plot. Selling short-dated skew because it “looks rich” is not free carry. It is a premium for genuine event-driven tail risk.
The read you should take is this. When steep skew sits on top of a quiet VIX, the market is not offering you income. It is telling you where the danger is, and you do not want to be on the other side of that trade.
Building a resilient portfolio for high-density event weeks
Pull these threads together and a cycle emerges. Dealer hedging compresses volatility into the days before expiration, the pre-Fed drift adds a historical upward tilt, and then the whole structure resets the instant those positions expire and gamma flips.
Surviving that reset means positioning for expansion, not compression. Jim Carzon, founder of Kai Wealth, has suggested buying long January volatility calendars to position for the post-expiration environment, a way to own volatility precisely when the buffer disappears.
The broader discipline is simpler to state than to follow: respect the structural options flows rather than trading purely on the macro headline. The dot plot matters, but so does the hidden plumbing beneath it, and in a week like this the plumbing may matter more.
For investors wanting to translate the skew and VIX divergence into a specific hedging instrument, our dedicated guide to VIX calls versus SPX puts explains which structure fits each type of market decline, including how contango erodes long VIX call positions during slow selloffs.
This article is for informational purposes only and should not be considered financial advice. Investors should conduct their own research and consult with financial professionals before making investment decisions.
Past performance does not guarantee future results. These statements are speculative and subject to change based on market developments and market conditions.