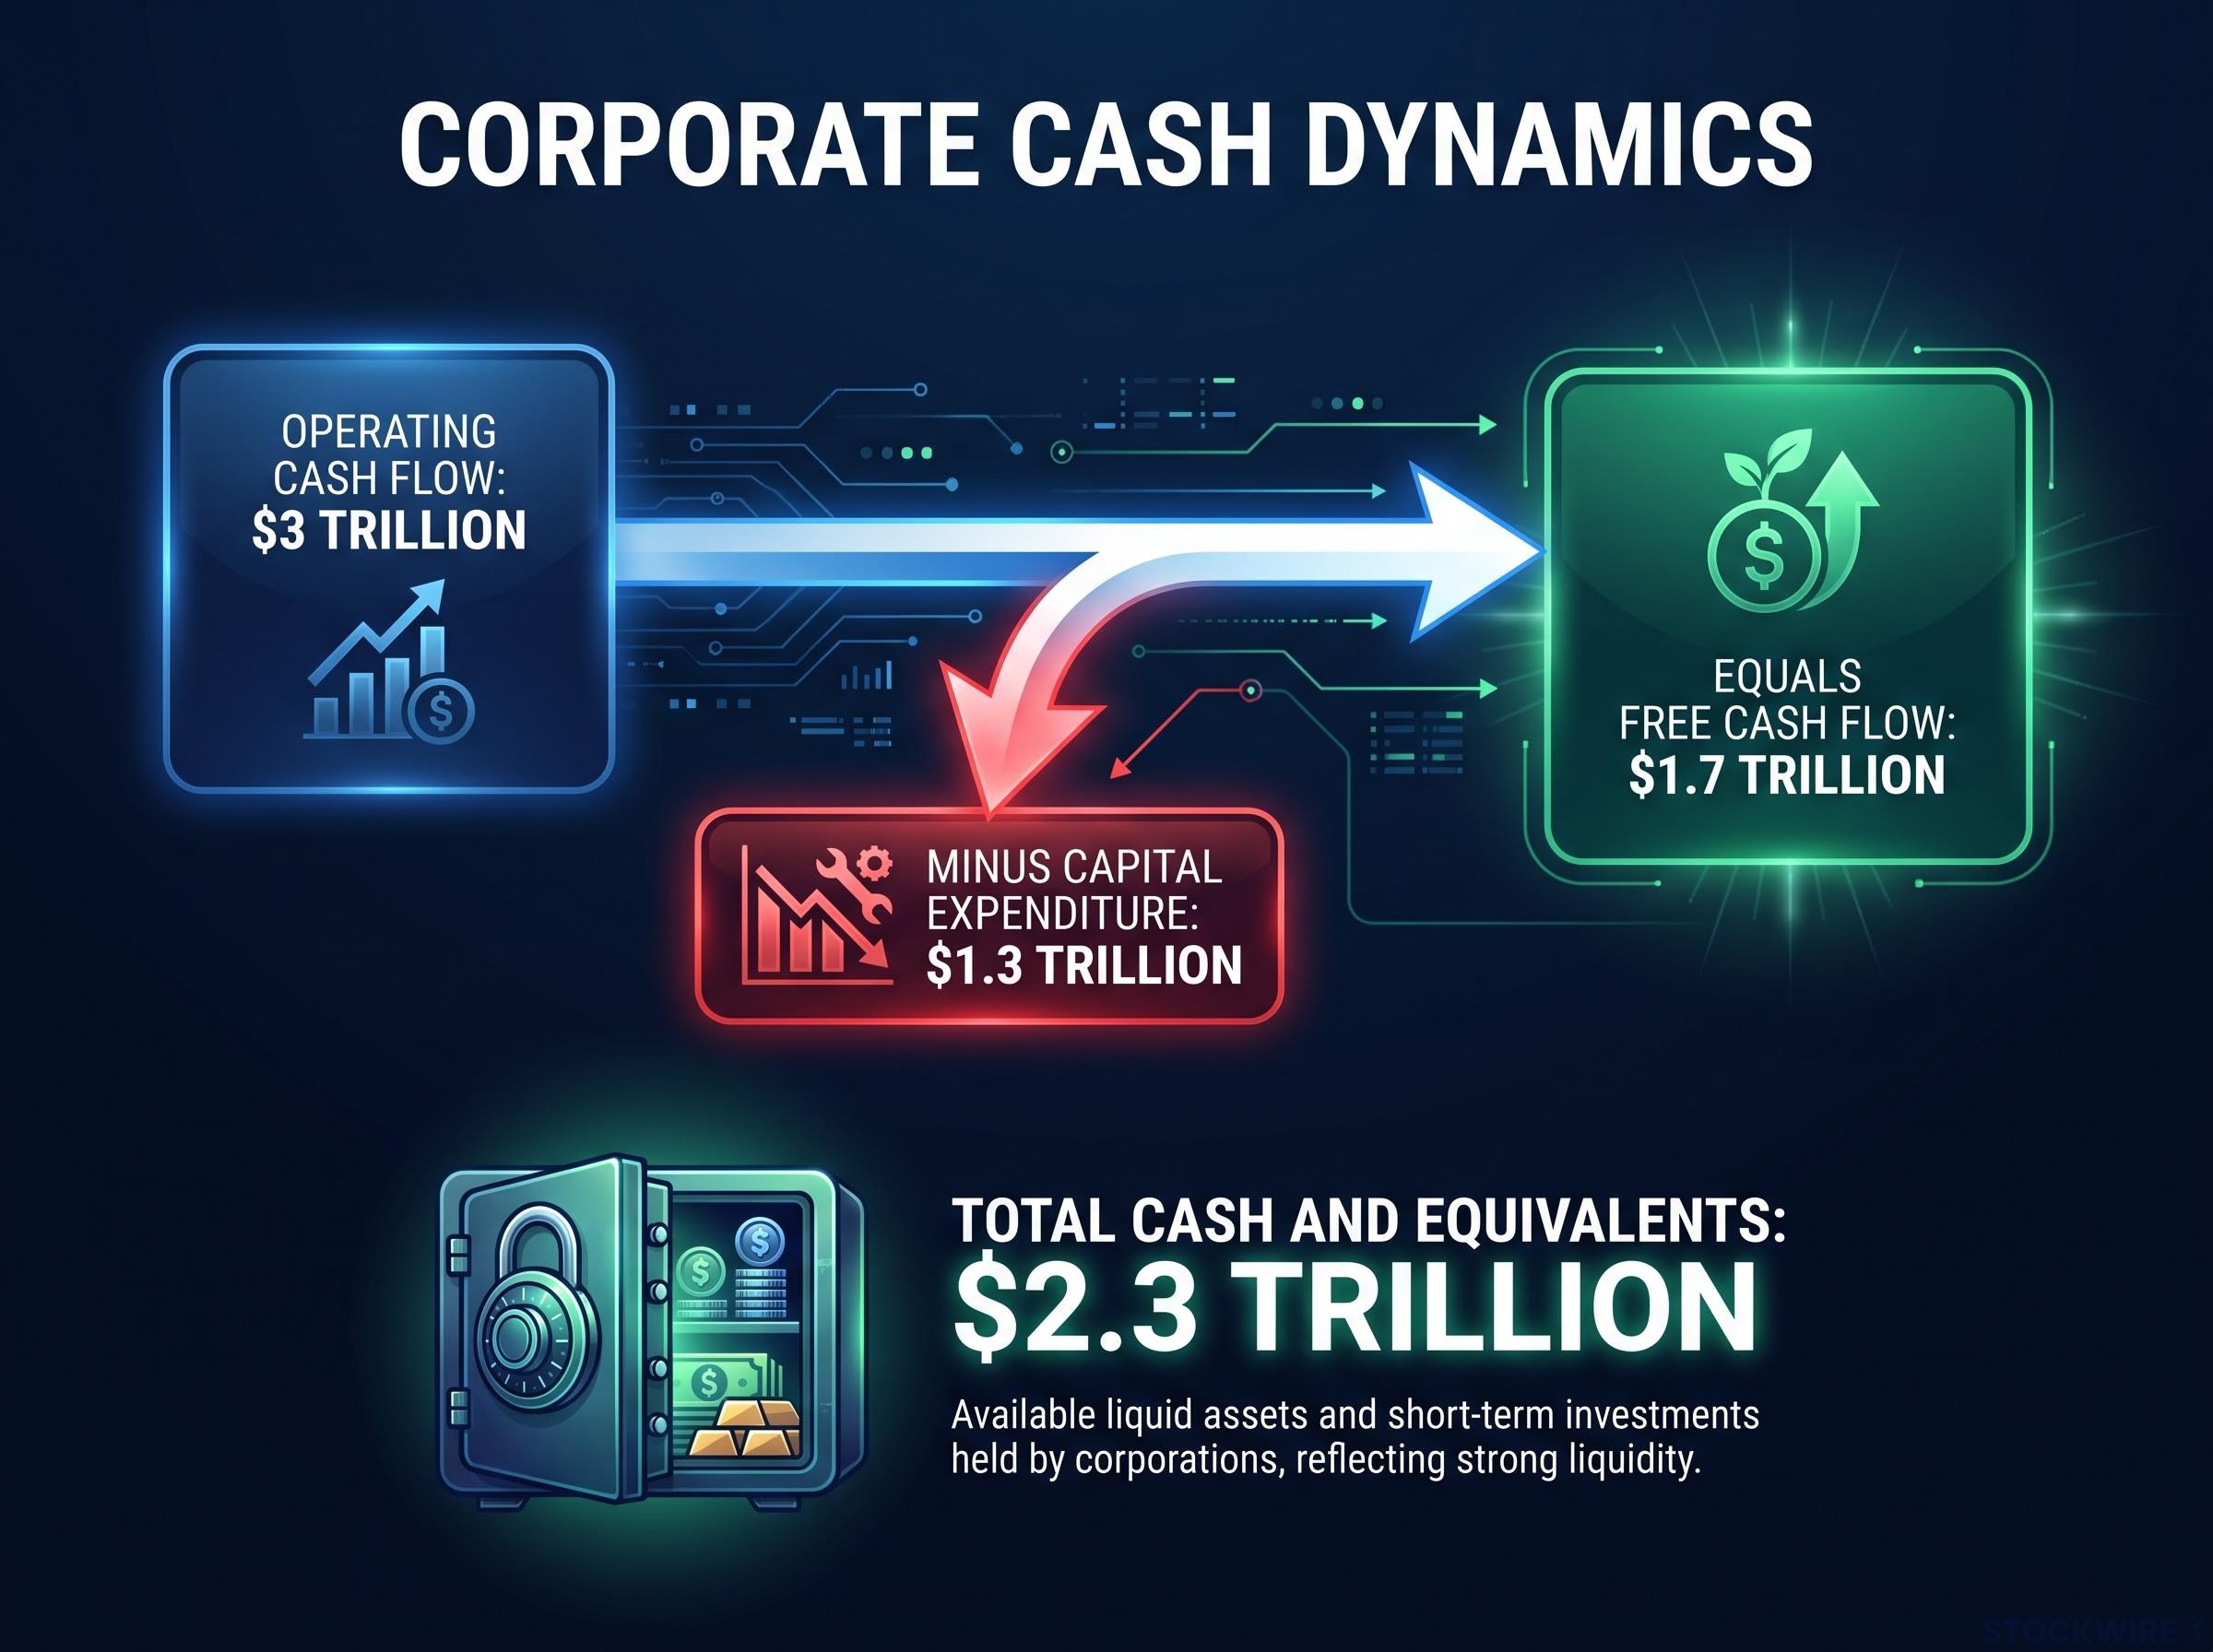
A company holding $2.3 trillion in cash, generating $3 trillion in operating cash flow, and sitting on $1.7 trillion in free cash flow should look like a bargain. It does not.
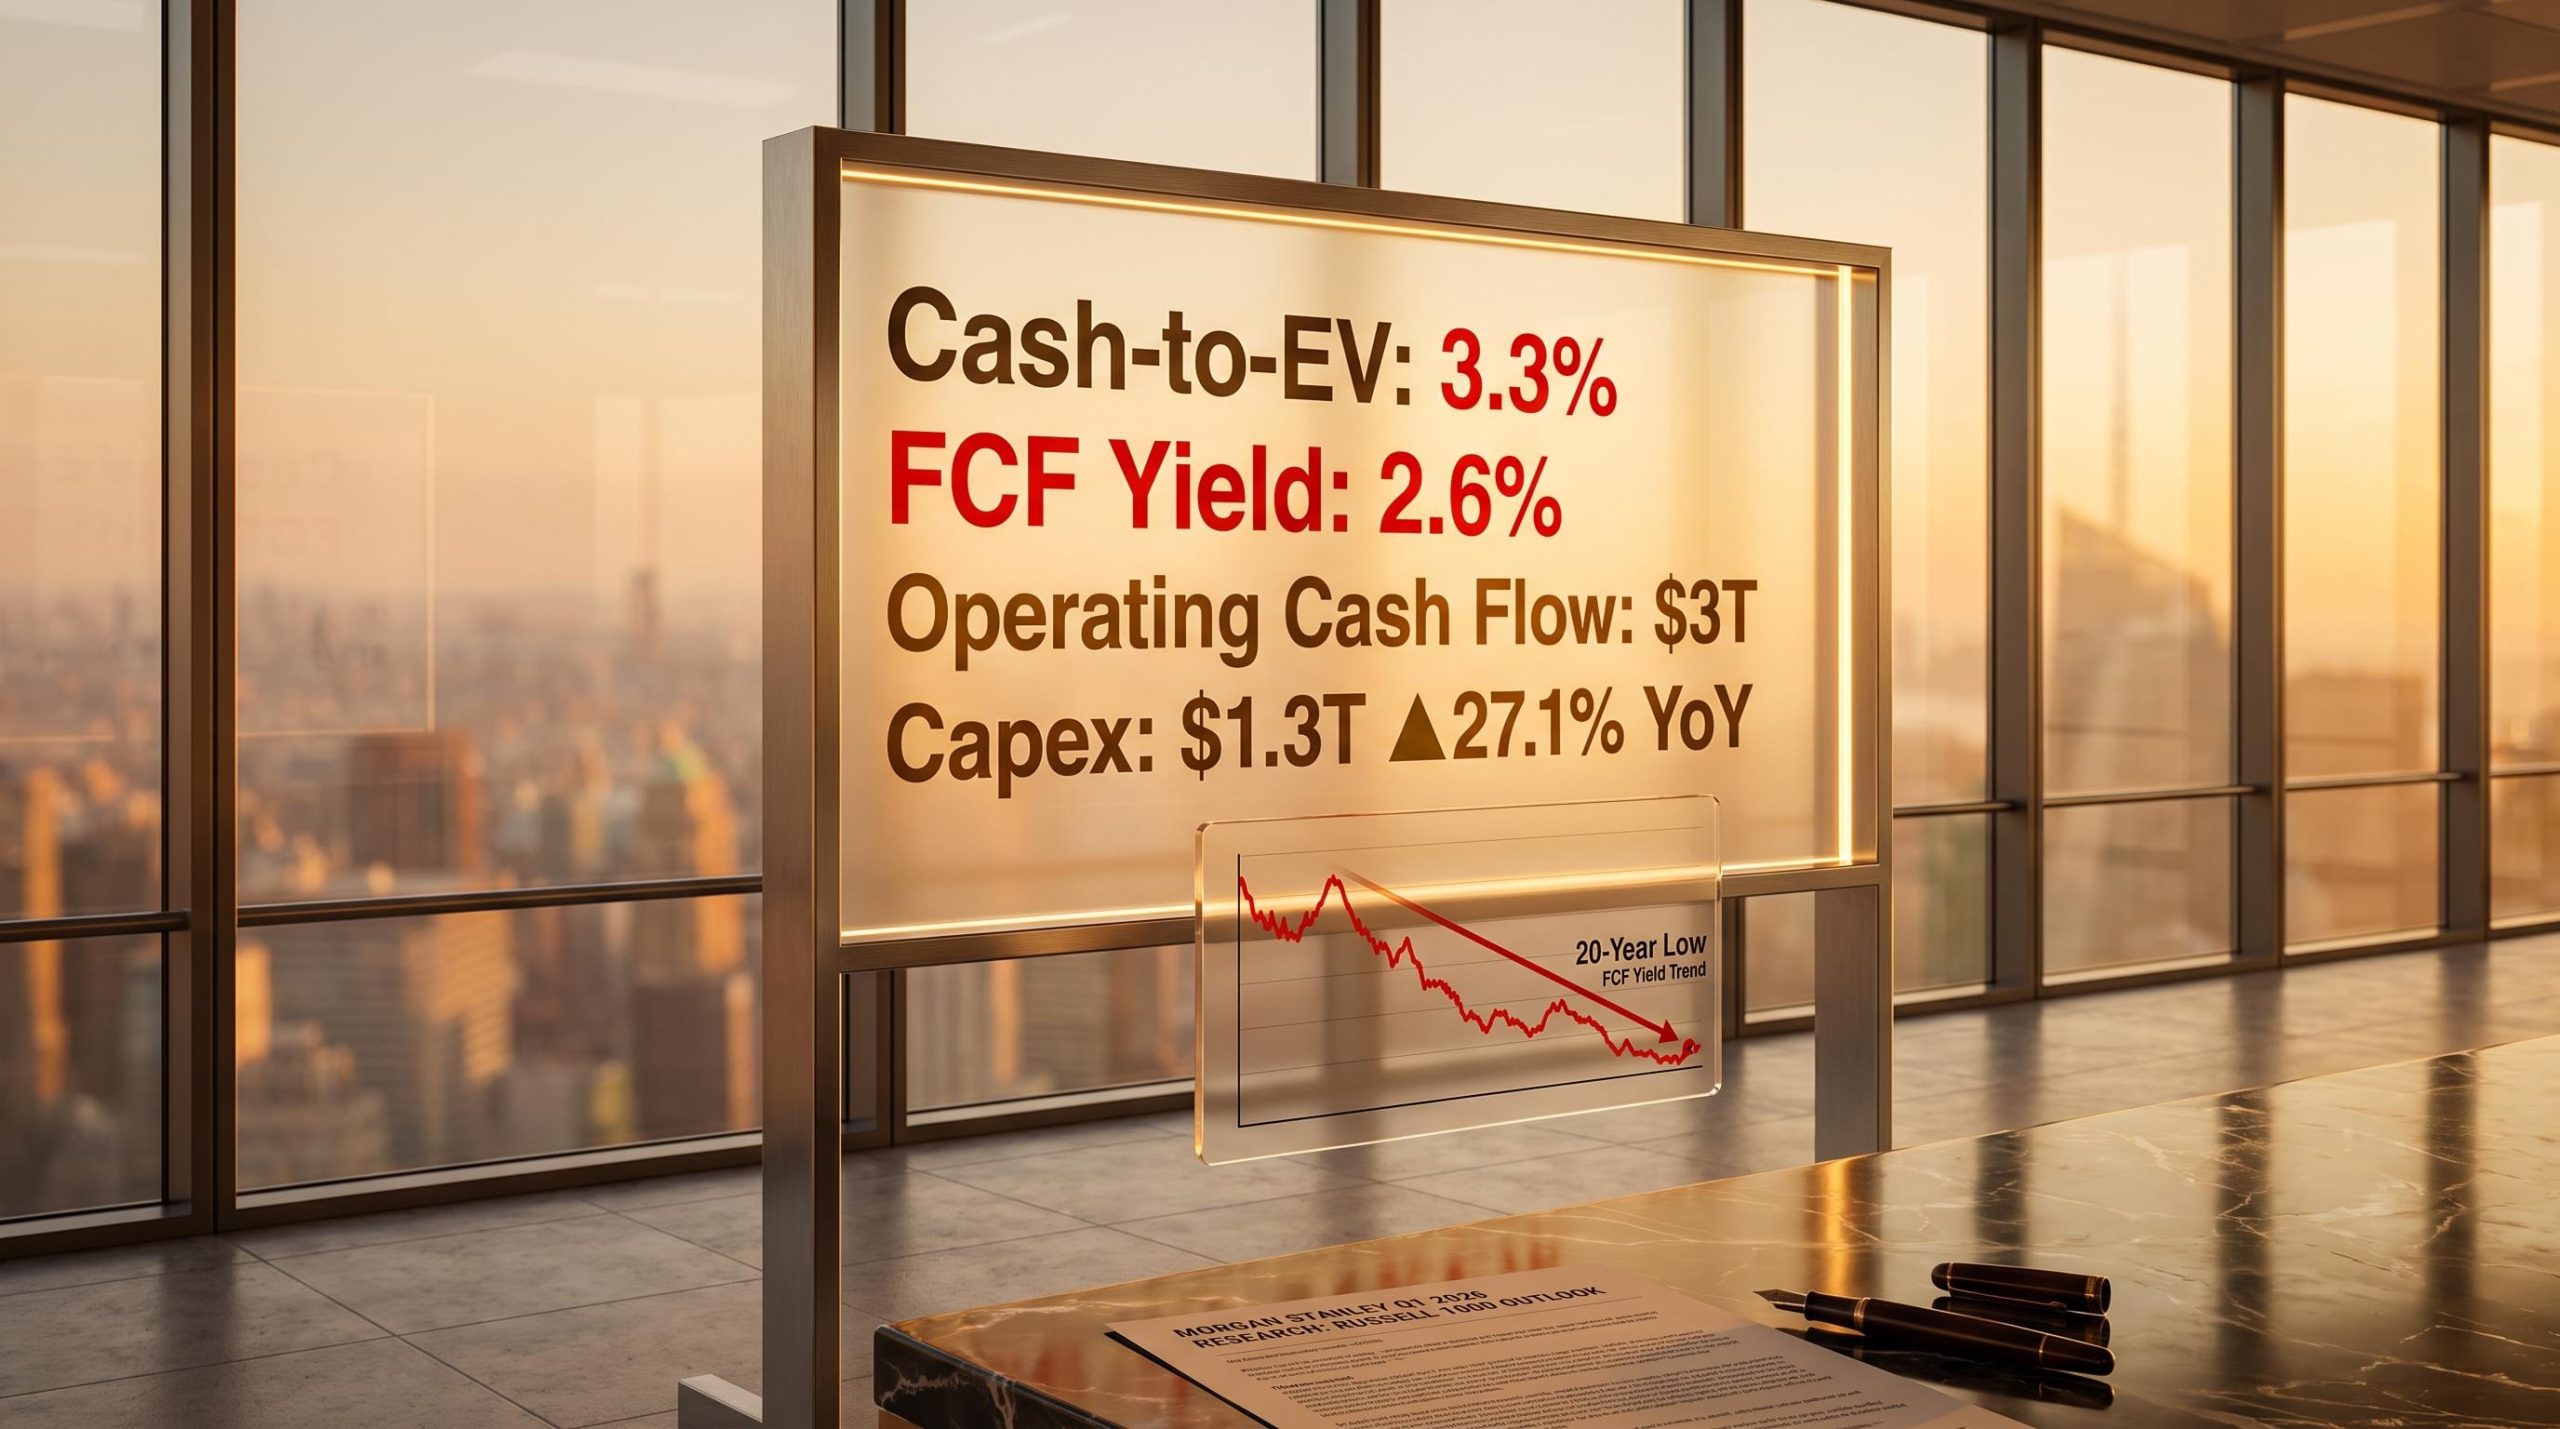
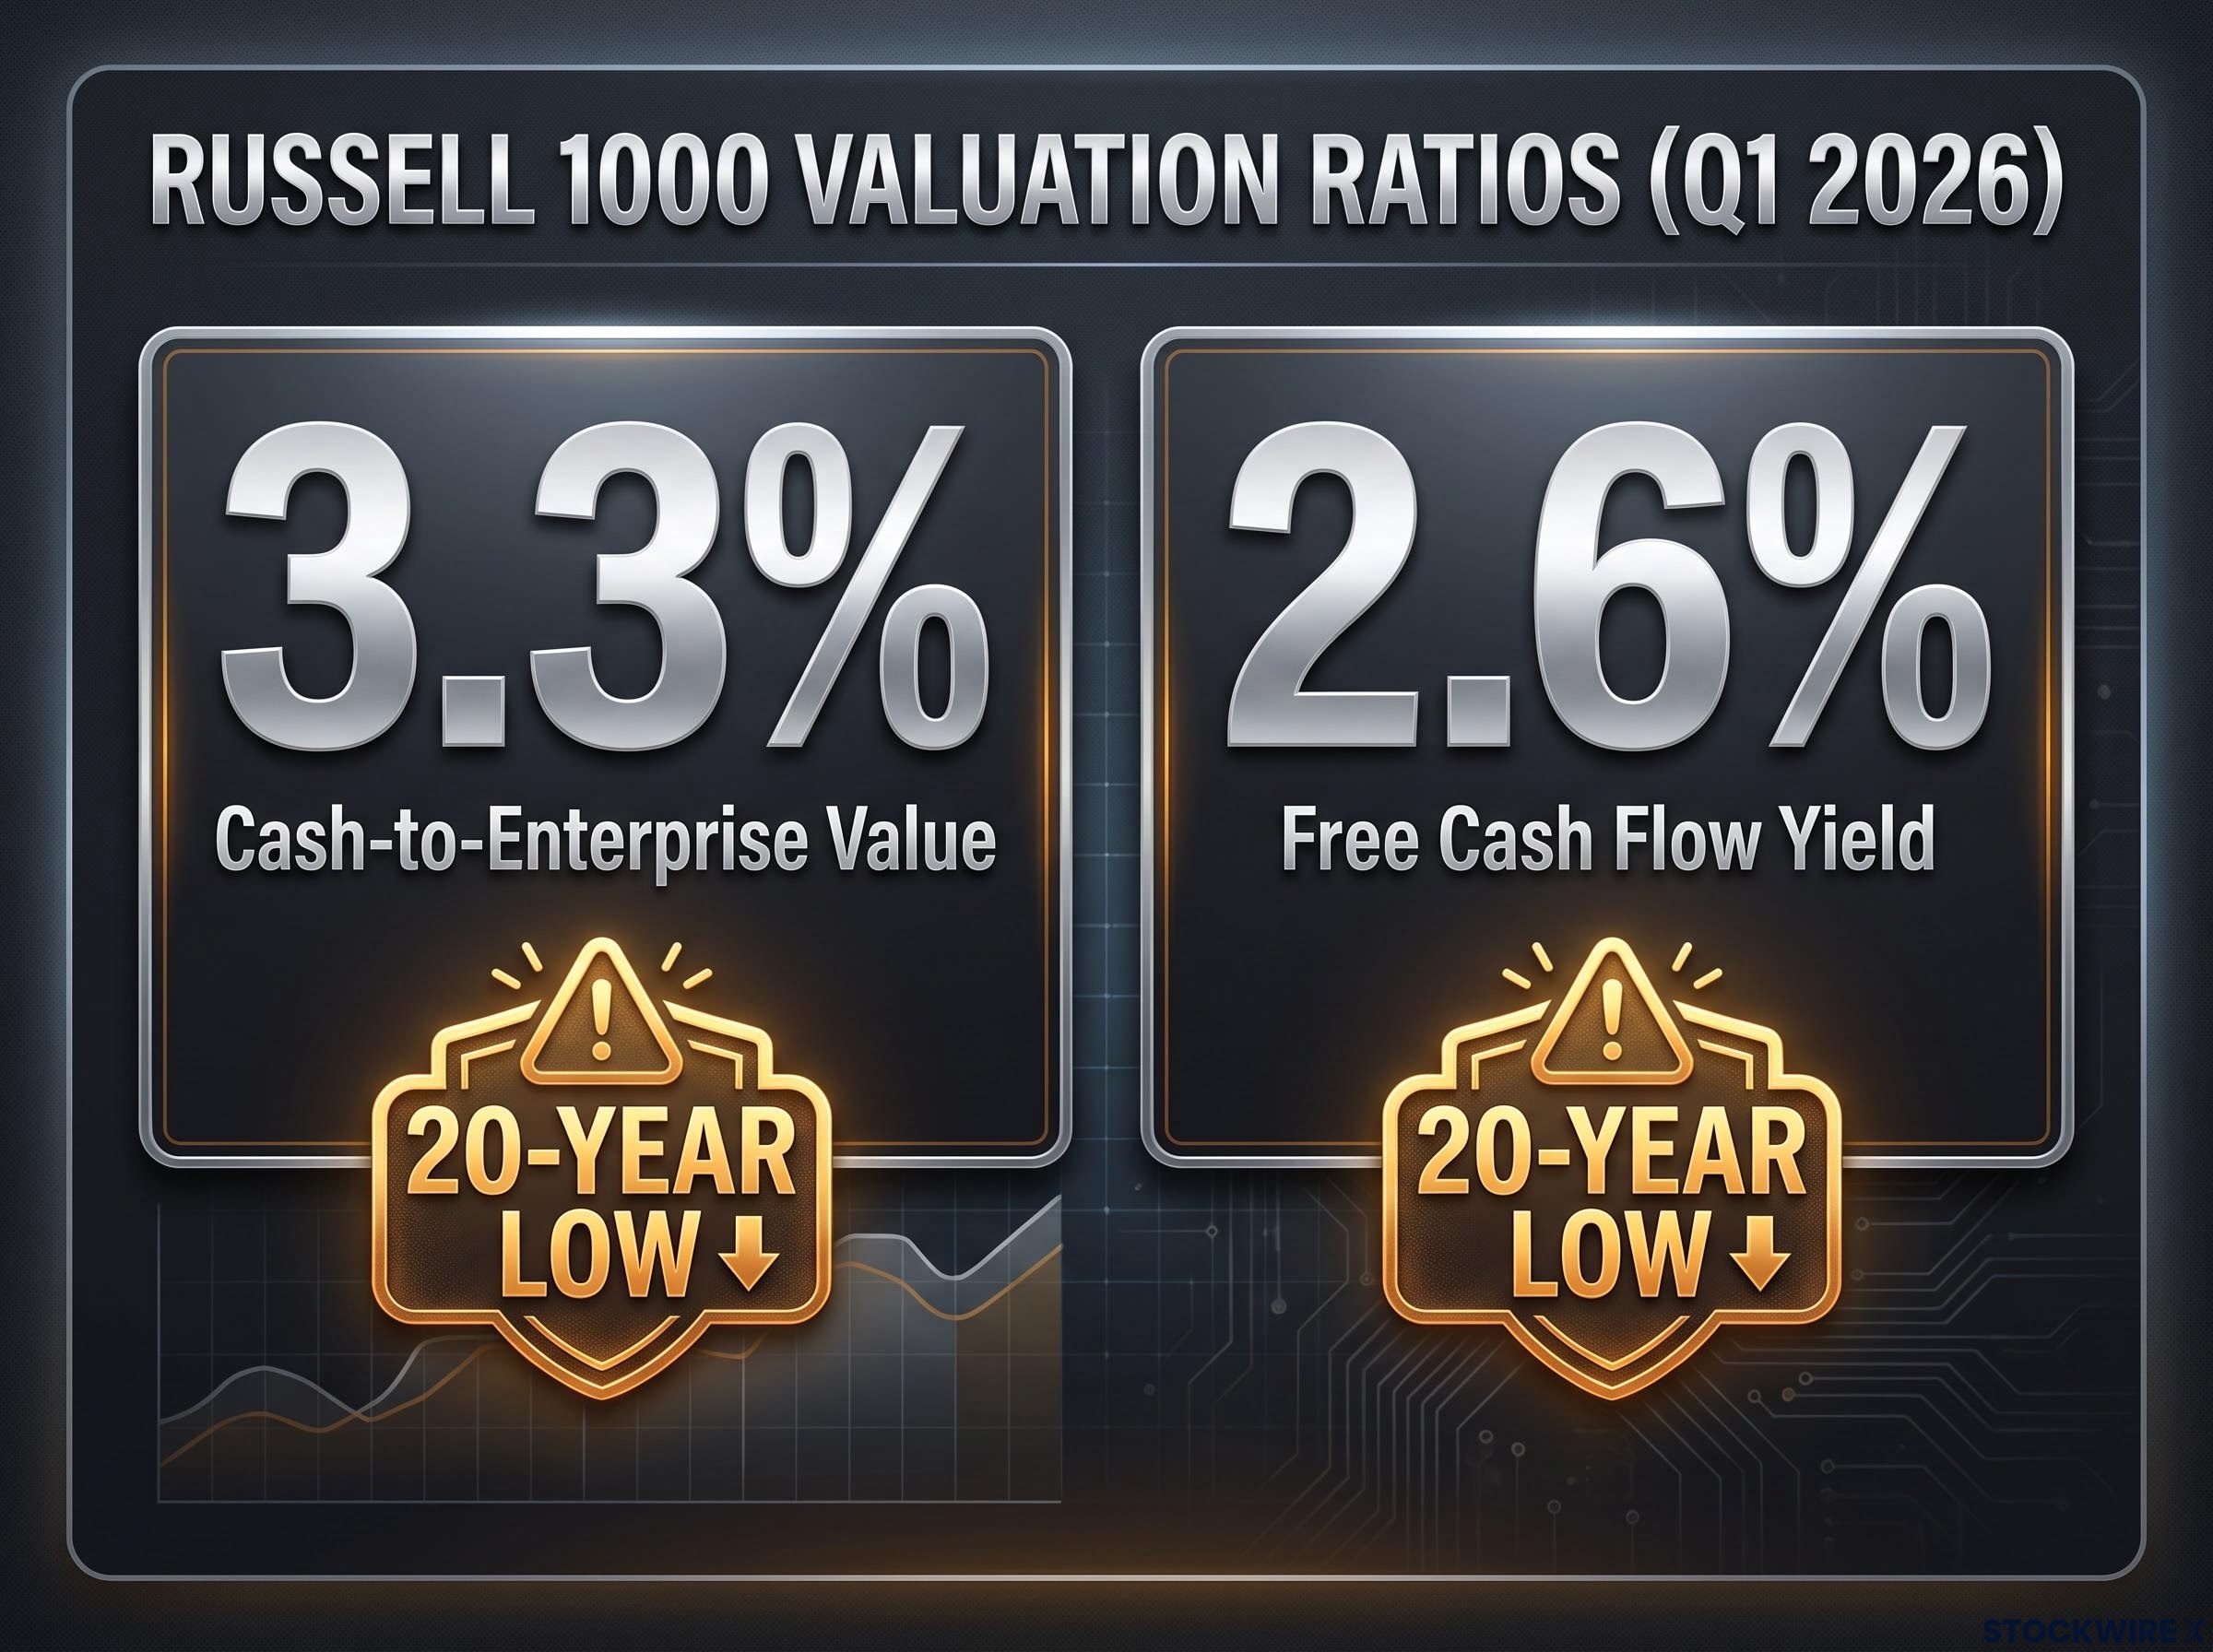
According to Morgan Stanley’s Q1 2026 analysis of Russell 1000 companies, the cash-to-enterprise value ratio just hit 3.3% and free cash flow yield sits at 2.6%. Both are 20-year lows.
The paradox is not a signal of corporate fragility. It is a signal of how aggressively markets have priced in future success, compressing the return metrics that typically give investors breathing room. At the same time, capex has surged 27.1% year-over-year to $1.3 trillion, redirecting the fruits of that cash generation toward AI infrastructure, reshoring, and energy transition. Understanding what these converging signals mean requires separating the story of corporate health from the story of equity valuation.
Here is the framework for reading these compressed ratios accurately, understanding what is actually driving the 20-year lows, and identifying where the real risks and opportunities sit heading into the second half of 2026.
Record cash, record capex, and ratios at 20-year lows: how all three are true at once
Start with the raw numbers from Morgan Stanley’s Todd Castagno and team, because none of them individually suggest a problem:
- Cash and equivalents: $2.3 trillion
- Operating cash flow: $3 trillion
- Free cash flow: $1.7 trillion
- Capital expenditure: $1.3 trillion, up 27.1% year-over-year
- Cash-to-enterprise value ratio: 3.3% (20-year low)
- Free cash flow yield: 2.6% (20-year low)
The first four numbers describe a corporate sector generating and deploying cash at record levels. The last two describe a market that has priced those same companies so aggressively that the cash backing each dollar of enterprise value has never been thinner.
Only 3.3 cents of every $1 of enterprise value is backed by cash.
That is the mechanism. Enterprise values, driven by surging market capitalisations, have risen faster than the underlying cash metrics. The ratios are at 20-year lows not because fundamentals have deteriorated but because equity prices have outrun them. Getting the causation right matters: these ratio lows are a precise measurement of how much optimism is now embedded in equity prices, not a warning about corporate balance sheets.
When big ASX news breaks, our subscribers know first
What cash-to-EV and FCF yield actually measure (and why 20-year lows mean what they mean)
Cash-to-enterprise value measures the proportion of a company’s total value (equity plus debt, minus cash) that is backed by cash on the balance sheet. Think of it as a margin-of-safety buffer: when it is high, a larger share of the price you are paying is supported by actual cash sitting in corporate accounts. When it is low, more of the price rests on expectations of future performance.
Free cash flow yield (FCF yield) is the cash-flow-based return an investor receives relative to the market value of the equity. It functions similarly to a dividend yield, except it captures all the cash a company generates after covering its capital expenditure, whether that cash is returned to shareholders or reinvested.
| Ratio | Current Level | 20-Year Context | What It Signals |
|---|---|---|---|
| Cash-to-EV | 3.3% | 20-year low for Russell 1000 | Minimal balance-sheet cushion relative to how much the market is pricing in |
| FCF Yield | 2.6% | 20-year low for Russell 1000 | Cash-flow return on equity is compressed against still-elevated risk-free alternatives |
Both ratios compress when equity valuations rise faster than fundamentals, even when fundamentals are improving. That is precisely the situation the Russell 1000 faces in mid-2026.
The discount-rate channel is the mechanical link between still-elevated Treasury yields and compressed equity multiples: as the risk-free rate rises, the present value of every future cash flow falls, shrinking price-to-earnings ratios even when corporate earnings themselves are unchanged.
The equity risk premium problem hiding inside FCF yield
FCF yield functions as a rough proxy for the return equity investors are accepting relative to alternatives. At 2.6%, with the 10-year Treasury yield still elevated, the spread between what equities offer in cash-flow terms and what risk-free government bonds offer has narrowed to historically thin levels.
What this tells you is straightforward: the market is not offering a meaningful premium for taking on equity risk over safe alternatives. That does not guarantee a correction, but it means precision in execution matters more than at any point in the last two decades, because the cushion for being wrong has rarely been smaller.
The equity risk premium framework makes this compression legible in quantitative terms: at a 4.24% implied ERP for the S&P 500, the spread between what equities offer in forward return terms and what risk-free Treasuries pay has narrowed to levels that historically produce modest one-year forward returns and only moderate five-year outcomes.
The capex surge: where $1.3 trillion is going and what it is betting on
The $1.3 trillion in capital expenditure, up 27.1% year-over-year, is not broad-based corporate spending. It is concentrated in three structural themes:
- AI infrastructure and data centres: The single largest destination, driven by hyperscaler build-out and enterprise adoption
- Domestic manufacturing and reshoring: Accelerated by supply-chain realignment and policy incentives for onshore production
- Energy transition and grid upgrades: Power generation and transmission capacity required to support both industrial reshoring and data-centre demand
This marks a clear break from the 2010s pattern. In that era, low growth and low interest rates encouraged management teams to return capital aggressively through buybacks and dividends. Today, according to Morgan Stanley’s analysis, management teams are, at the margin, favouring growth investments over capital returns. They are betting that AI, manufacturing, and energy infrastructure will generate returns above their cost of capital.
The scale of the AI investment boom puts the $1.3 trillion capex figure in macro context: US IT spending reached 4.9% of GDP in Q1 2026, surpassing both the dot-com era peak and the cloud build-out peak, with combined hyperscaler commitments for 2026 running between $600 billion and $805 billion before sovereign-scale projects are added.
If these projects earn returns above cost of capital, free cash flow can inflect higher from 2027 onward, providing retrospective justification for current valuations.
That forward-looking inflection is the capex bet in one sentence. It is simultaneously the most legitimate explanation for why valuations are stretched and the most significant source of downside risk if the investment thesis does not deliver on schedule. A 27.1% capex growth rate requires matching revenue and cash flow growth. If new capacity in AI, manufacturing, and energy underdelivers or runs over budget, FCF yields could compress further, and valuations become more exposed.
Why the balance sheet is not the concern here, but valuations are
The instinctive reading of 20-year-low ratios is financial stress. That reading is wrong here, and the data confirms it:
- Cash balances rose from Q4 2025 to Q1 2026 despite the capex surge
- $3 trillion in operating cash flow comfortably covers $1.3 trillion in capex, yielding $1.7 trillion in residual free cash flow
- The investment boom is internally funded, not debt-financed or reserve-depleting
The corporate sector is funding its own expansion entirely from internally generated cash flow. The balance sheet is not where the risk lives.
Morgan Stanley’s analysis indicates that market consensus expects margins to keep widening even as capital deployment continues at pace. That expectation is the key embedded assumption in current valuations.
The real concern is valuation sensitivity. When enterprise values have climbed to levels that compress cash-to-EV and FCF yield to 20-year lows, even moderate disappointments in earnings or cash flow growth can catalyse meaningful multiple compression. The vulnerability here is not the corporate sector running out of money. It is equity markets running out of patience if margin expansion expectations are not delivered on schedule.
What synchronised optimism at 20-year-low valuations means for stock selection in H2 2026
At 2.6% FCF yield and 3.3% cash-to-EV, the starting point for equity investors carries four specific implications:
- Higher valuation sensitivity to disappointments: Limited cushion means earnings misses, slower cash flow growth, or capex projects that under-earn can trigger outsized price reactions
- Sector dispersion matters more than index exposure: Index-level figures conceal significant differences. Mega-cap tech, utilities with data-centre exposure, and industrials tied to reshoring likely show the most compressed metrics, while other sectors may offer more room
- The margin expansion thesis is the central risk factor to monitor: Current valuations embed ongoing margin improvement. If Q2 and Q3 earnings show that assumption faltering, the gap between expectations and reality widens quickly
- Capital returns become a differentiation signal: With capex taking a larger share of cash, firms that balance disciplined reinvestment with consistent, well-covered buybacks and dividends may deserve a premium over those spending aggressively without clear return thresholds
| Scenario | Likely Outcome | Investor Implication |
|---|---|---|
| Capex delivers on time | FCF inflects higher from 2027, validating current multiples | Quality names with demonstrated capital discipline outperform; current valuations prove justified |
| Capex underdelivers | FCF yields compress further, multiple contraction accelerates | Index-level exposure penalised; firms without clear return thresholds face the sharpest de-ratings |
At these valuation levels, your edge comes from identifying which firms are deploying capital with demonstrated discipline and clear return thresholds, because the index will not bail out undiscriminating exposure. These compressed metrics are not a reason to exit equities categorically, but they are a precise argument for why stock selection and sector allocation carry more weight in the second half of 2026 than they did during the broader re-rating of 2023 to 2025.
What this environment actually rewards heading into the second half of the year
Corporate America is financially strong and capital-disciplined at the aggregate level. Operating cash flow of $3 trillion comfortably funds the investment boom and leaves $1.7 trillion in residual free cash flow. The balance sheet is not the problem.
The equity market is the constraint. It has priced in substantial future success, and 20-year lows in cash-to-EV and FCF yield are a precise measurement of how much of that optimism is already embedded. The alignment between investor confidence and management behaviour, both betting on AI-driven productivity, domestic industrial build-out, and higher nominal growth, is the source of both the opportunity and the risk.
Three specific variables deserve your attention in Q2 and Q3 2026 earnings:
- Wage and input cost trends: Any acceleration that pressures margins tests the core embedded assumption
- Early evidence of AI and infrastructure investment returning productivity gains: The capex thesis needs tangible operating leverage, not just capacity announcements
- The trajectory of FCF growth relative to capex commitments: This is the ratio that either validates or undermines the forward-looking case
The Morgan Stanley data does not argue for a market exit or a wholesale buy. It argues for the kind of precision that 20-year-low margins of safety demand. Lean into quality and capital discipline at the sector and stock level. Remain sceptical of broad index exposure as a substitute for fundamental analysis.
Valuation metrics like CAPE and FCF yield carry near-zero predictive power over one-to-three year horizons but strong explanatory power over 8-18 year horizons, a distinction that reframes the 20-year-low readings from short-term sell signals into long-run return expectations that investors should revise downward from 2010s norms.
This article is for informational purposes only and should not be considered financial advice. Investors should conduct their own research and consult with financial professionals before making investment decisions. Past performance does not guarantee future results. Financial projections are subject to market conditions and various risk factors.
—