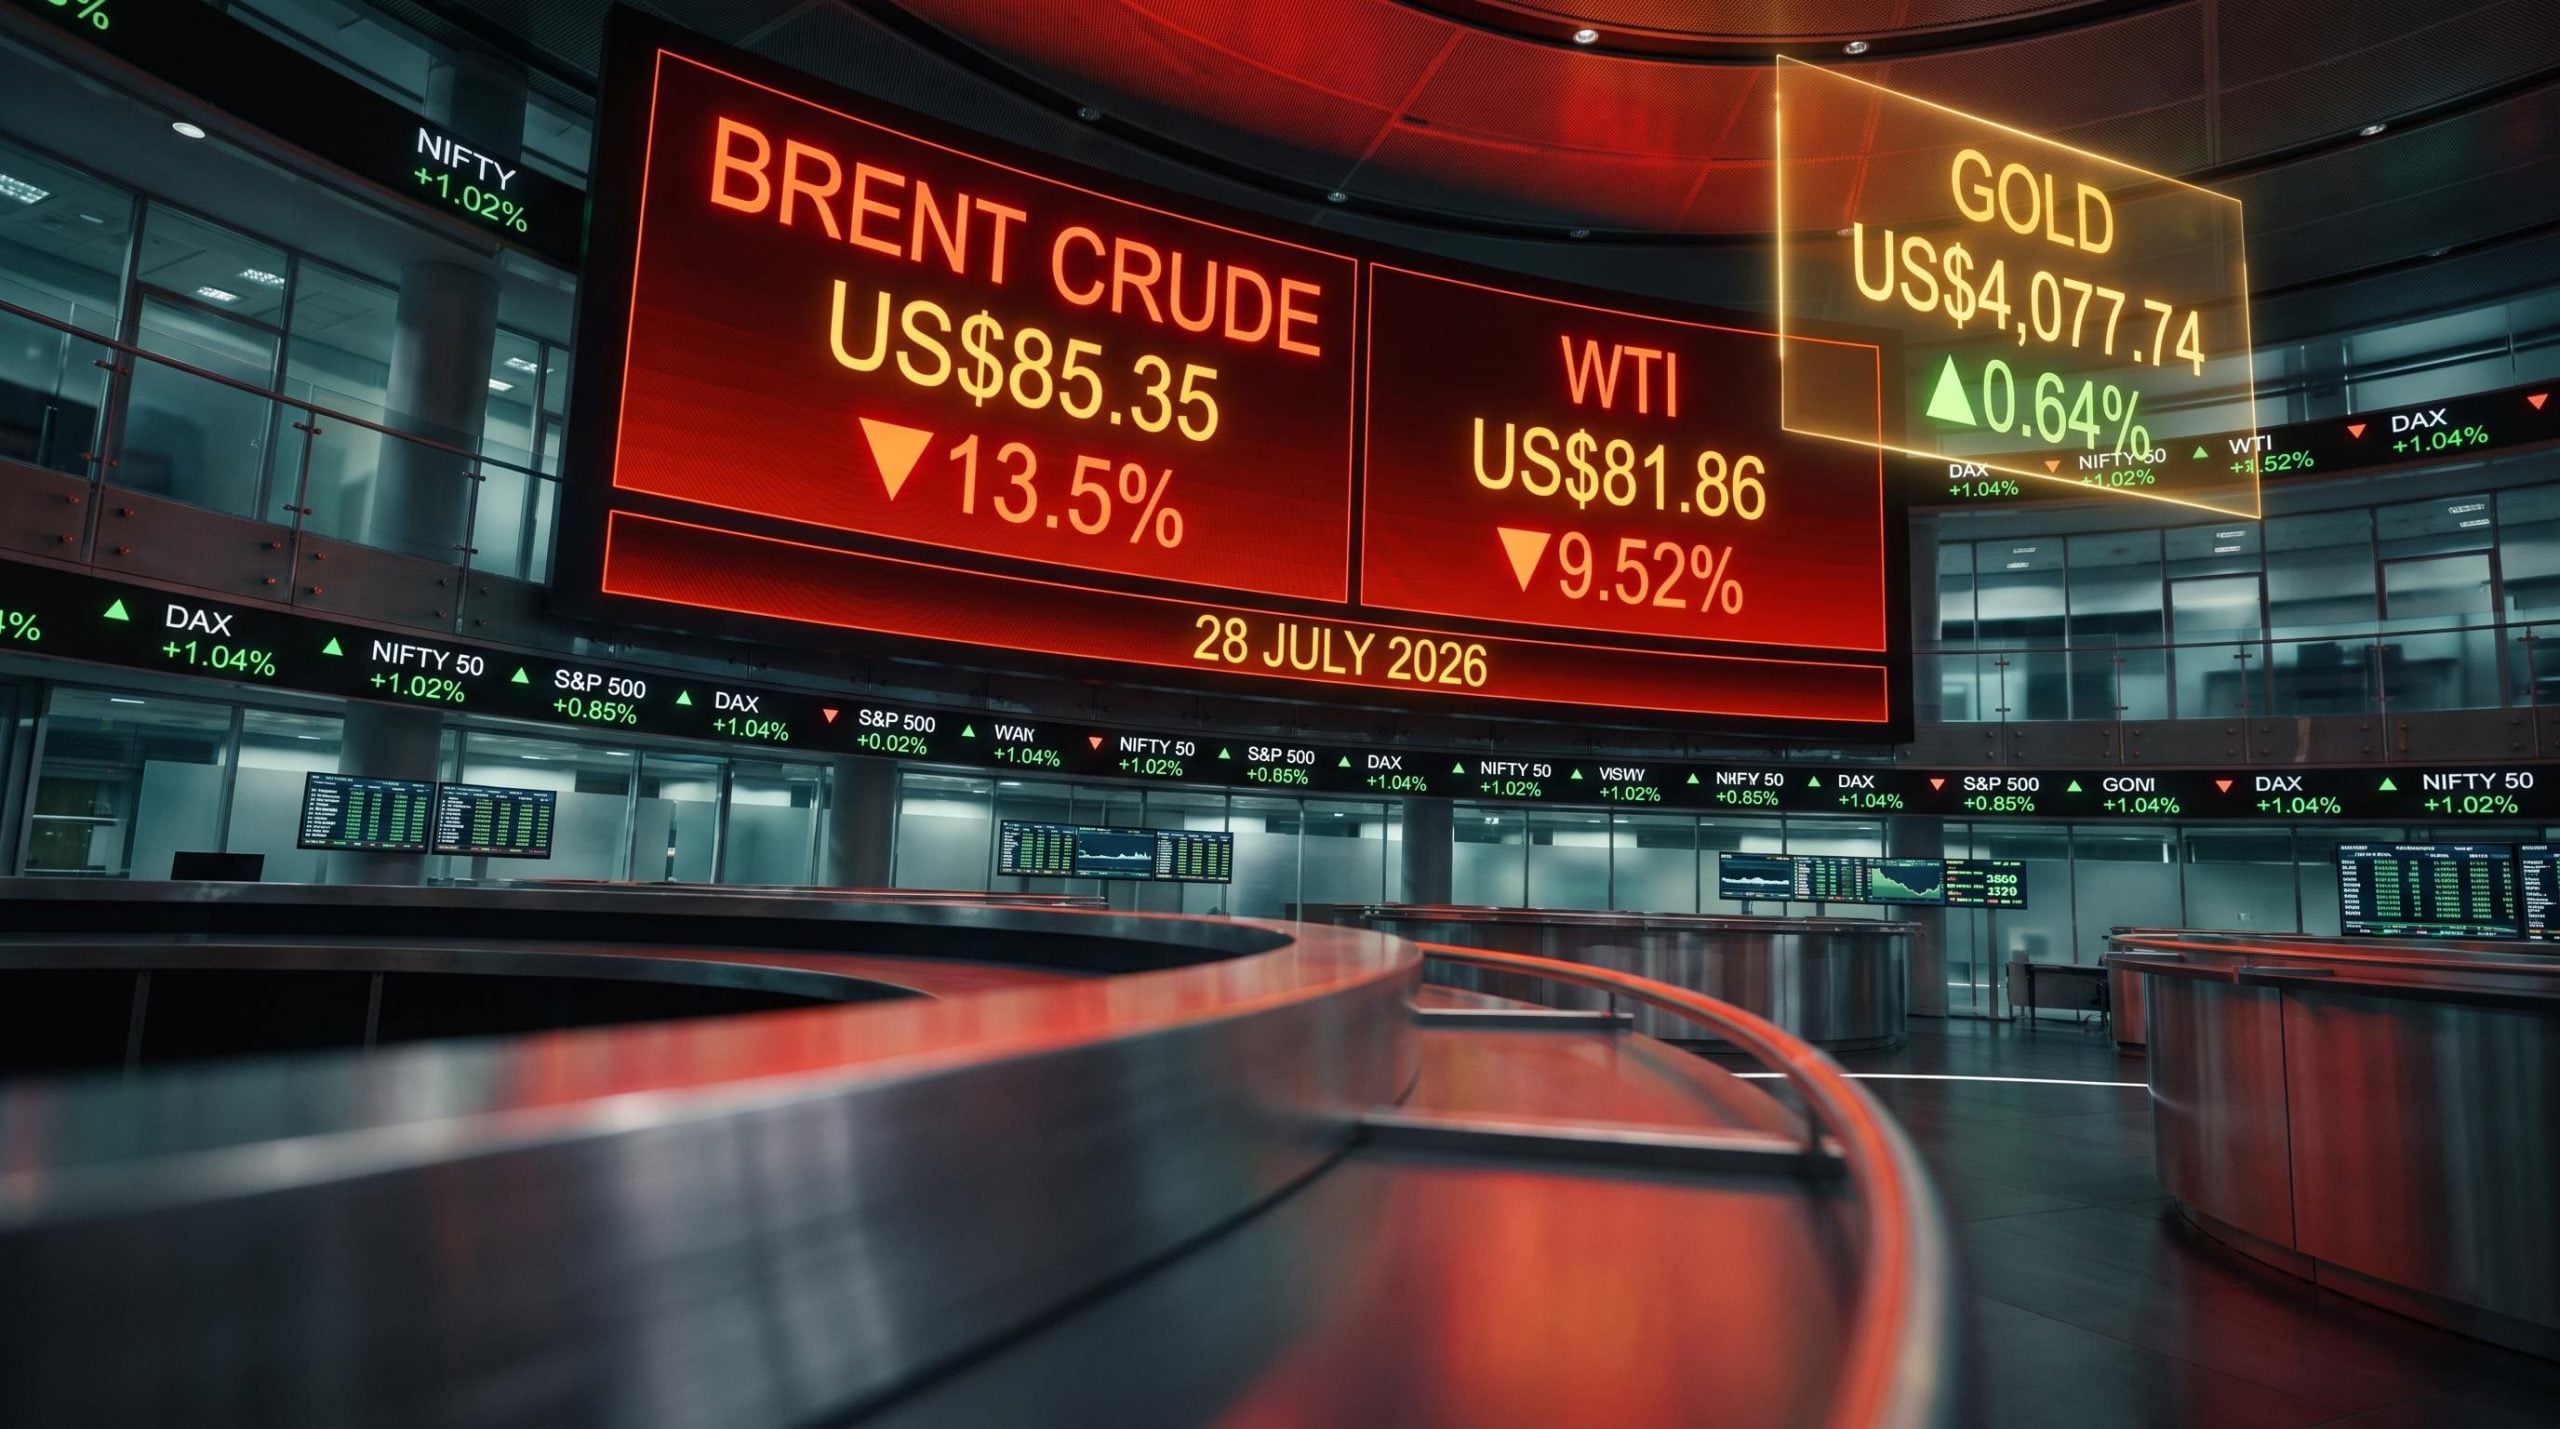
Brent crude fell 13.5% to US$85.35 per barrel on 28 July 2026, its sharpest single-session decline of the current US-Iran conflict cycle, after a third consecutive night passed without American military strikes on Iranian targets.
The move was not a response to new supply data or a demand shock. It was a risk premium unwind. Markets repriced the probability of a Strait of Hormuz disruption lower, and that single variable drove crude off a cliff. The distinction matters, because a premium that unwinds on diplomacy can rebuild just as fast if diplomacy fails.
Here is what the cross-asset data from this session actually tells you: where the relief went, where it did not, and what the divergences between oil, gold, equities, and rates reveal about how professional capital is positioning for what comes next.
Why oil fell 13.5% in a single session
Three consecutive nights without US strikes on Iran shifted the market’s probability estimate of near-term Hormuz disruption. That probability repricing, not any change in physical supply or demand, drove the sell-off.
- Brent crude: US$85.35/bbl, down 13.5%, session ending 28 July 2026
- WTI: US$81.86/bbl, down 9.52%, same session
- North Sea Dated crude fell approximately US$31/bbl across June to around US$68/bbl in early July when an interim ceasefire held, rebounded as hostilities resumed, and dropped sharply again on this renewed de-escalation
Brent crude fell 13.5% to US$85.35 per barrel on 28 July 2026, its sharpest single-session decline in the current conflict cycle.
Brent’s larger percentage decline reflects its greater sensitivity to seaborne Gulf flows and Hormuz disruption risk. WTI, priced off landlocked US benchmarks, carried less of the geopolitical premium to begin with and shed less on the unwind.
The 26 July session established the analytical template: when Brent fell 5.5% to US$91.44 on the initial US-Iran stand-down, the Hormuz risk premium compressed on sentiment rather than any confirmed improvement in physical supply, a dynamic that repeated with greater force two days later.
A move this large on a diplomatic pause, rather than an actual supply change, tells you exactly how much risk premium had been baked into crude. It also tells you how fast that premium can snap back if the diplomacy breaks down.
The EIA Strait of Hormuz analysis quantifies the strait as carrying approximately 20% of global petroleum liquids consumption and one-quarter of all maritime traded oil, figures that translate directly into the scale of risk premium that crude markets must price when passage is threatened.
When big ASX news breaks, our subscribers know first
The diplomatic architecture: why markets are relieved but not settled
The relief rally rests on three diplomatic tracks, each with a different degree of credibility and a different gap between public statements and observable progress.
- US-Iran bilateral framing: US officials have described talks as going well, with strikes paused. Tehran’s foreign ministry, speaking through spokesman Esmail Baghaei, rejected this framing, asserting that no talks with Washington are taking place and that Iran’s only formal engagement is with Oman on the question of Hormuz passage.
- Qatar-Pakistan mediation: According to two regional officials, a Qatar and Pakistan-led mediation effort has achieved meaningful progress in pushing the parties toward a temporary ceasefire arrangement. Qatar is confirmed as a key intermediary in the broader US-Israel-Iran diplomacy.
- Oman-Hormuz channel: Iran-Oman consultations remain focused on a mechanism for resuming shipping through the Strait of Hormuz. This is economically the most consequential track: a credible understanding not to restrict Hormuz traffic is the single most direct route to sustainably compressing the oil risk premium.
The gap between Washington’s characterisation (“going well”) and Tehran’s denial (“no direct negotiations”) is not just diplomatic posturing. It creates real scope for miscalculation, where one side’s domestic audience hears a message that the other side’s actions contradict, and that miscalculation is the fastest route to restarting the price move in reverse.
Regional flashpoints that remain live
Saudi Arabia’s defence ministry announced that it had shot down a number of drones originating from Iraq that were directed at oil facilities in both the Eastern Province and the Riyadh region.
This is not a footnote. The broader regional conflict has multiple actors and vectors beyond the direct US-Iran bilateral, and independent infrastructure incidents can rebuild the oil risk premium regardless of how the primary diplomatic track develops.
How geopolitical relief spreads across asset classes
The cross-asset response confirmed a broad relief trade, but one anomaly complicates the picture.
| Index | Level | Change |
|---|---|---|
| Shanghai Composite | 3,858 | +1.15% |
| DAX (Germany) | 25,361 | +1.04% |
| Nifty 50 (India) | 76,836 | +1.02% |
| Hang Seng (Hong Kong) | 25,207 | +0.98% |
| S&P/TSX (Canada) | 35,568 | +0.56% |
| Nikkei 225 (Japan) | 64,931 | +0.50% |
| FTSE 100 (UK) | 10,782 | +0.42% |
Oil-importing economies led the rally. Shanghai, the DAX, and the Nifty 50 all gained more than 1%, the mechanically expected beneficiaries of lower crude input costs and improved terms of trade. Copper climbed to US$6.35, up 0.73%, as cheaper energy improved industrial margins, particularly for China.
The US 10-year Treasury yield eased to 4.641%, down 0.81%, retreating from a one-and-a-half-year high. The oil pullback compresses the inflation premium tied to energy costs, but the structural term premium reflecting fiscal concerns is not moving.
Then there is gold.
Gold rose to US$4,077.74, up 0.64%, even as Brent crude collapsed 13.5%. The market is not treating this ceasefire as permanent.
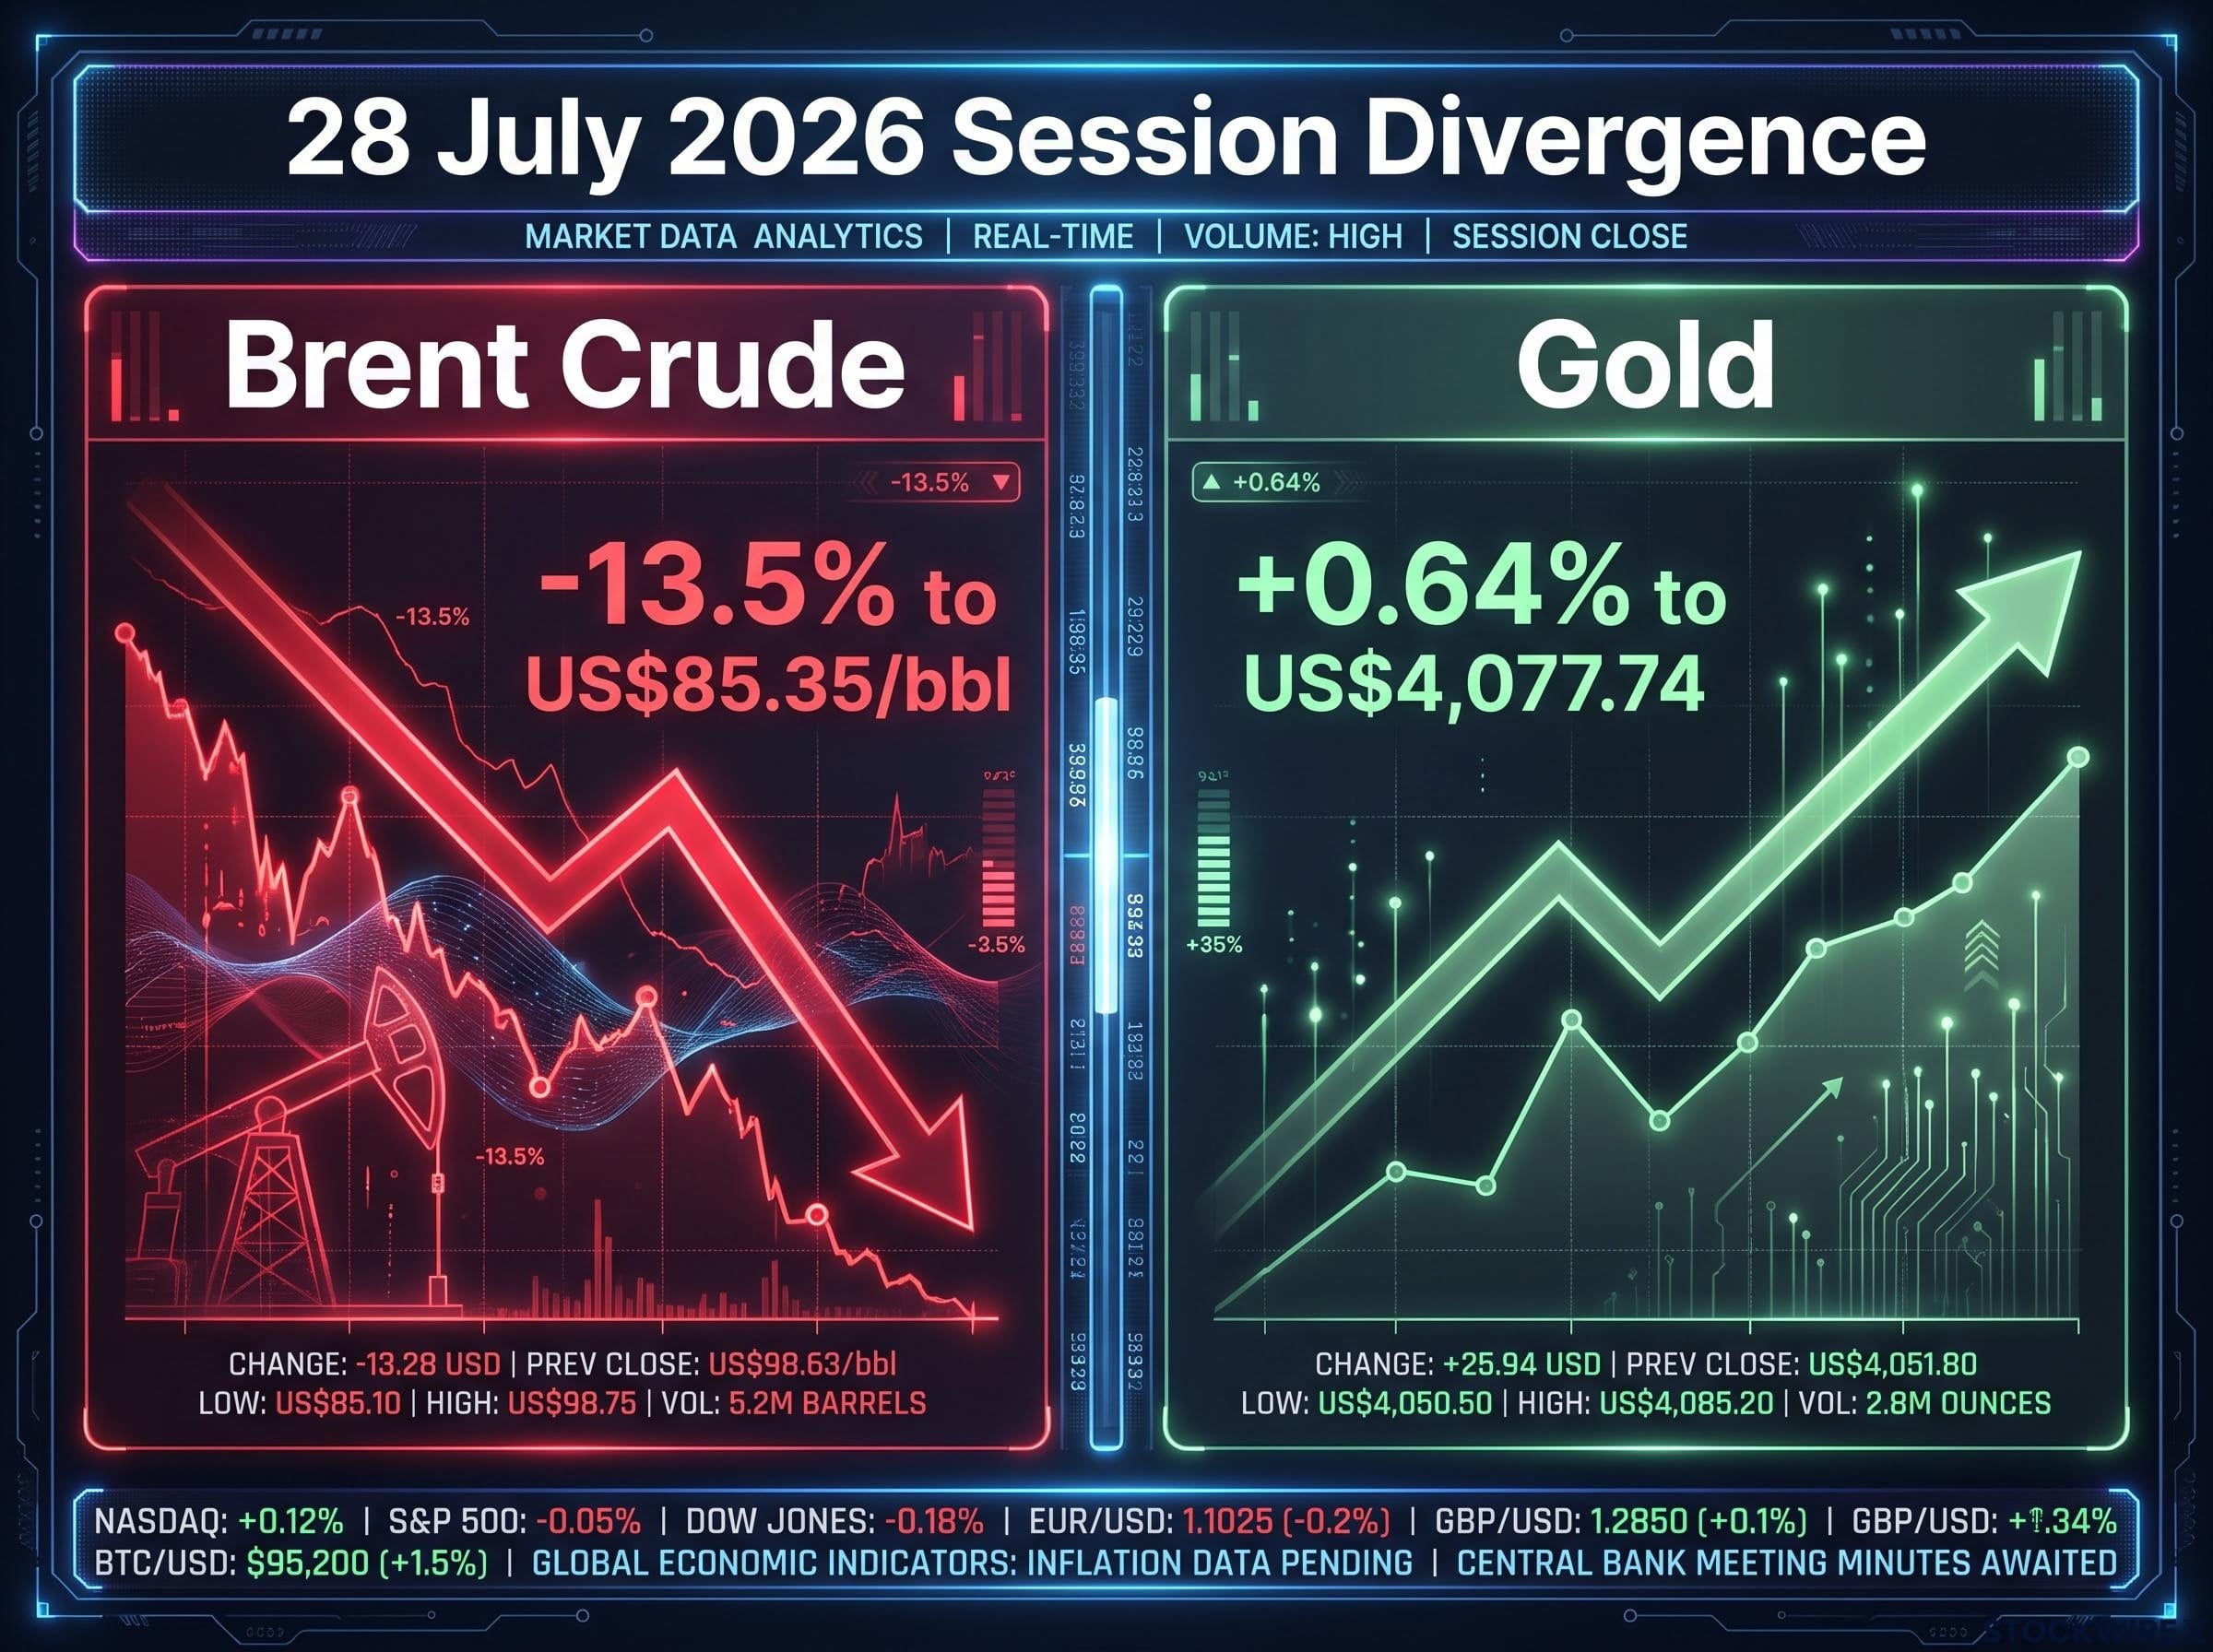
Gold rising alongside collapsing oil is the session’s most analytically significant data point. In a clean de-escalation, gold should sell off as the geopolitical hedge loses its rationale. It did not. That tells you professional positioning reflects a durable belief this ceasefire is temporary, supported independently by structural fiscal and monetary concerns that have nothing to do with the Strait of Hormuz.
The IEA projects a two-year risk premium recovery timeline even under a best-case resolution scenario, a structural forecast that directly explains why gold is not selling off and why professional positioning reflects scepticism about ceasefire permanence rather than optimism about a clean de-escalation.
Inside the US equity session: a rotation, not a rally
Seven of eleven S&P 500 sectors closed positive, but the distribution tells you more than the headline number.
| Sector | Session Performance |
|---|---|
| Consumer Staples | +1.58% |
| Communication Services | +1.46% |
| Financials | +1.00% |
| Consumer Discretionary | +0.77% |
| Health Care | +0.52% |
| Industrials | +0.32% |
| Materials | +0.26% |
| Real Estate | -0.49% |
| Information Technology | -0.97% |
| Utilities | -1.33% |
| Energy | -2.01% |
- Consumer Staples (+1.58%) and Communication Services (+1.46%) led the session, a defensive, quality-biased tilt, not the high-beta growth leadership you would expect in a genuine risk-on day.
- Energy (-2.01%) was the worst performer, directly weighed by the crude price collapse.
- Information Technology (-0.97%) lagged alongside still-elevated yields; high-duration assets remain pressured by rates that have only partially eased.
The sector distribution tells you this is a lower-oil, still-elevated-yield environment being priced cautiously. Capital rotated selectively, not broadly, which means positioning accordingly requires staying selective rather than adding broad market beta.
What a return to hostilities would mean for your portfolio
The additional upside from the ceasefire simply muddling through is modest; crude drifts lower, import-heavy equities grind higher, yields ease marginally. The downside if diplomacy fails is larger and faster.
- Oil: A credible return to hostilities with Hormuz risk would likely retrace the recent 10-13% drop rapidly and overshoot as traders rebuild the premium. The speed of this session’s unwind is the benchmark for how fast the reverse move could occur.
- Equities: Import-heavy economies (the eurozone, India, China, Japan) are most exposed via energy input cost pass-through. Within US equities, Energy would outperform while growth and tech stocks would face higher discount rates in a stagflationary shock.
- Gold: Would likely rally strongly, combining geopolitical and inflation hedging demand. Gold’s refusal to sell off during this relief rally already illustrates that positioning reflects a durable belief in ceasefire temporariness.
- Treasuries: The net direction depends on whether the inflation shock (upward pressure on yields) or flight-to-safety demand (downward pressure) dominates. In acute stress, the safe-haven bid typically wins initially.
The asymmetry argument for maintaining hedges
Gold’s behaviour, the speed of the oil move, and the fragile diplomatic architecture all point in the same direction. The risk-reward is asymmetric.
The cost of structural hedges, gold-type positions, geographic diversification away from Hormuz-exposed assets, has temporarily fallen as the risk premium compressed. That is when hedges are cheapest to hold, not when to remove them.
Geographic diversification away from Hormuz-exposed supply chains has become a structural portfolio consideration rather than a tactical one, as the diverging performance of oil-importing and oil-exporting economies across this conflict cycle has made the cost of geographic concentration measurable in real return terms.
Three variables that will determine the next directional move
- Hormuz tanker traffic. This is the single most consequential physical variable. Continued improvement sustains the compression of the oil risk premium. Any renewed restriction, even a credible threat, forces a rapid premium rebuild.
- Alignment of US and Iranian public messaging. The current divergence (Washington positive, Tehran denying direct talks) is itself a risk factor. Movement toward more aligned public framing is constructive. Further divergence or provocative statements from either side are warning signals for a reversal.
- Energy market fundamentals. Weekly inventory data, International Energy Agency (IEA) demand assessments, and revised bank price forecasts will determine whether lower risk premiums translate into a sustainably lower price range or leave oil vulnerable to sharp reversals on any negative surprise. Some major banks have lowered Brent forecasts for H2 2026, citing softer demand and smaller inventory draws.
Weekly EIA inventory data has consistently shown that domestic US crude builds have little power to move the oil price outlook when the structural risk premium from Hormuz is the dominant pricing variable, a pattern that sets the baseline for interpreting any fundamental data that emerges as the diplomatic situation evolves.
Continued improvement in Hormuz tanker flows has been the mechanical driver of recent oil price declines. Any renewed restriction, even threatened, forces traders to rebuild the premium rapidly.
North Sea Dated crude’s journey from approximately US$99/bbl through a US$31/bbl plunge to US$68/bbl, a rebound on resumed hostilities, and another sharp leg lower on 28 July illustrates the speed and scale of premium builds and unwinds in this environment. Each of these three variables gives you a specific, observable signal to track rather than a vague instruction to monitor geopolitical risk.
What this session tells you that the price move alone does not
Oil collapsed while gold rose. Global equities rallied while US tech lagged. Yields eased but remain structurally elevated. The composite picture is one of tactical relief, not resolved risk.
The diplomatic architecture reinforces that reading: working-level contacts, diverging public narratives, no signed framework. The relief rally is pricing a lower near-term probability of disruption, not a permanently lower risk environment.
Whether the 28 July session marks the beginning of a sustained de-escalation trade or a temporary reprieve before another leg of volatility depends on the three variables identified above: Hormuz traffic, public narrative alignment, and fundamental inventory data. Until those signals converge in a constructive direction, the market’s own behaviour, gold up, crude down, defensive sectors leading, tells you this is a pause, not a resolution. Positioning that treats it as a resolution carries asymmetric downside.
This article is for informational purposes only and should not be considered financial advice. Investors should conduct their own research and consult with financial professionals before making investment decisions. These statements are speculative and subject to change based on market developments and geopolitical conditions.