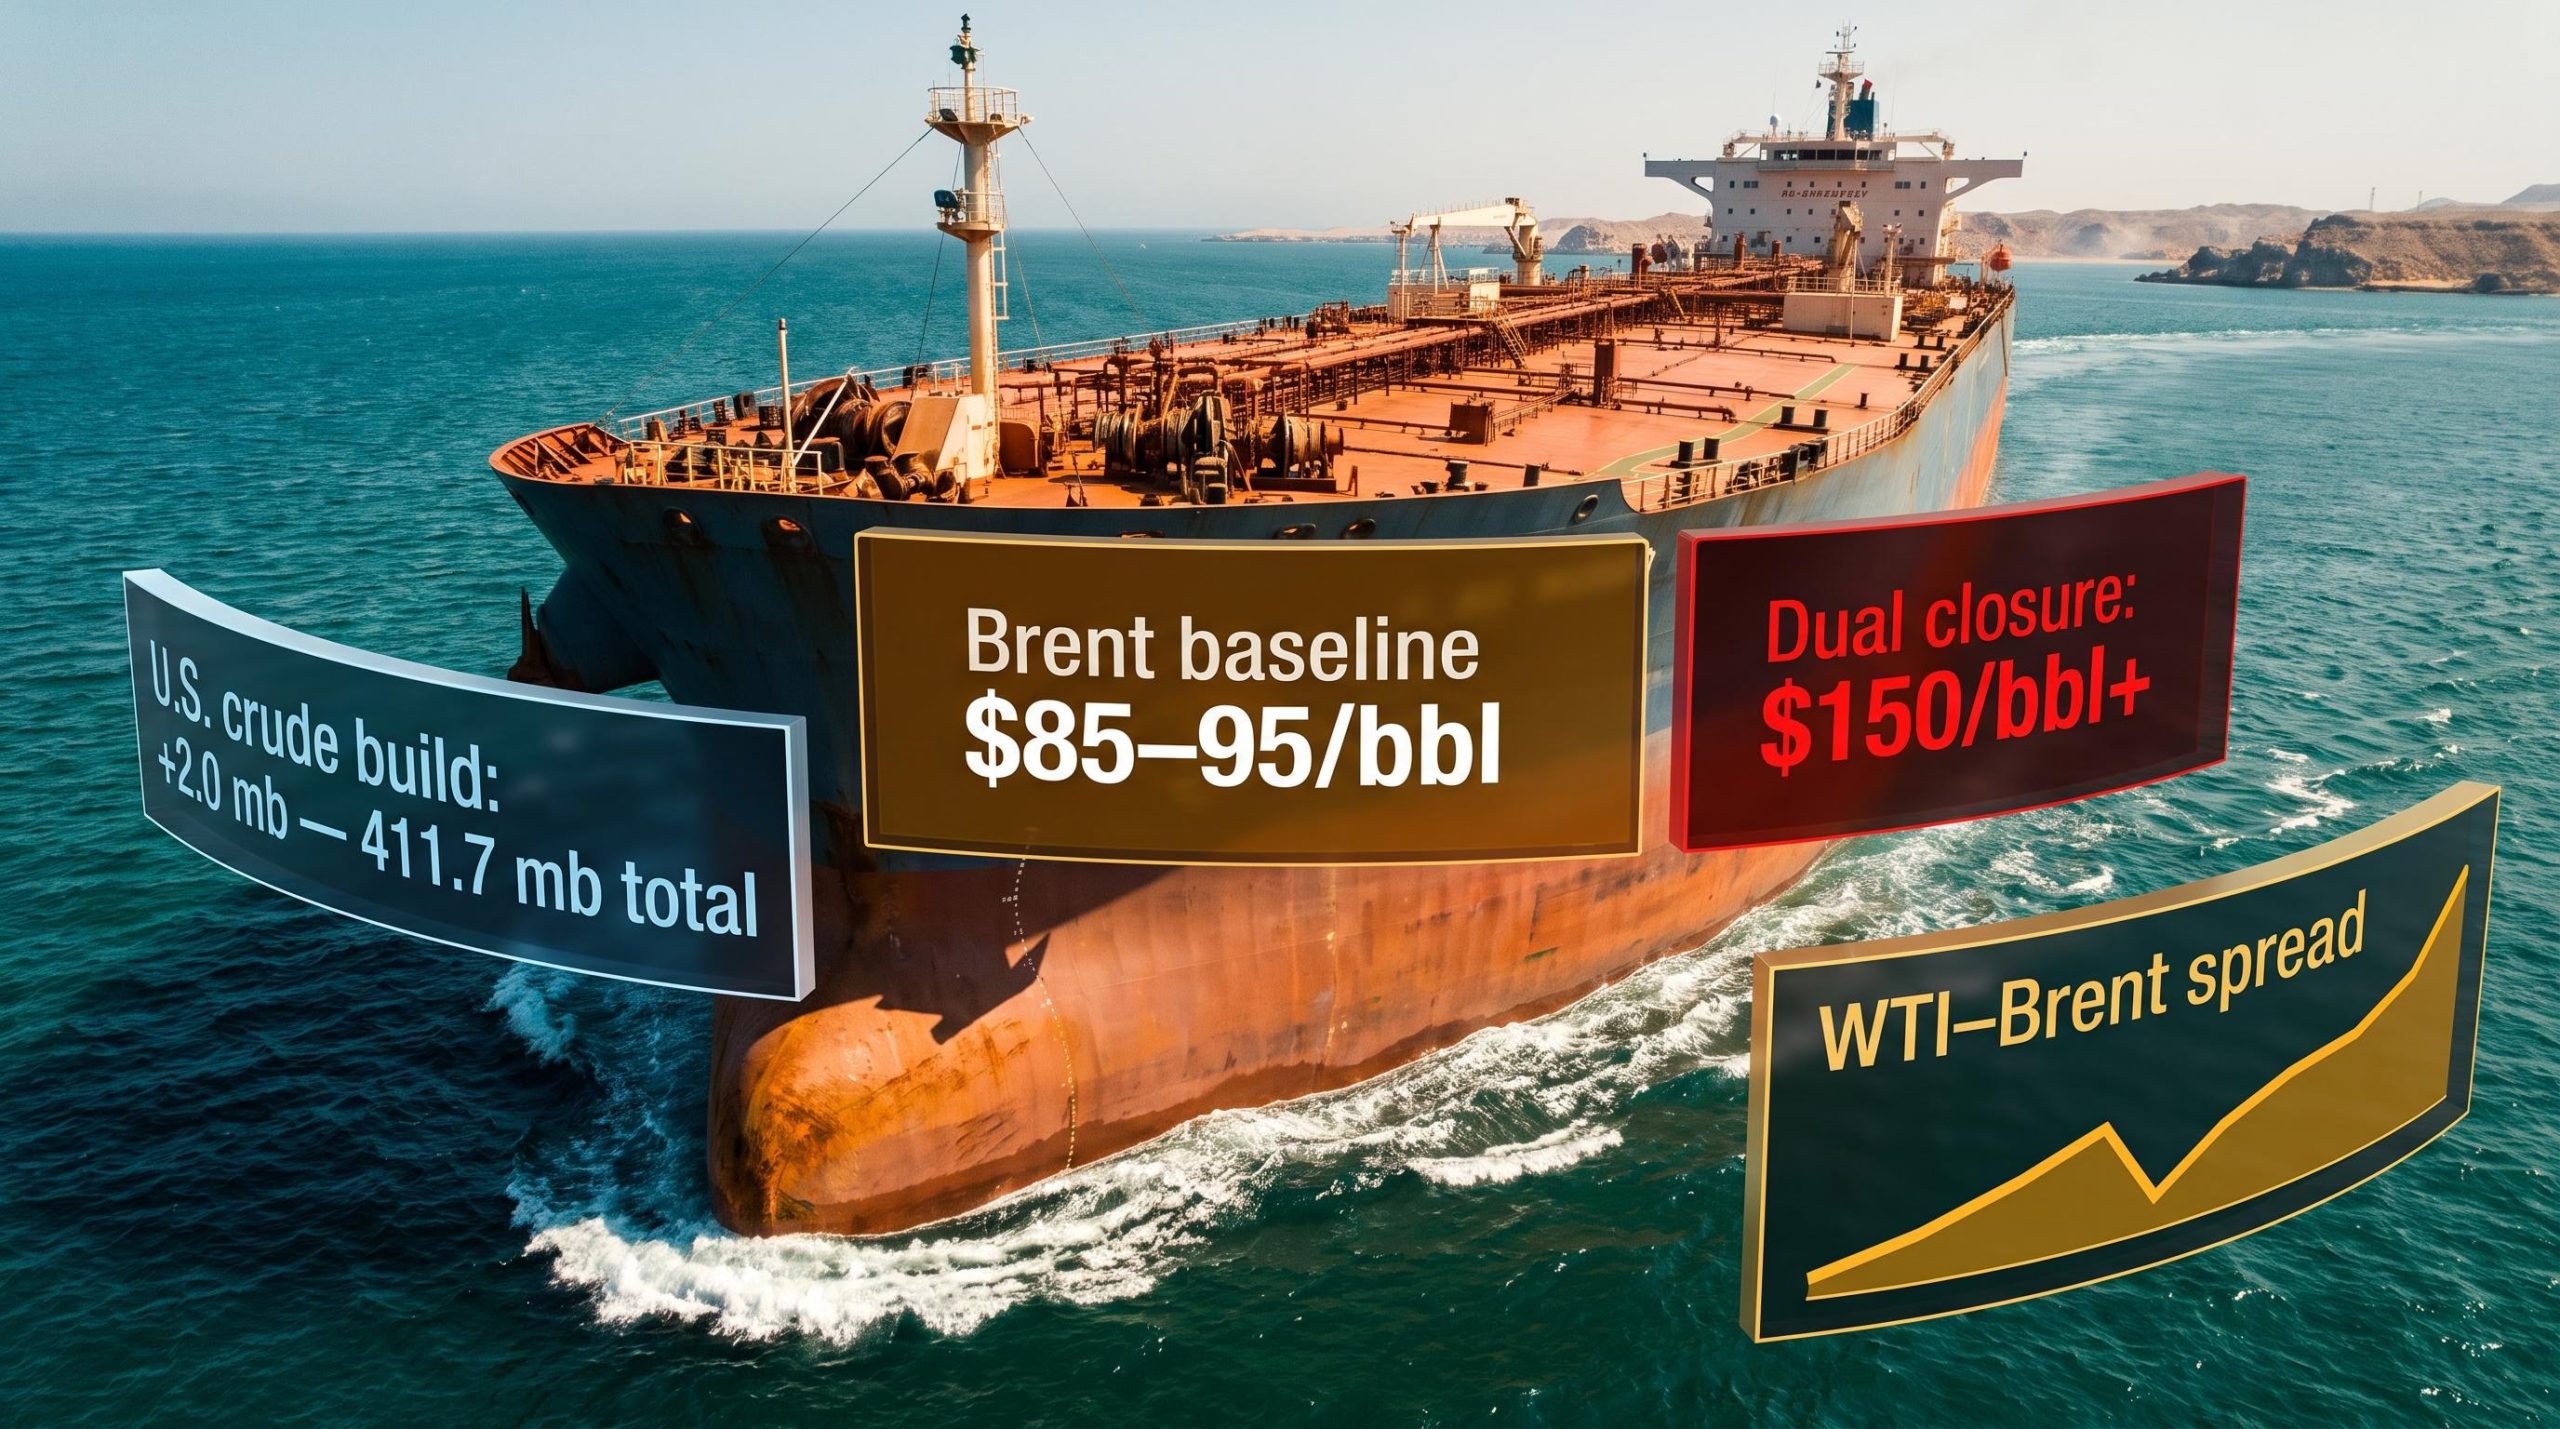
Crude oil prices remain near multi-month highs despite U.S. official data revealing that domestic stockpiles moved in a direction traders had not anticipated, adding 2 million barrels over a single week at a point when the consensus had leaned toward a drawdown.
The Energy Information Administration’s (EIA) weekly report and the Bab el-Mandeb Strait are operating on entirely different logic. One captures what happened to barrels sitting in American tank farms over a seven-day window. The other represents the physical path that several million barrels of Persian Gulf crude must navigate every day to reach Europe and Asia, through a corridor where Houthi and Iranian-linked threats have already forced insurers to price war risk into every cargo. Understanding the difference between these two signals is not academic. It is how you read an oil market that is simultaneously loose domestically and critically tight globally.
Here is a framework for why these two forces pull in opposite directions, which one is currently setting the price, and what specific conditions would shift that balance over the months ahead.
The U.S. inventory surprise and what it actually tells you
The EIA’s weekly figures for the period ending 17 July 2026 showed a broadly bearish result across all major categories:
- Commercial crude inventories: rose 2.0 million barrels, reaching 411.7 million barrels
- Gasoline stockpiles: increased by 0.8 million barrels
- Distillate inventories: climbed 1.4 million barrels
- Total commercial petroleum stockpiles: advanced 11.6 million barrels
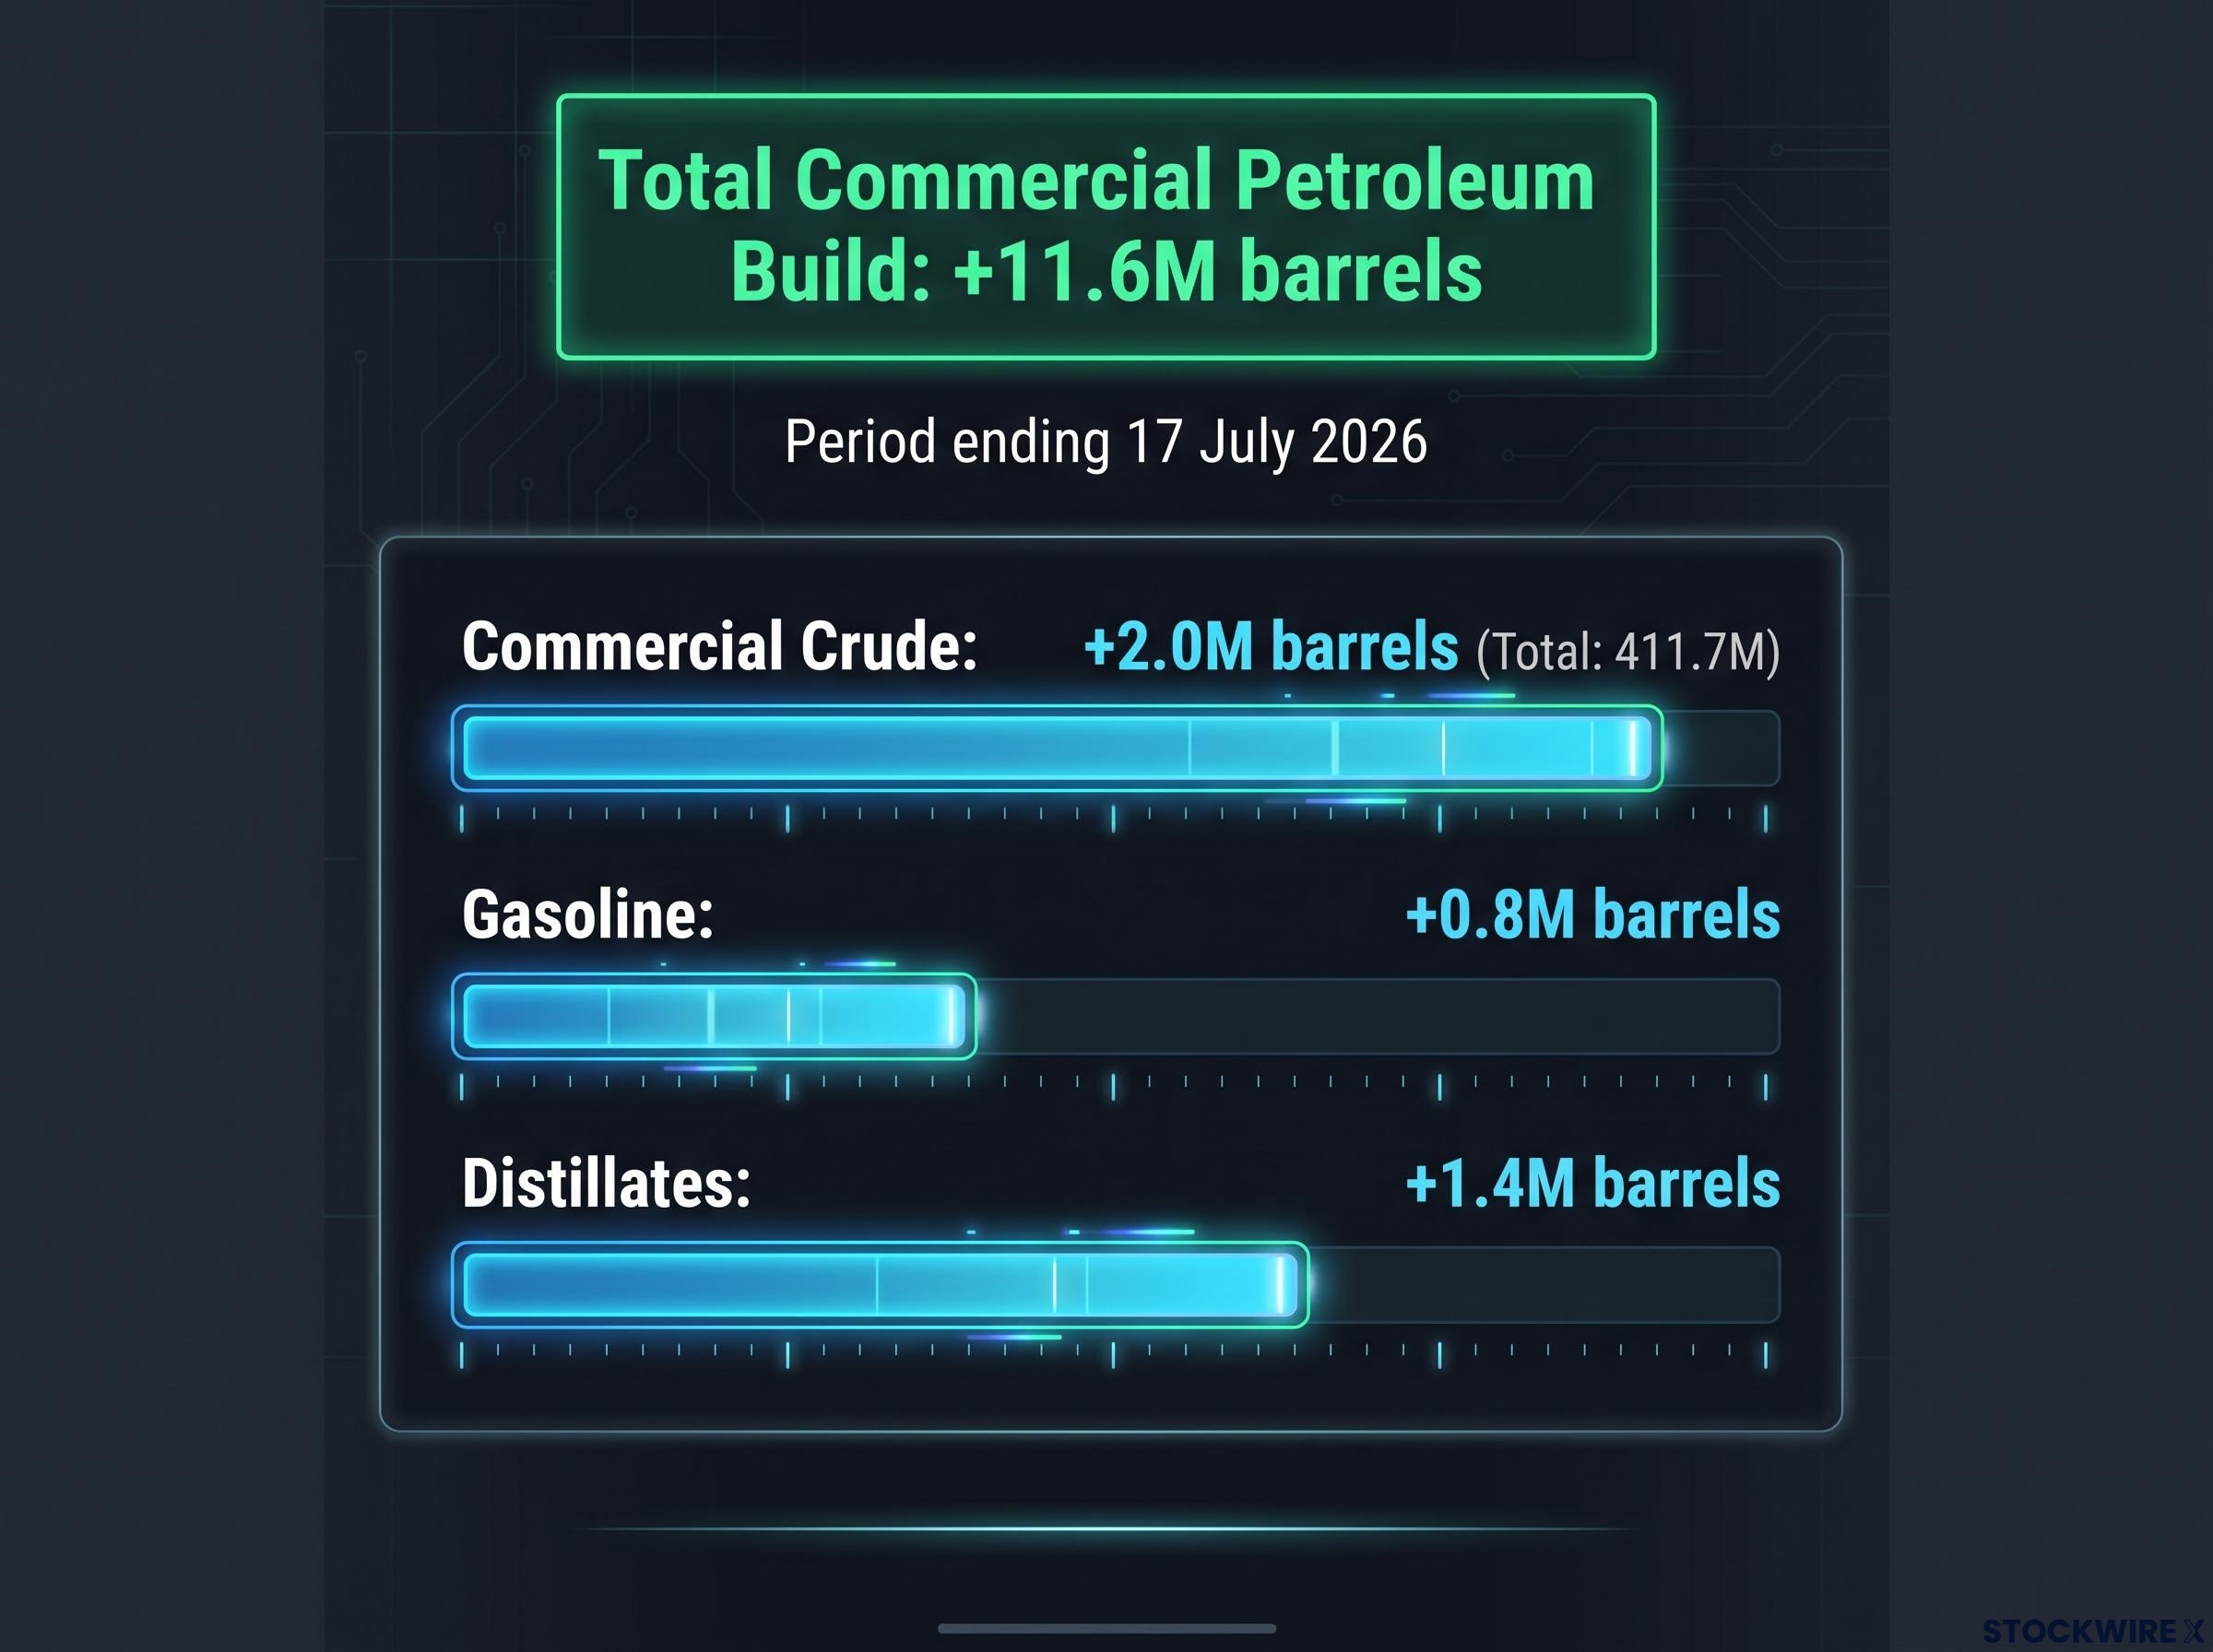
The market had been positioned for a draw, yet every major product category registered a build instead.
A broad-based build like this normally signals one of three things: weaker refinery throughput, softer domestic consumption, or stronger-than-expected supply in that specific week. The breadth of it, crude plus gasoline plus distillates, suggests consumption growth did not keep pace with supply over those seven days.
The discipline of reading U.S. oil inventory data correctly requires separating the surprise component from the absolute level, tracking SPR releases that inflate apparent draws, and cross-referencing crude figures against concurrent product builds that can contradict a bullish headline read.
But the interpretation has a boundary. At roughly 412 million barrels, U.S. crude stocks sit within a historically manageable range. The absolute level is not alarming. What matters for price formation is the surprise direction relative to consensus: traders were positioned for a draw, and they got a build. That repositioning creates short-term pressure on West Texas Intermediate (WTI), the U.S. benchmark.
The surprise build tells you that domestic supply and demand were temporarily misaligned that week. It does not tell you anything about what is happening to the barrels that never reach U.S. shores because they cannot move through the Strait of Hormuz.
When big ASX news breaks, our subscribers know first
How two straits became the structural risk premium in every barrel
Two maritime corridors now define the oil price outlook more than any single inventory report. Understanding their geography, and how the relationship between them has changed, is where the real pricing story sits.
The Strait of Hormuz: from transit corridor to near-standstill
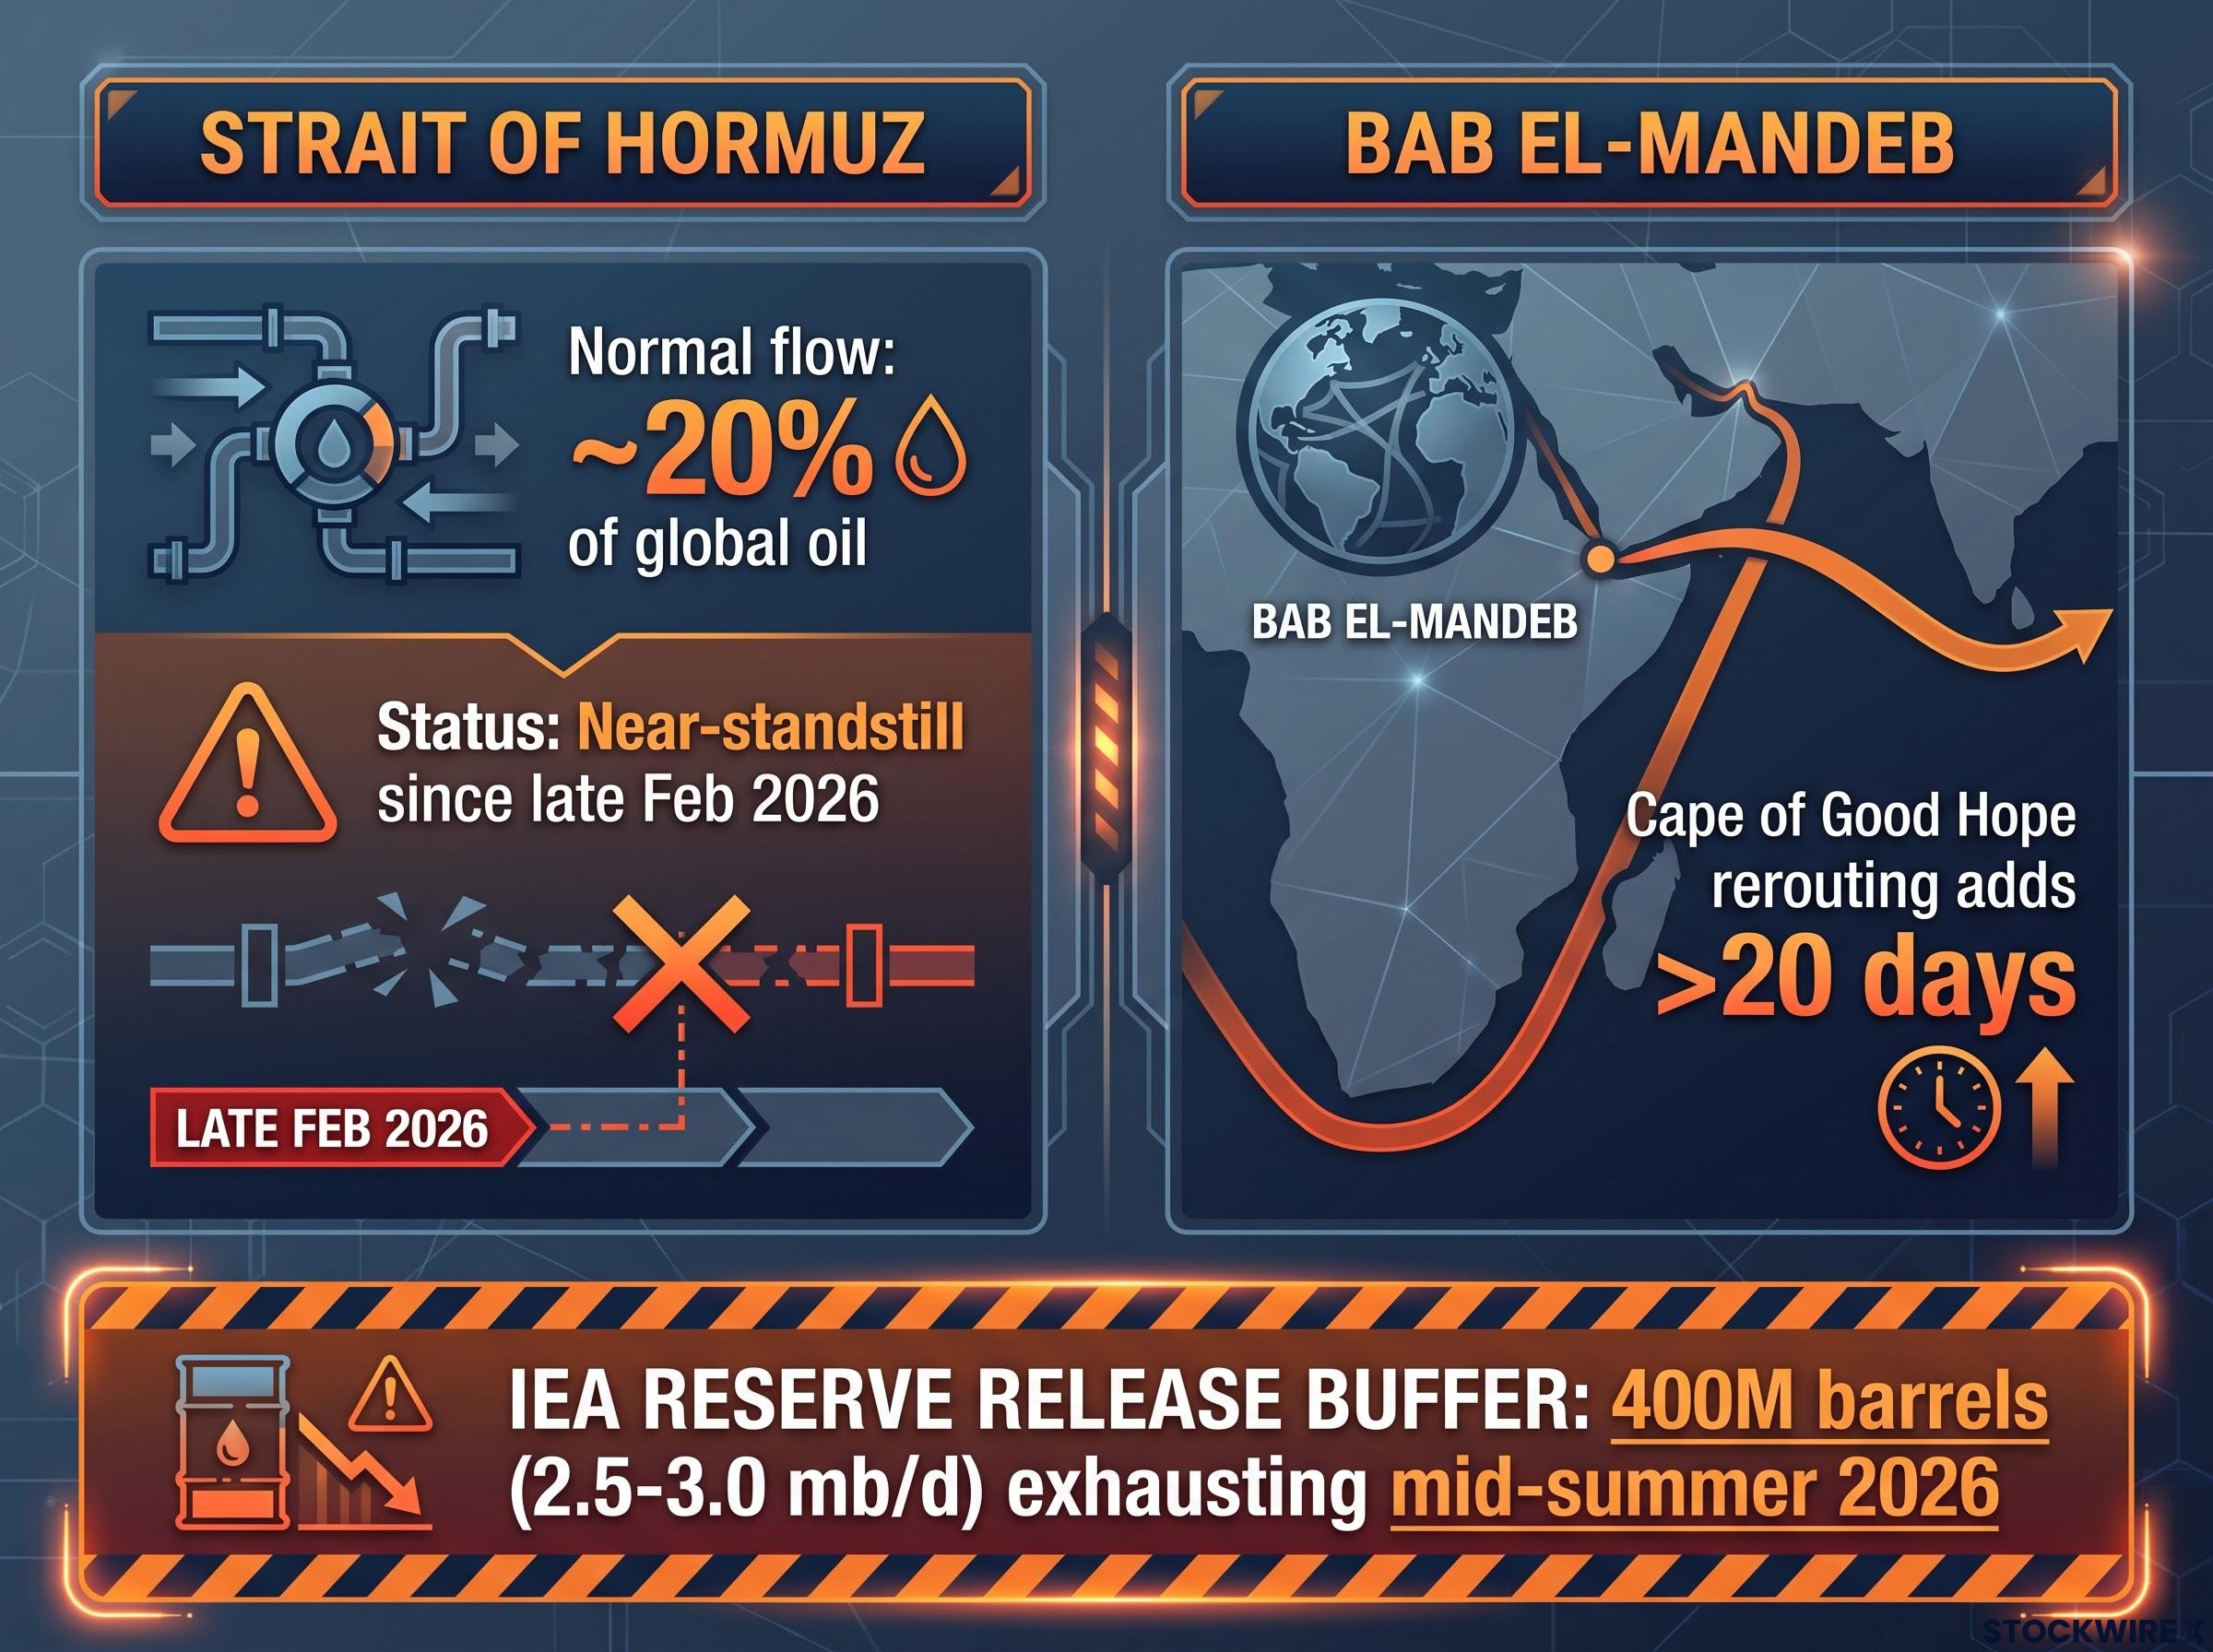
The Strait of Hormuz is the only maritime exit from the Persian Gulf, and in normal conditions it carries roughly one-fifth of global oil flows. Since late February 2026, when U.S.-Israel strikes on Iran triggered Iranian retaliation including drones, missiles, and Islamic Revolutionary Guard Corps (IRGC) “toll” enforcement, traffic through Hormuz has been at a near-standstill. Most commercial insurers have either withdrawn coverage or priced it prohibitively.
Lloyd’s List Intelligence Hormuz tracking shows a sharp collapse in declared AIS transits through the strait since late February 2026, with a growing share of remaining movements classified as dark transits, a pattern consistent with the insurance withdrawal and IRGC enforcement activity described across Persian Gulf shipping lanes.
To cushion this supply shock, the International Energy Agency (IEA) coordinated the largest reserve release in history: approximately 400 million barrels, adding 2.5-3.0 million barrels per day (mb/d) to the market. Those flows are expected to be essentially exhausted by mid-summer 2026.
The Hormuz risk premium does not decompress at the speed of a ceasefire announcement; the IEA’s own two-year supply chain recovery timeline means war-risk insurance, tanker routing decisions, and physical supply imbalances remain structural even after a diplomatic breakthrough, a point that shapes how market analysts frame the baseline price floor.
Bab el-Mandeb: the backup route that became the main route
The Bab el-Mandeb Strait connects the Red Sea to the Gulf of Aden. With Hormuz effectively closed, this corridor has been elevated from a secondary transit route to the primary functional escape route for Persian Gulf crude that can still move. That makes it a second single point of failure rather than a backup.
Red Sea shipping has been subject to strikes and interdiction attempts by Houthi and Iranian-aligned forces, with the result that war-risk insurance premiums have surged and a growing number of tankers have been diverted south around the Cape of Good Hope, a deviation that can extend Asia-Europe voyage durations by more than 20 days.
| Strait | Normal daily throughput (approx.) | Current status (July 2026) | Primary disruption mechanism |
|---|---|---|---|
| Strait of Hormuz | ~20% of global oil flows | Near-standstill; IRGC toll enforcement | Iranian military retaliation, drone/missile threats, insurance withdrawal |
| Bab el-Mandeb | Major Red Sea transit corridor | Under active threat; sporadic attacks | Militant strikes on tankers, elevated war-risk insurance premiums, southern Africa rerouting |
When those IEA reserve buffers are spent, the physical constraint at Hormuz and the threat at Bab el-Mandeb translate directly into a tighter global supply balance with no emergency cushion remaining. That is the structural risk premium embedded in every barrel of globally traded crude right now.
What happens to prices when tankers take the long way round
Cape of Good Hope rerouting is not merely an inconvenience for shipping companies. It is a price transmission mechanism.
Each diverted voyage adds weeks of transit time and substantial bunker fuel cost. Those costs are recovered through higher freight rates and Bunker Adjustment Factor (BAF) surcharges, charges that shipping lines pass through to cargo owners. War-risk insurance premia operate the same way: insurers price the threat of attack into every policy, and that cost flows into the delivered price of crude in Rotterdam, Tokyo, and Mumbai. An inventory build at Cushing, Oklahoma does not offset these per-cargo cost increases. They are separate price vectors.
Market analysts have mapped indicative Brent ranges across the disruption spectrum:
| Scenario | Indicative Brent range | Primary mechanism | Status as of July 2026 |
|---|---|---|---|
| Threat premium only (current baseline) | $85-95/bbl | Elevated risk, no large disruption | Active |
| Partial Red Sea disruption | +$3-4/bbl above baseline | Rerouting + higher freight | Sporadic attacks occurring |
| Full Bab el-Mandeb blockade (Hormuz constrained) | $130-150/bbl+ | Severe effective supply cut | Scenario, not yet realised |
| Dual Hormuz + Red Sea closure | $150/bbl+ | Near-total Gulf export cutoff | Scenario, not yet realised |
Under a dual-chokepoint closure, market analysts estimate Brent could exceed $150/bbl, reflecting a near-total cutoff of Persian Gulf exports.
The $85-95/bbl baseline is not priced on current supply and demand alone. It is priced on the probability-weighted distribution of all the scenarios above it, and the $130-150/bbl tail carries enough weight in that distribution to lift the whole curve. That is why prices stay elevated even when the news cycle goes quiet: the structural costs of disruption are already in the system.
Why a domestic crude build and a global supply squeeze are not opposites
This is the core question of the current oil market, and it has three structural answers:
- Different time horizons: the EIA report is backward-looking; chokepoint risk is forward-looking
- Benchmark divergence: U.S. data informs WTI; global seaborne risk informs Brent
- Nonlinearity: the inventory surprise is bounded; chokepoint tail risk is not
Time horizons: what happened vs. what could happen
The EIA weekly report captures supply, refinery runs, and demand over a specific seven-day period. Chokepoint threats are forward-looking and inherently about what could happen over the next days, weeks, and months, particularly as reserve releases are exhausted and seaborne flows remain impaired. Oil is priced as a forward claim (a futures contract is literally a bet on the future), so traders weight near-term disruption risk more heavily than a single week’s historical data, especially in a fragile environment.
Benchmark divergence: WTI is not Brent
U.S. inventory data directly informs WTI pricing, while global flows and chokepoint risk primarily drive Brent and Dubai benchmarks. When domestic balances diverge from global conditions, the WTI-Brent spread widens rather than blending into a single signal. A domestic crude build can cap WTI even as Brent holds firm on seaborne risk and freight inflation.
The Brent-Dubai benchmark divergence that emerged in May 2026, when the Asia-Pacific benchmark reached approximately $260 per barrel against Brent near $108, illustrates at its most extreme how seaborne supply constraints translate into separate regional price regimes rather than a single global crude price.
If you are watching WTI and Brent diverge, you are watching the market simultaneously price a domestic loosening and a global tightening. The spread is the mechanism doing the work that a single price cannot.
Nonlinearity: bounded data vs. unbounded tail risk
The U.S. inventory surprise is a known +2.0 million barrel change with clear arithmetic implications. The distribution of outcomes around Bab el-Mandeb and Hormuz ranges from continued safe passage to a dual-chokepoint closure that removes several million barrels per day from the global market. Options and forward curves are priced on the full distribution of scenarios, and the large tail risks pull the entire curve higher even when spot fundamentals look modestly loose.
The variables that will determine which scenario plays out
Three variable clusters will shape where prices go from here, and each is something you can monitor rather than merely absorb.
- Geopolitical and chokepoint: Does Bab el-Mandeb escalate from sporadic attacks to sustained interdiction? Does Hormuz move toward partial normalisation or formalised long-duration closure? A sustained Red Sea disruption on top of an already impaired Hormuz corridor is the dual-chokepoint scenario that modelling suggests could push Brent well above $130-150/bbl.
- Inventory and demand: Do subsequent EIA reports confirm a trend toward builds, indicating genuine softening in U.S. demand, or does the 17 July data revert to draws, marking it as a one-week outlier? Are global inventories (OECD and non-OECD) continuing to decline as the IEA release is exhausted?
- Freight and logistics: Is the volume of traffic being diverted via southern Africa increasing, pushing average voyage times and freight rates higher? Do rising bunker fuel prices reinforce BAF surcharges and logistics-driven inflation across trade lanes far from the Middle East chokepoints?
| Scenario | Brent range | Key trigger | Status as of July 2026 |
|---|---|---|---|
| Base case | $85-95/bbl | Elevated but contained risk; U.S. inventories oscillating | Active |
| Upside | Well above $100/bbl | Partial/full Red Sea disruption + continued Hormuz constraint + falling global stocks | Risk elevated |
| Downside | Risk premium compression | U.S.-Iran de-escalation, partial Hormuz restoration, sustained OECD demand softness | No signs yet |
The IEA reserve release was a one-time buffer, not a recurring tool. Once it is spent, any fresh escalation at either chokepoint lands on a market with far less cushion than it had in February 2026. That makes the upside scenarios more sensitive to news flow than they would have been six months ago.
Reading the spread before the next headline moves the market
The core tension is now clear: U.S. inventory data provides a real, bounded, backward-looking signal about domestic balances; chokepoint risk provides an unbounded, forward-looking signal about global seaborne flows. Both are needed to understand where prices are heading. Neither cancels the other.
The WTI-Brent spread is the live readout. A widening spread signals the market is pricing diverging domestic and global conditions. A narrowing spread signals convergence, either through de-escalation compressing the risk premium or through U.S. demand accelerating into a tighter global environment.
What a genuinely informed observer watches, in sequence:
- EIA weekly releases for domestic trend confirmation: is the 17 July build repeating or reverting?
- The WTI-Brent spread for benchmark divergence: is the gap widening or narrowing, and why?
- Geopolitical news flow for tail-risk shifts: any development at Hormuz or Bab el-Mandeb that moves the disruption probability higher or lower
For any reader making decisions that depend on energy costs or commodity exposure, the spread is not a technical curiosity. It is the market’s real-time verdict on how much the domestic and global stories are diverging, and that verdict changes with every escalation or de-escalation update. The $85-95/bbl baseline and the $150/bbl-plus dual-closure tail are the poles of the current range. Where you sit between them depends on which of those three signals moves next.
For investors wanting to understand how institutional forecasters have repositioned the upside scenarios from stress tests to base-case planning assumptions, our full explainer on Brent price scenario modelling examines Goldman Sachs’s $120 central estimate, Hormuz flow data through late July 2026, and the structural buffers that have been exhausted.
This article is for informational purposes only and should not be considered financial advice. Investors should conduct their own research and consult with financial professionals before making investment decisions. These price scenarios are speculative and subject to change based on geopolitical developments and market conditions.