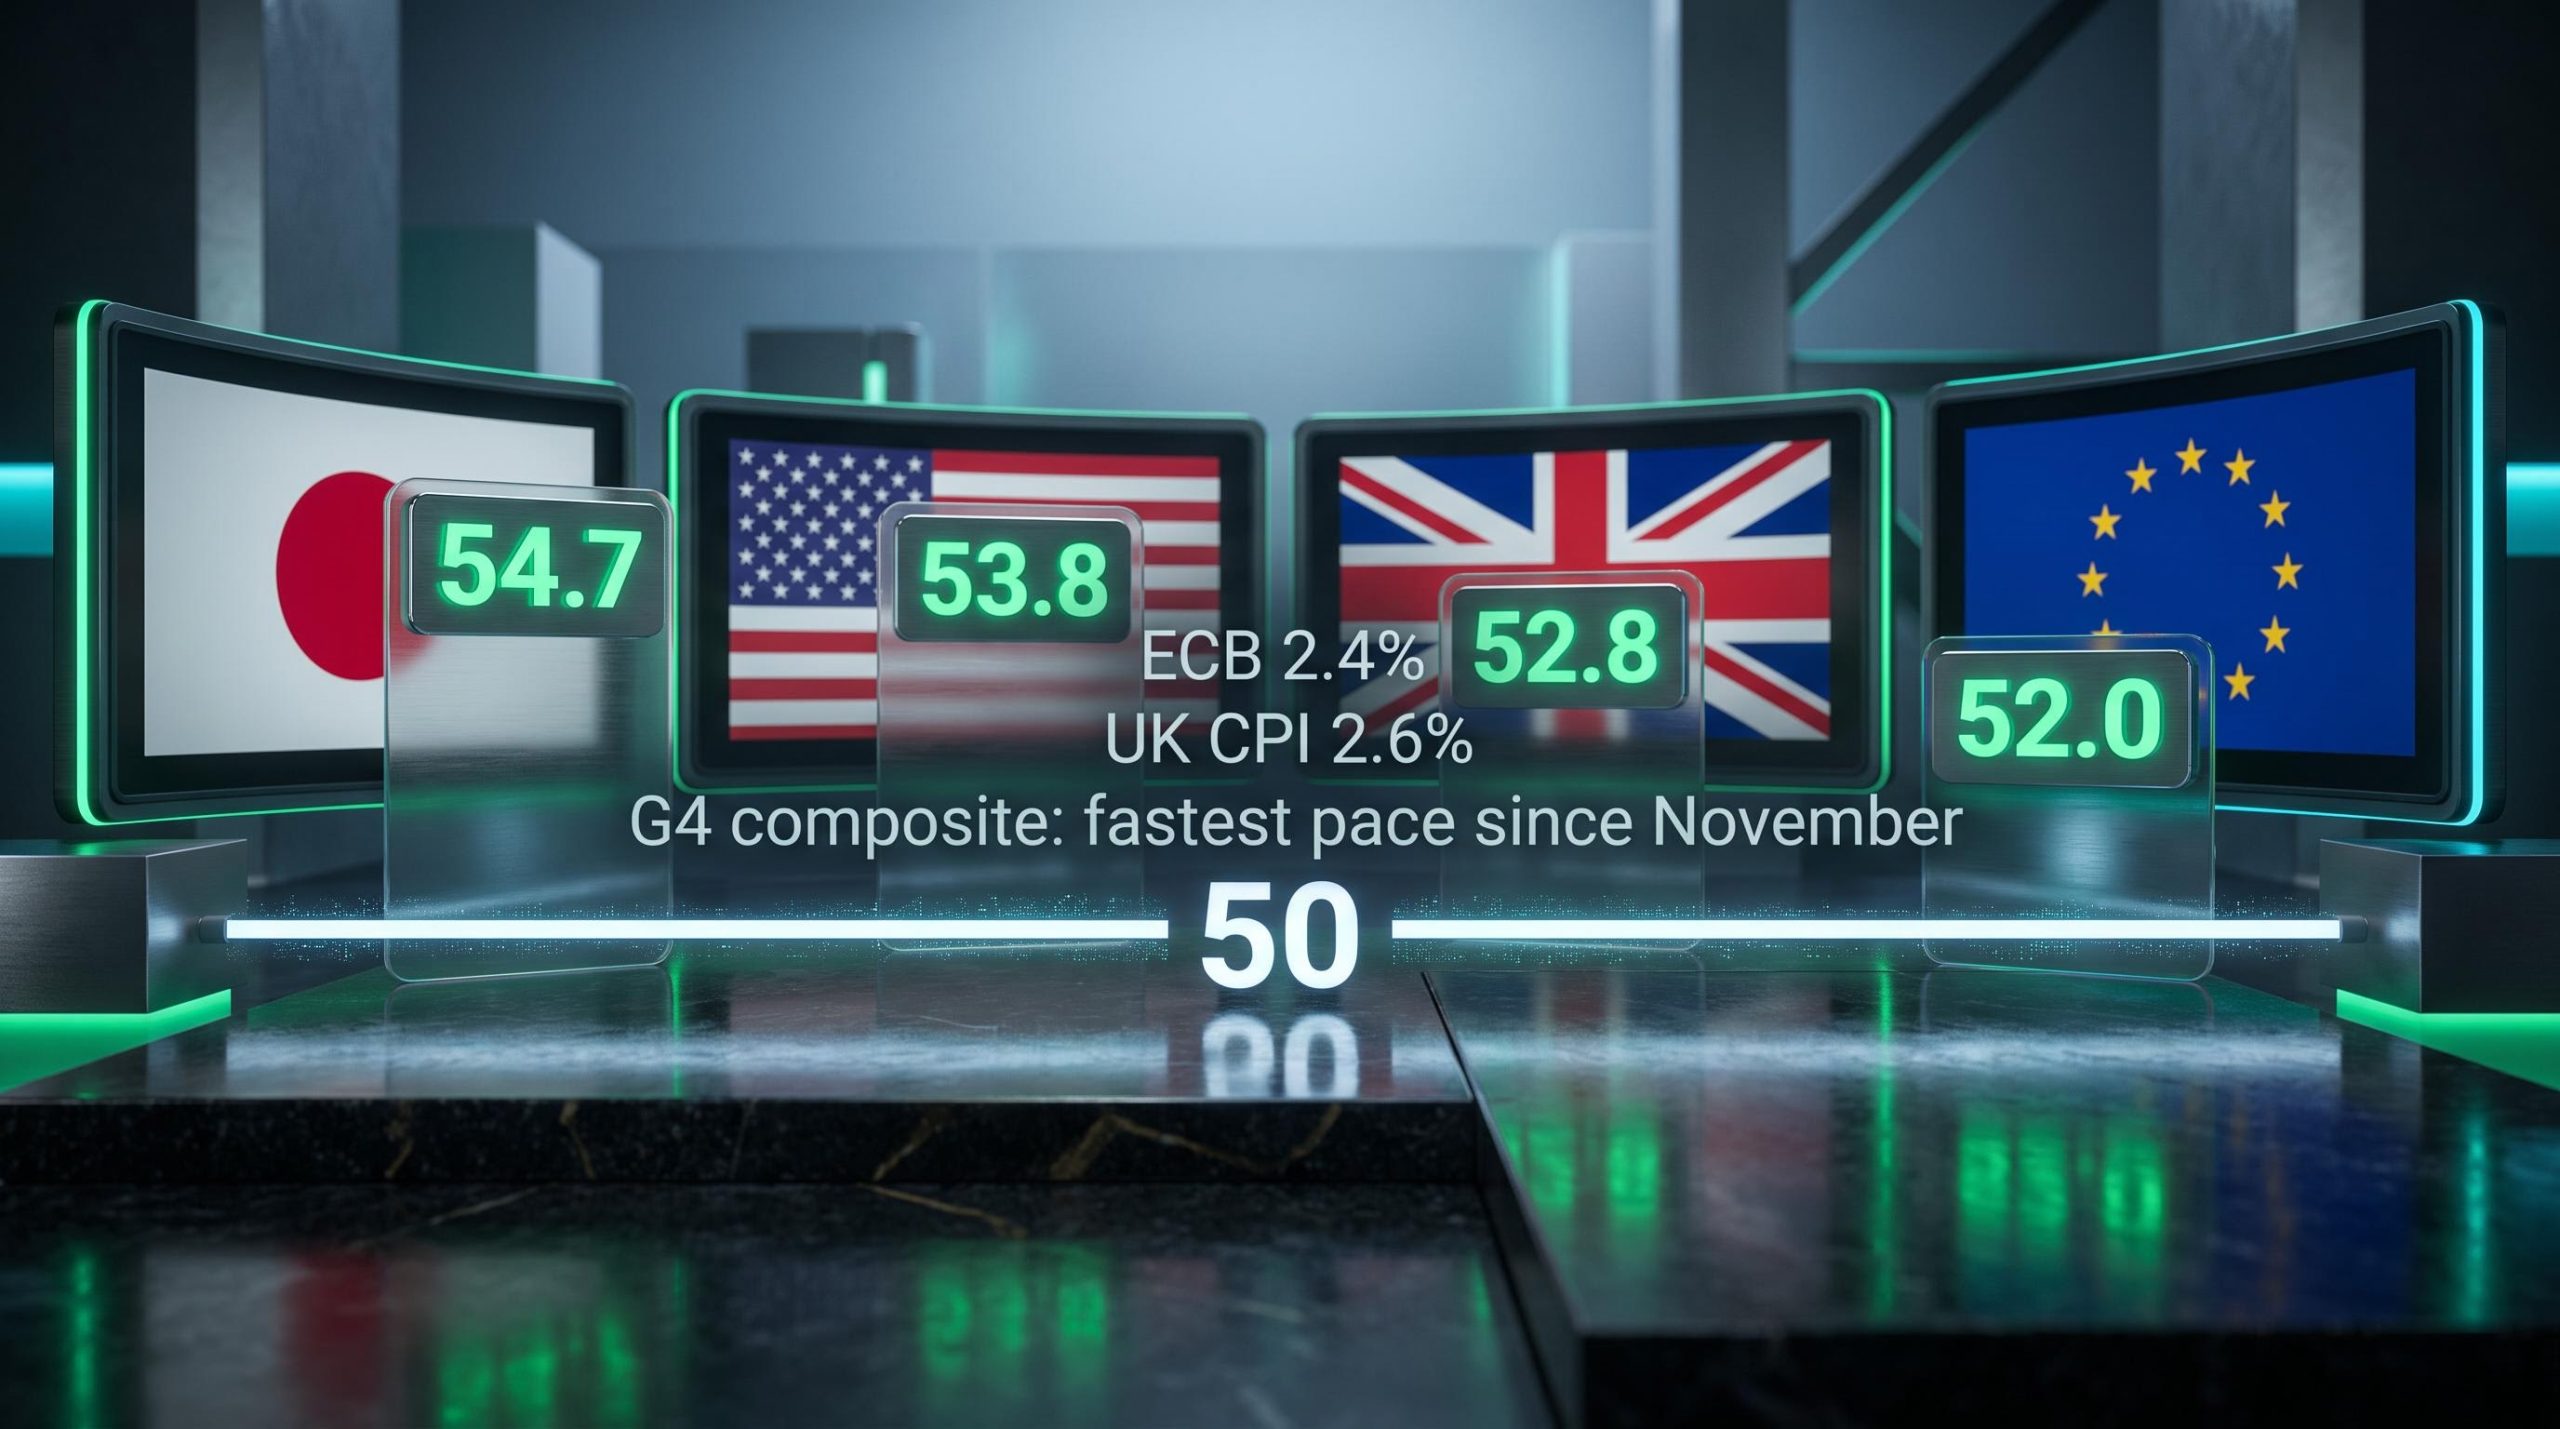
All four of the world’s largest developed economies are expanding at the same time. The July flash PMI data from S&P Global, released last week, confirmed that the US, eurozone, UK, and Japan all sit above the 50-point threshold that separates expansion from contraction. That alone would be worth watching. The fact that it arrived in the same week as an ECB rate hold, and ahead of both a Bank of England and Bank of Japan decision this week, turns a strong data print into something more consequential.
Synchronised expansion across the G4 is not the norm. All four economies dipped earlier in 2026 following geopolitical disruption tied to the Middle East conflict. The UK was in outright contraction as recently as June. The eurozone was stagnating at the borderline. That makes this week’s coordinated recovery a meaningful reversal, not a continuation of a trend that was already priced.
Here is what the PMI data shows, what it means for equities, credit, and currencies, and what the incoming data slate, starting this week, can either confirm or complicate for how you position from here.
The July flash PMIs in numbers: what every major economy just reported
Ranked by manufacturing strength, Japan led the G4 with a manufacturing PMI of 54.7, followed by the US at 53.8, the UK at 52.8, and the eurozone at 52.0. Every reading sits comfortably above 50. Every reading improved versus June.
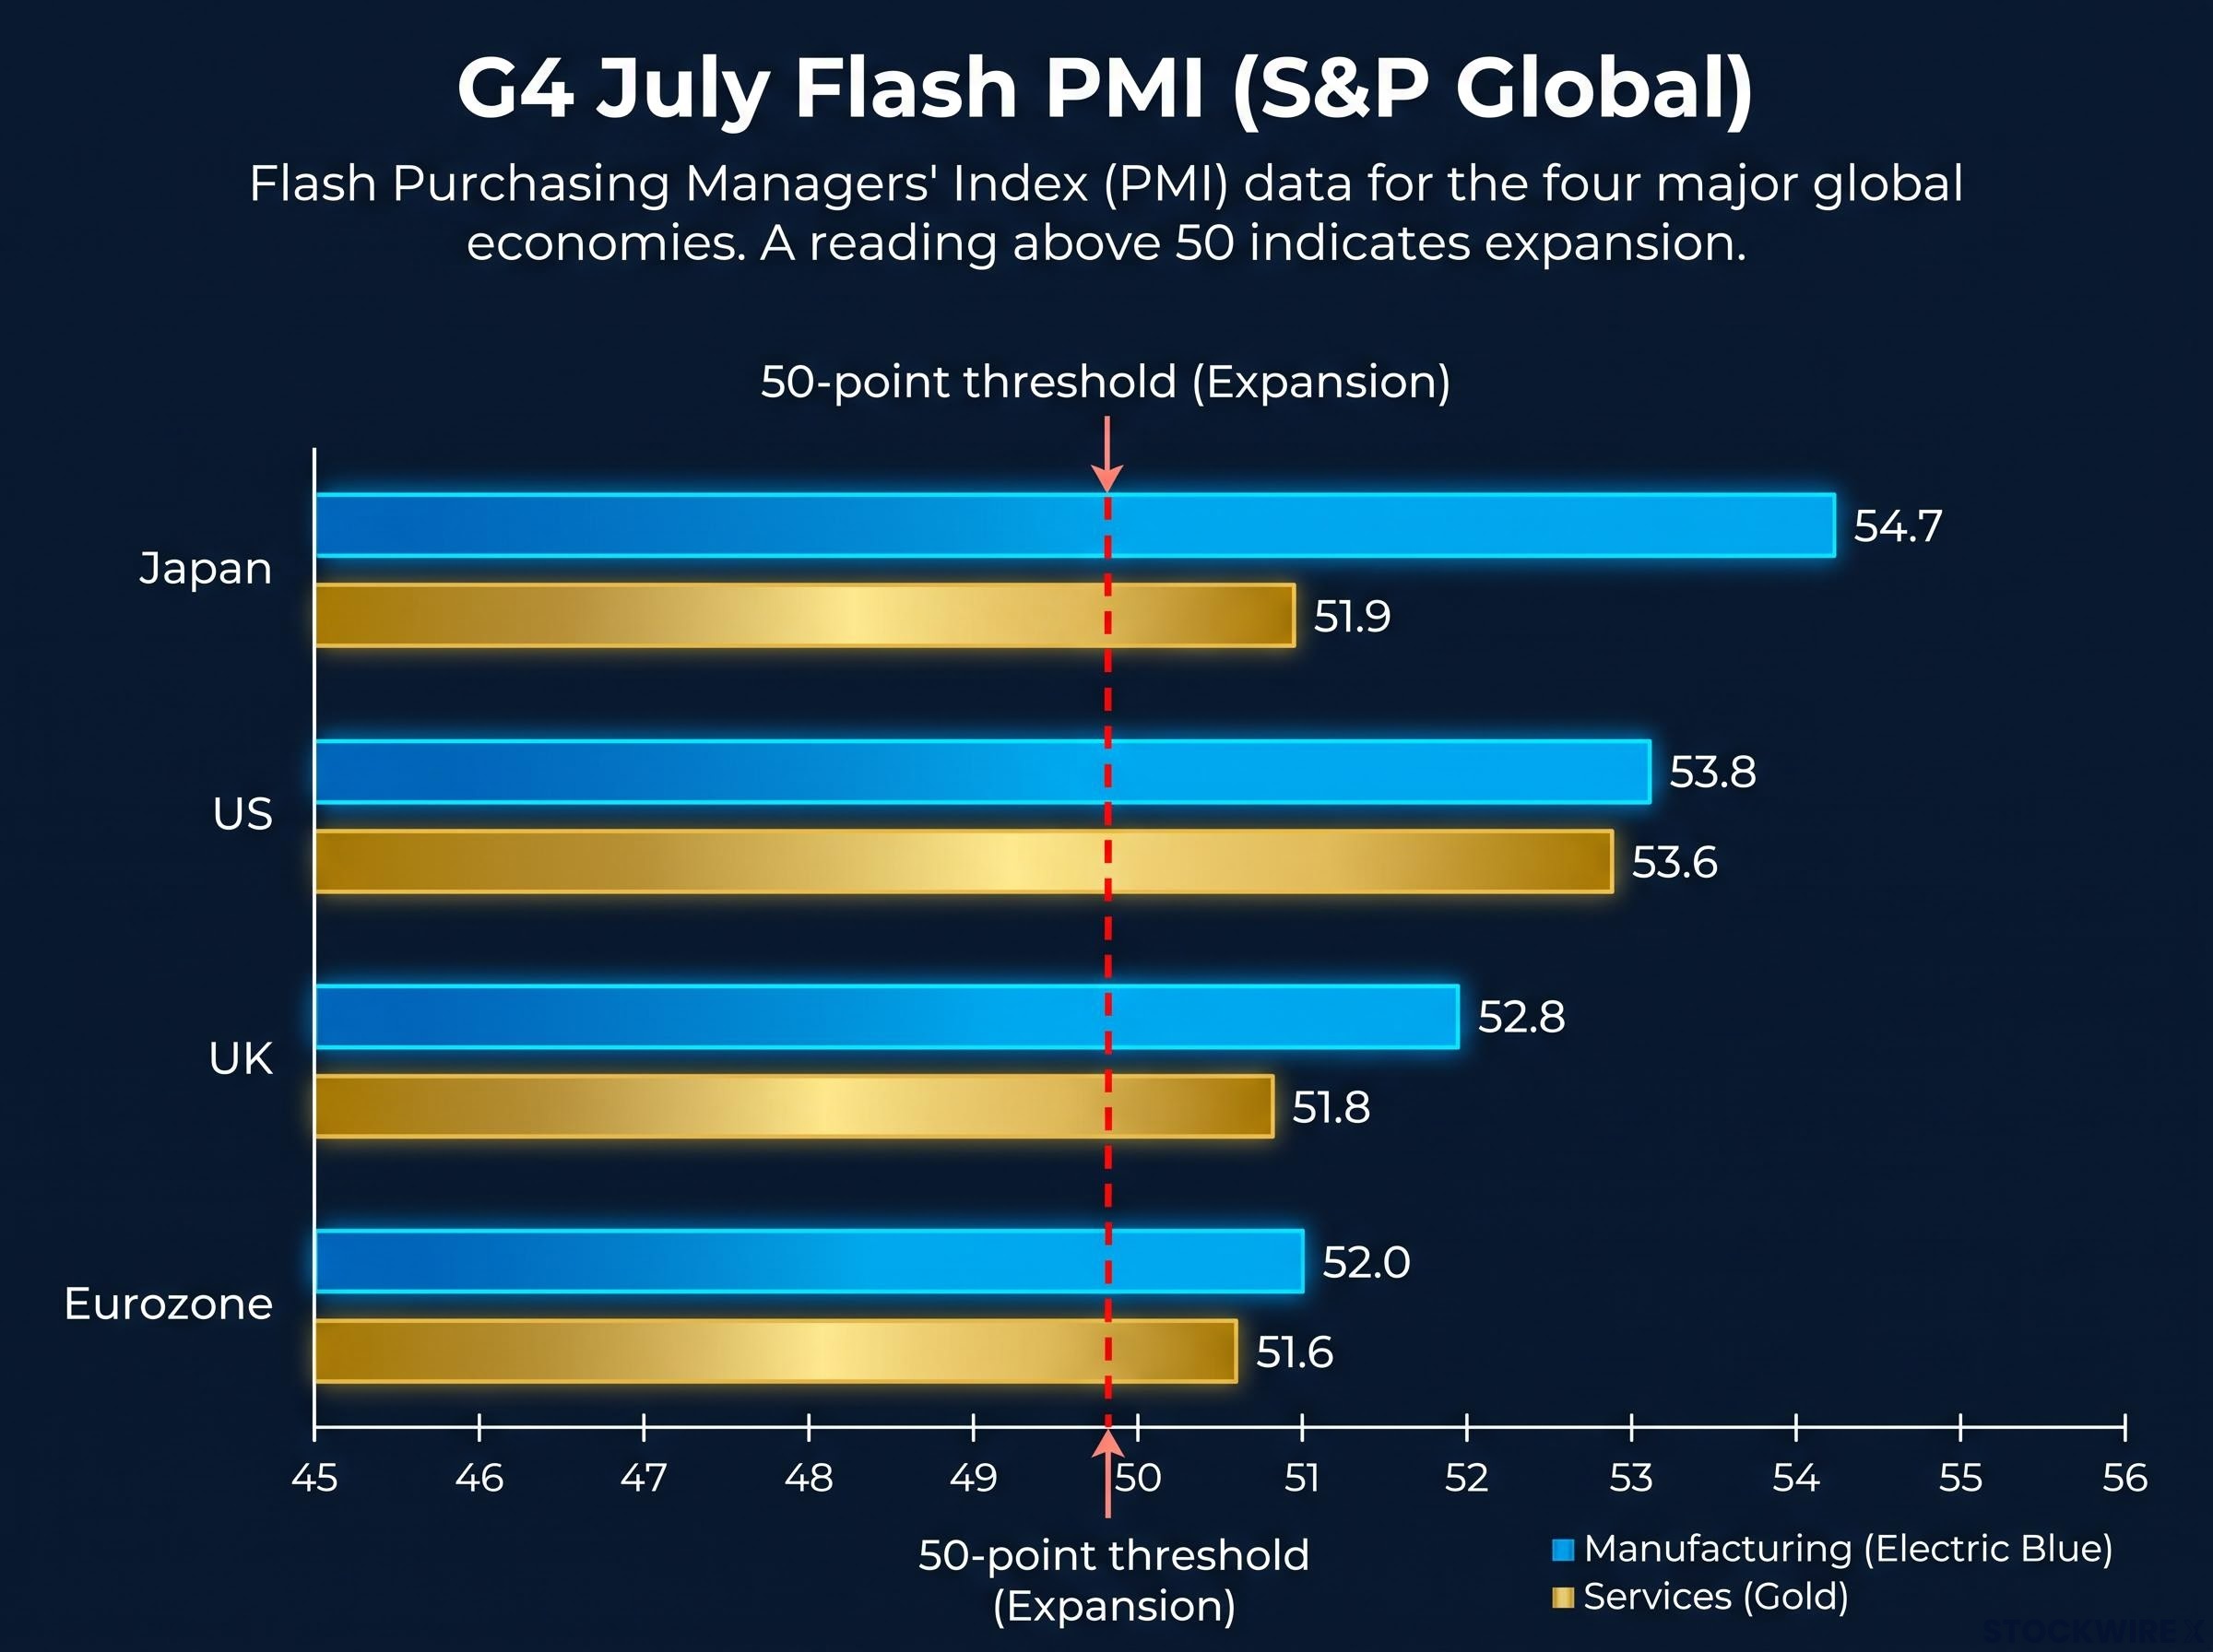
The UK stands out as the most notable return story. Its composite reading was 49.3 in June, which is contraction territory. One month later, both manufacturing and services are back above 50, with activity at its highest since September 2024. That is a sharper reversal than forecasters expected.
The eurozone composite rose to 51.9 from a flat 50.0 in June, its first expansion in four months. Manufacturing output hit a 52-month high. In the US, services activity reached an eight-month high at 53.6, while Japan posted its largest activity gain since February.
| Economy | Manufacturing PMI | Services PMI | vs June | Signal |
|---|---|---|---|---|
| Japan | 54.7 | 51.9 | Higher | Largest gain since February |
| United States | 53.8 | 53.6 | Higher | Services at eight-month high |
| United Kingdom | 52.8 | 51.8 | Higher | Return from contraction; highest since Sep 2024 |
| Eurozone | 52.0 | 51.6 | Higher | First expansion in four months; mfg output 52-month high |
G4 composite output accelerated for a second consecutive month in July, reaching its fastest pace since November and sitting above the three-year average.
This is not a one-market story to position around. The breadth means any portfolio with international developed-market exposure is being affected by this expansion, and where each economy sits on the ranking matters for relative allocation decisions.
Equity markets typically pre-price PMI trends 3-30 months before survey releases, meaning the market-moving content of any print is concentrated in its PMI surprise component relative to consensus rather than its absolute level, which is why a confirmed above-50 reading in the eurozone still generated meaningful price action despite the directional signal being broadly anticipated.
When big ASX news breaks, our subscribers know first
What synchronised expansion actually means, and why it is historically unusual
A single economy printing above 50 is useful but limited. When all four G4 economies clear 50 at the composite level, meaning both manufacturing and services are expanding simultaneously in each, the signal changes character. It stops being about which geography is outperforming. It becomes a statement about the direction of global demand.
That is what makes the context so important. As recently as June, the eurozone composite sat at exactly 50.0, the borderline between expansion and contraction. The UK was at 49.3, in outright contraction. The fragmentation that followed the Middle East conflict earlier in 2026 had left markets debating whether growth was concentrating in the US and Japan alone. The July data retired that question.
PMI false signals are especially common in the wake of geopolitical shocks, where survey pessimism tends to overshoot actual output declines, and the earlier 2026 contraction readings in the UK and eurozone almost certainly absorbed some of that post-shock amplification before the July reversal.
The defining features of this synchronised expansion:
- All four G4 economies above 50 at the composite level
- G4 composite output above its three-year average
- Acceleration for a second consecutive month
- Recovery from a geopolitical disruption baseline, not a clean run of momentum
Why the eurozone and UK reversal carries extra weight
The eurozone moving from 50.0 to 51.9 and the UK moving from 49.3 to above 50 are not small statistical shifts. They represent economies that were either stalling or shrinking now returning to growth. That catch-up dimension is where the mean-reversion opportunity sits, and it changes the investment implication: when all major economies move together, what drives returns shifts from picking the right geography to picking the right sector and understanding policy divergence.
Central bank crossroads: what this expansion backdrop means for policy in each economy
The ECB anchored the policy picture last week, keeping its benchmark rate on hold at 2.4%. With eurozone manufacturing output at a 52-month high and the composite firmly back in expansion, that decision reads as data-dependent patience rather than the start of an easing cycle. There is no urgency to cut when the economy just delivered its strongest goods-sector reading in over four years.
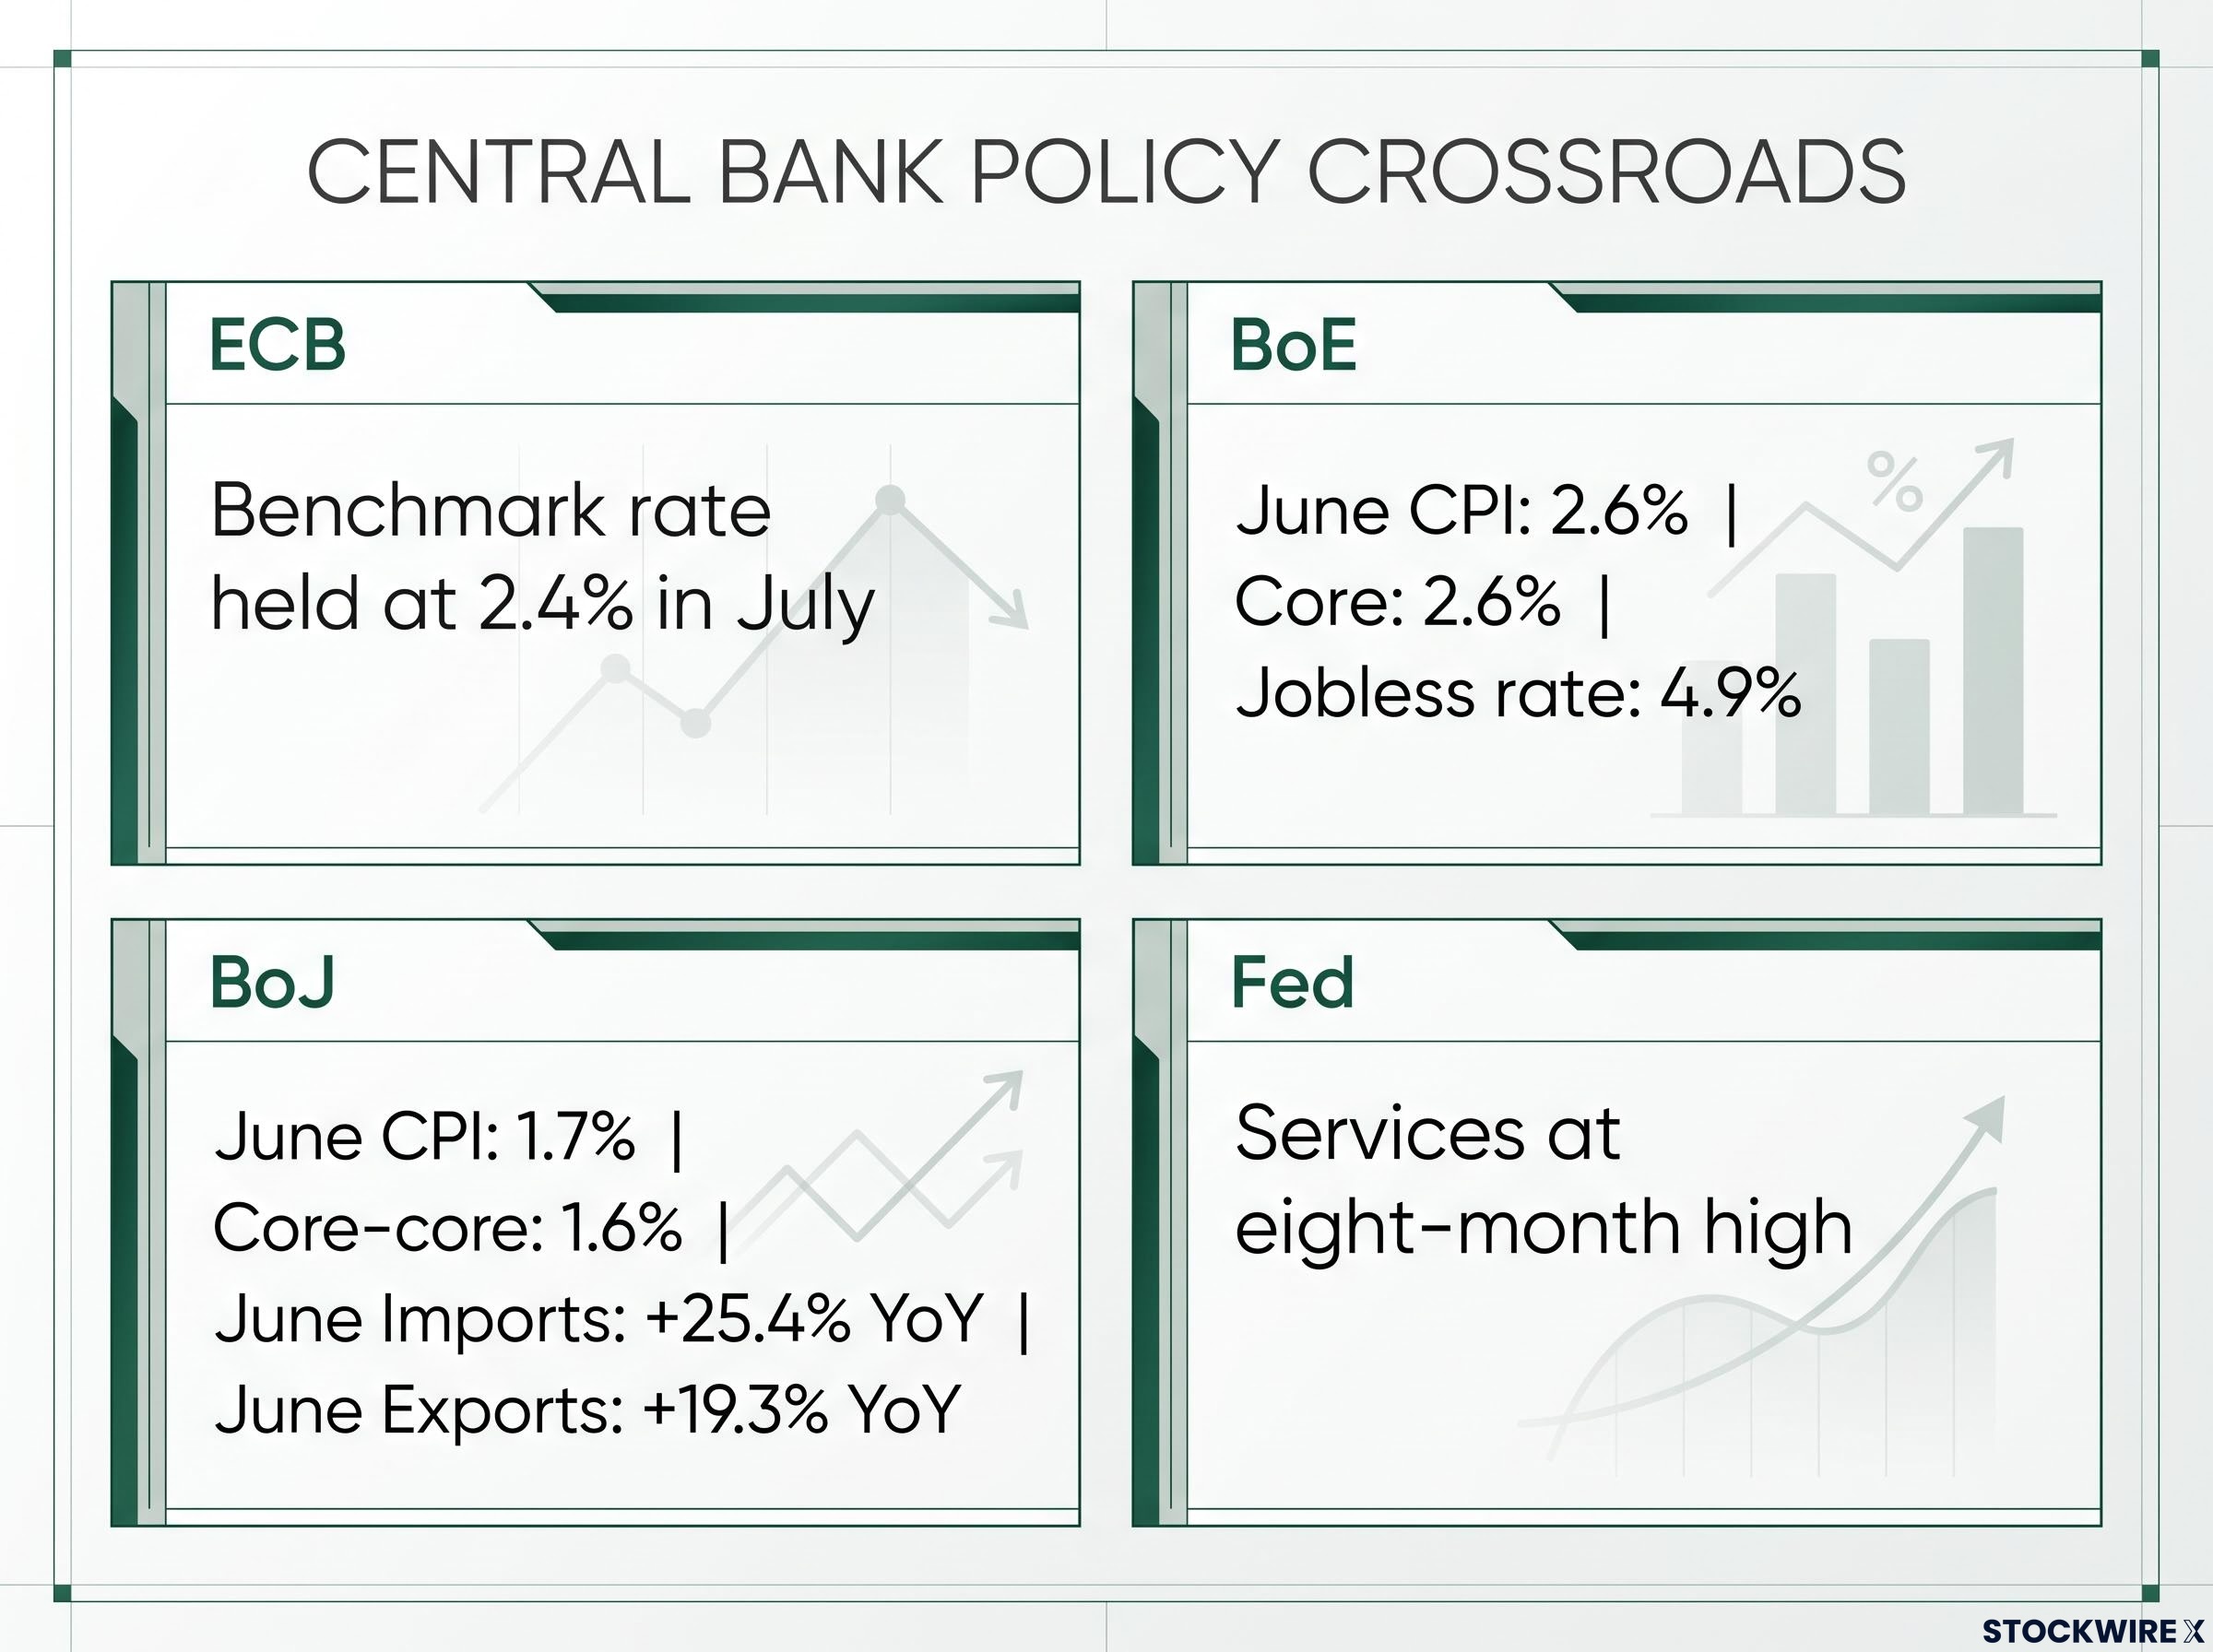
ECB benchmark rate: 2.4%, held at the July meeting.
The Bank of England faces a different calculation. The UK shifted from contraction to expansion in a single month, but the broader picture is mixed: annual CPI came in at 2.6% in June, with core inflation also at 2.6%, and the jobless rate sitting at 4.9%. That combination gives the BoE flexibility to hold and wait for harder evidence rather than cutting pre-emptively.
The Bank of Japan is the most active near-term policy risk. June annual headline CPI reached 1.7% and core-core CPI, which strips out fresh food and energy, came in at 1.6%, while the country also posted the strongest manufacturing PMI in the G4 and preliminary June trade figures recorded year-on-year import growth of 25.4% and export growth of 19.3%. Everything in that data set points toward continued normalisation pressure. The BoJ convenes this week, and for yen positioning and Japanese equity hedging decisions, it is the most binary policy event among the four.
The Fed has the least ambiguous backdrop: the strongest G4 PMI, services at an eight-month high, and no clear justification from this data alone for near-term easing.
- BoJ (meeting this week; normalisation pressure strongest)
- BoE (meeting this week; flexibility to hold)
- Fed (hold likely; data-dependent)
- ECB (held last week at 2.4%; stable)
Understanding where each central bank sits on the policy path lets you distinguish between markets where growth is confirmed and largely priced, and markets where policy is still in flux and creating opportunity or risk.
Central bank policy divergence across the G4 has been the dominant cross-asset organising theme through mid-2026, with the Fed frozen at materially higher rates than the ECB and the BoJ tightening faster than anticipated, and that divergence does not dissolve simply because growth readings have converged.
How synchronised growth changes the playbook for equities, credit, and FX
Equities: cyclicals and the catch-up trade
When all four G4 composites sit above 50, cyclical sectors historically outperform defensives. The logic is straightforward: broad global demand lifts the earnings of companies whose revenues are tied to economic activity.
The sectors most directly supported by this environment:
- Industrials
- Materials
- Consumer discretionary
- Semiconductors
- Logistics
The eurozone and UK catch-up trade is the positioning angle most directly tied to the PMI turn. Both markets just re-entered expansion from stagnation or contraction, and UK June retail sales of +1.0% month-over-month and +4.2% year-over-year confirm that domestic demand is supporting the manufacturing recovery. If subsequent hard data validates the PMI signal, mean-reversion in European and UK risk assets has room to run.
Cyclical sector allocation decisions during synchronised expansions carry a specific risk profile: the best entry points historically occur when data has stopped deteriorating rather than after momentum is confirmed, meaning the current moment, where UK and eurozone composites have just cleared 50, may already represent a lagged entry point for some sub-sectors.
Credit: supportive but not without constraints
Synchronised expansion supports corporate fundamentals. Revenues broaden, cash flows strengthen, and credit spreads generally benefit. But the constraint is real: no major central bank is rushing to ease. That limits the duration upside for fixed-income positioning. Stay selective on issuer and duration rather than adding broad exposure to long-dated government bonds on the assumption that easing is imminent.
FX: policy divergence replaces growth divergence
This is where the synchronised signal most directly changes the playbook. When all four G4 economies are growing, pure growth-differential trades lose their edge. The analytical focus for FX positioning shifts to policy divergence and inflation differentials among the four currencies. If you are still positioned on a “one economy outperforms all others” thesis, this data removes the simplest version of that trade. The relative value now sits in diverging rate paths, not diverging growth.
The incoming data slate and how to read it against the PMI signal
The PMI readings are a survey signal. This week’s releases are the confirmation tests. US and eurozone preliminary Q2 2026 GDP estimates are the primary hard-data checkpoints. The BoE and BoJ decisions are the policy risk-management events.
Here is the framework for reading each outcome against the expansion thesis:
- If Q2 GDP comes in strong (US and eurozone): The PMI story is reinforced. Cyclical tilts hold. Market pricing of rate cuts gets pushed further out.
- If GDP or inflation disappoints: The PMI signal may be overstating momentum. A more balanced sector and duration stance is warranted, reducing cyclical concentration and adding some defensive or longer-duration exposure.
- If China’s official July PMIs come in above 50: The expansion is no longer a developed-market-only story. Commodity demand implications broaden, and EM FX positioning becomes a live consideration.
Beyond the headline events, a further set of releases fills out the picture: eurozone July consumer price inflation, Japan’s suite of June data covering unemployment, industrial production, and retail sales, and money supply readings for both the UK and the eurozone covering June.
What China’s official PMIs add to the picture
China’s official July PMI readings, due this week, are the variable that determines whether this is a G4 story or a global one. If China’s manufacturing PMI clears 50, the commodity demand and emerging-market currency implications expand considerably. If it stays below, the expansion remains concentrated in developed markets, which is still positive but limits the breadth of the positioning opportunity.
What the synchronisation thesis requires to hold through Q3 2026
The starting point is genuinely strong. All four G4 economies above 50, the composite above its three-year average, and back-to-back monthly acceleration is a legitimately constructive foundation for Q3.
G4 composite output: fastest pace since November, above the three-year average, with all four economies in expansion simultaneously.
Two variables are most capable of shifting the picture:
Conditions that would reinforce the thesis:
- Strong Q2 GDP prints in both the US and eurozone, confirming the PMI momentum with hard data
- BoJ and BoE decisions that hold or deliver only modest normalisation signals, avoiding a hawkish surprise
Conditions that would complicate it:
- A GDP miss in the US or eurozone, revealing that the PMIs overstated the pace of underlying activity
- Faster-than-expected BoJ normalisation or a hawkish BoE surprise that tightens financial conditions before the expansion has consolidated
The positioning implication is specific: this is not a moment to concentrate risk on a single market or a single asset class. The breadth of the expansion argues for diversified cyclical exposure with attention to policy-driven tail risks, particularly in Japan and the UK where central bank decisions land this week.
The expansion is real and broad. But treating it as a certainty through Q3 without monitoring the two policy decisions and the Q2 GDP prints is taking the most interesting variable in the story for granted.
This article is for informational purposes only and should not be considered financial advice. Investors should conduct their own research and consult with financial professionals before making investment decisions. Forward-looking statements regarding central bank decisions, GDP outcomes, and asset class performance are speculative and subject to change based on market developments and incoming data.