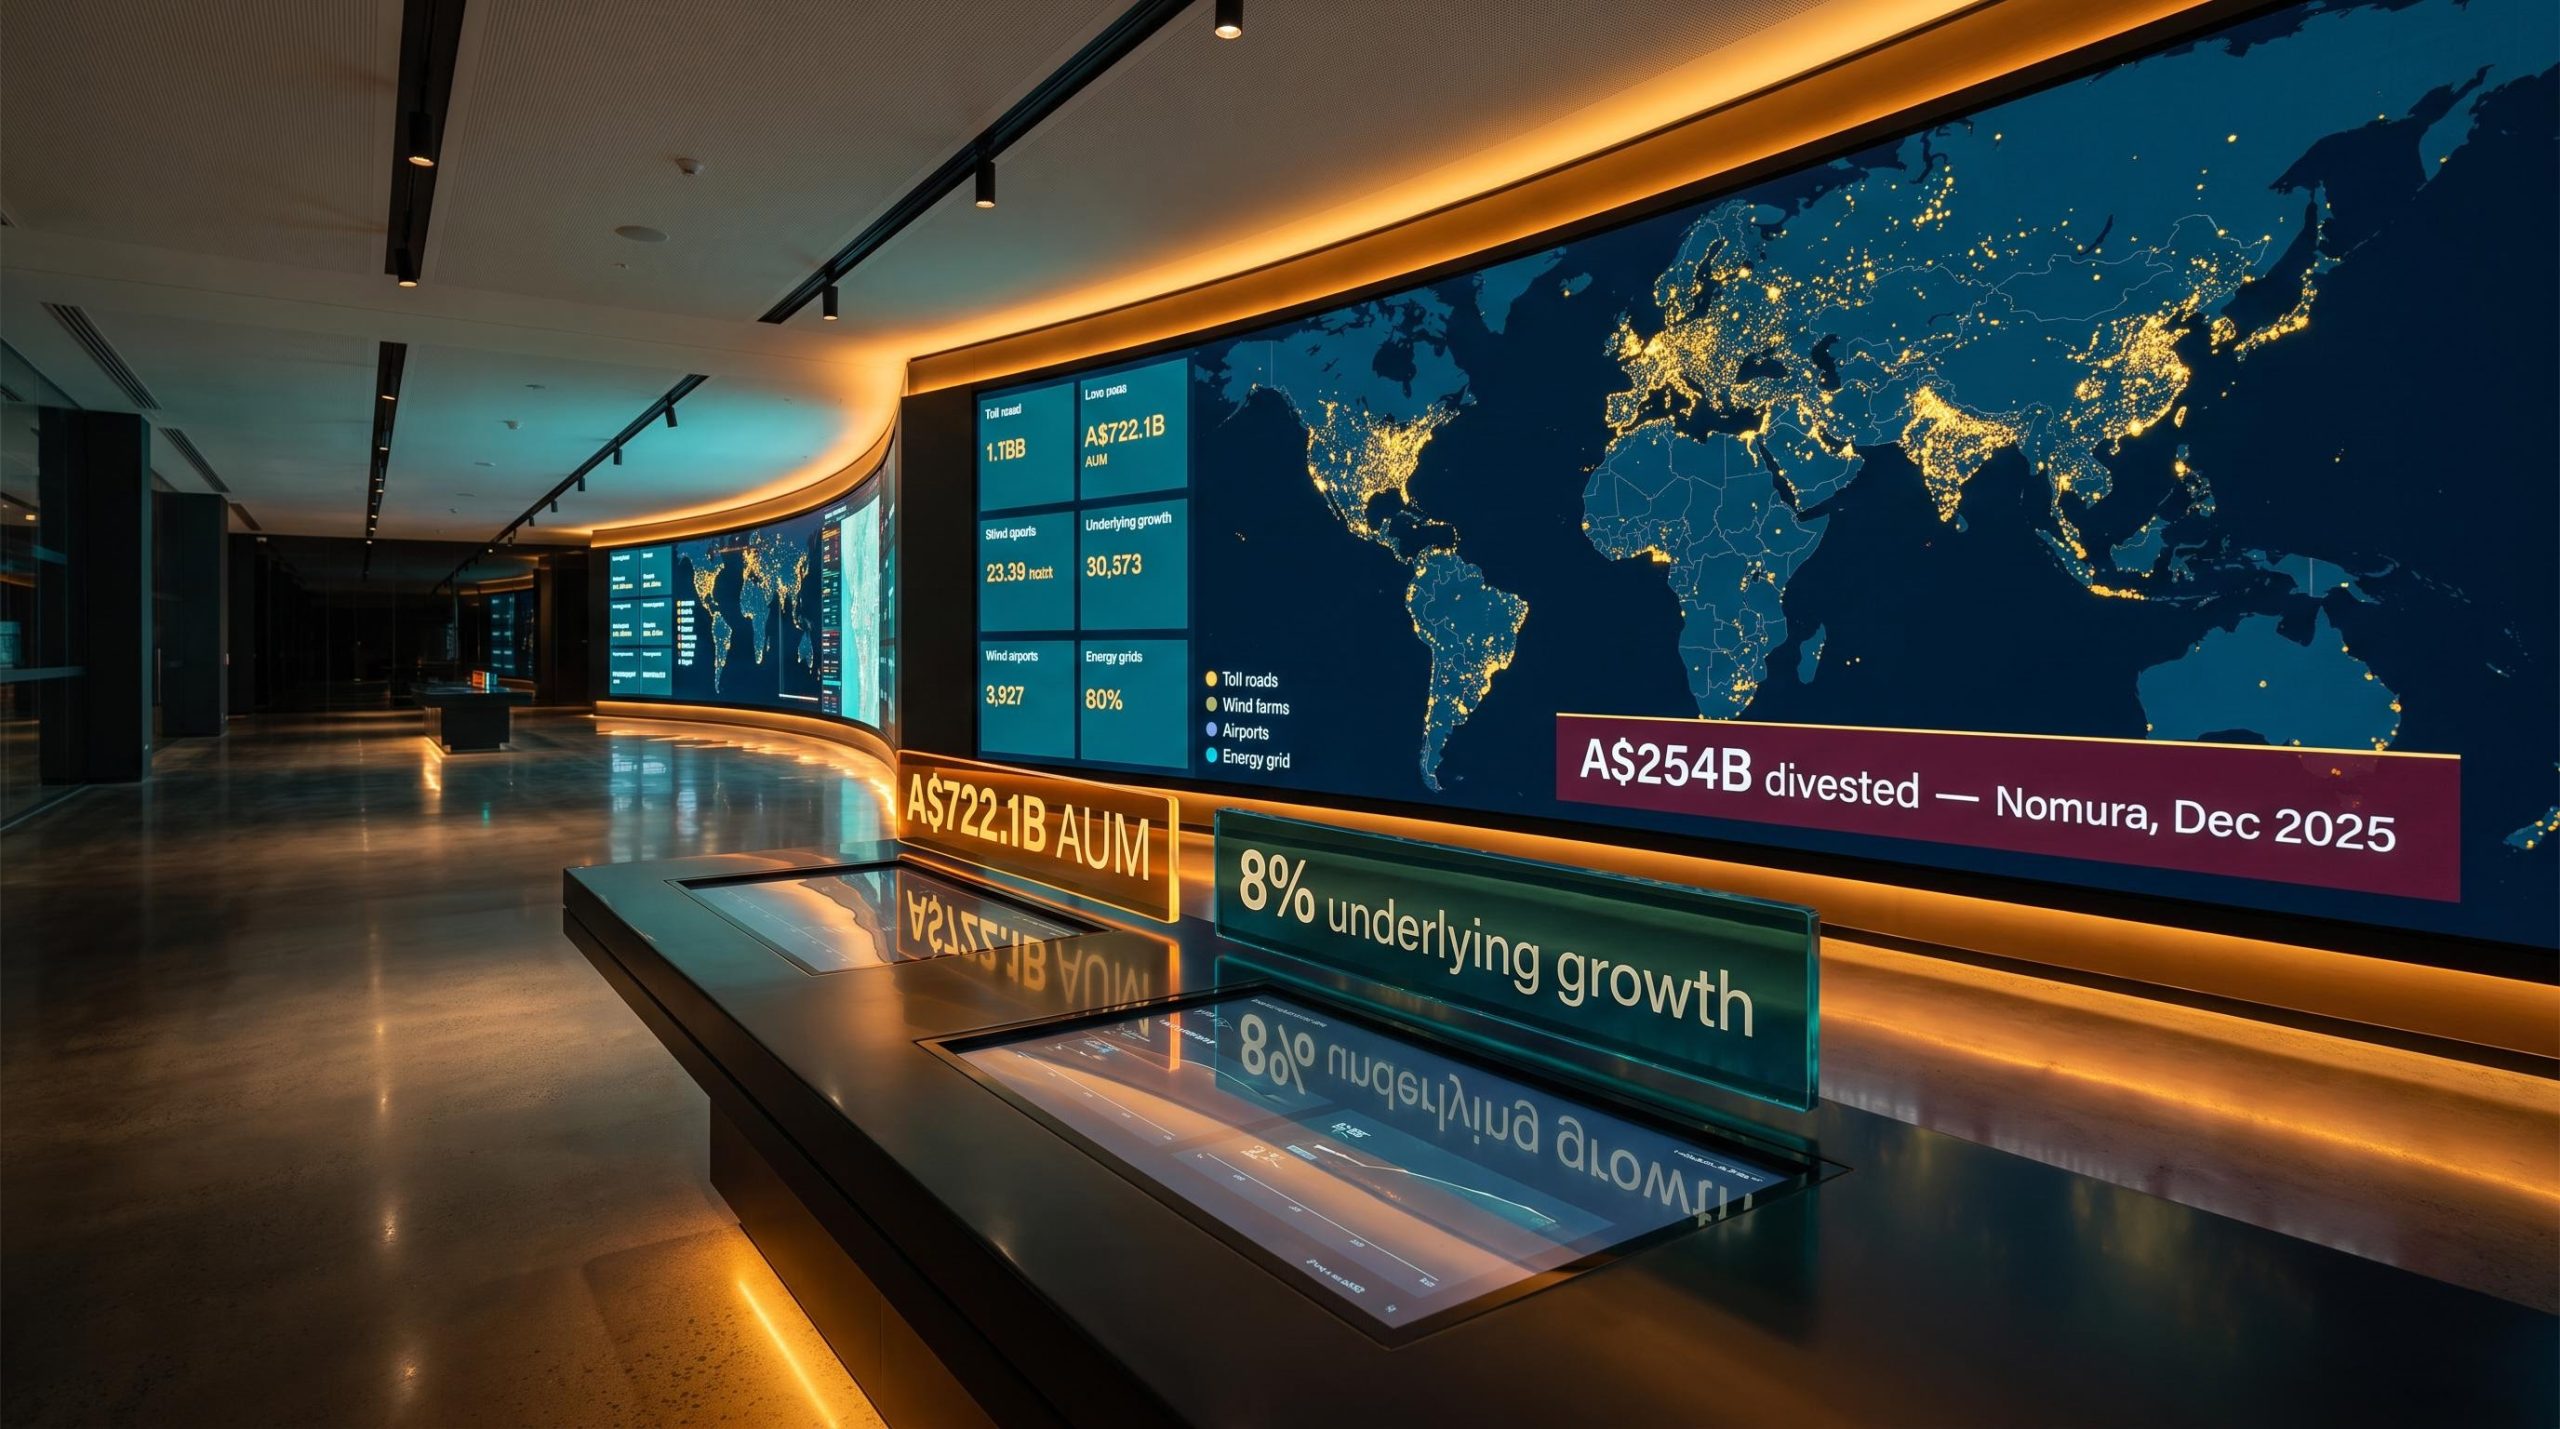
Most investors who recognise the Macquarie name picture an investment bank, or perhaps the infrastructure operator that drew years of public scrutiny over toll road pricing and airport charges. Neither picture is wrong, but neither captures where the money actually comes from. Macquarie Asset Management (MAM) is a A$722.1 billion asset management platform that earns the bulk of its revenue before a single trade is placed, by locking up institutional capital in private funds for years at a time.
Understanding MAM as a standalone business model matters more now than it has in years. The December 2025 divestiture of its public markets book to Nomura reshaped the division’s profile, and a generational US infrastructure investment cycle is building behind it. The investor who understands how MAM actually works, where its fees come from, why it sold a quarter-trillion dollars of assets under management, and what the next decade’s deal pipeline looks like, has a sharper lens on Macquarie Group’s earnings quality than one who reads headline AUM figures and stops there.
Here is the architecture of one of the world’s most specialised asset managers: how it makes money, where its competitive edge actually sits, and what the next chapter looks like in practical terms.
What Macquarie Asset Management actually is (and what it is not)
Start with the label. MAM is an asset manager. That much is accurate. But the label tells you almost nothing about the business underneath.
Macquarie Group operates four major divisions: Macquarie Capital (advisory and principal investment), Banking and Financial Services, Commodities and Global Markets, and Macquarie Asset Management. MAM is the one that houses the group’s fee-earning, institutionally anchored investment platform.
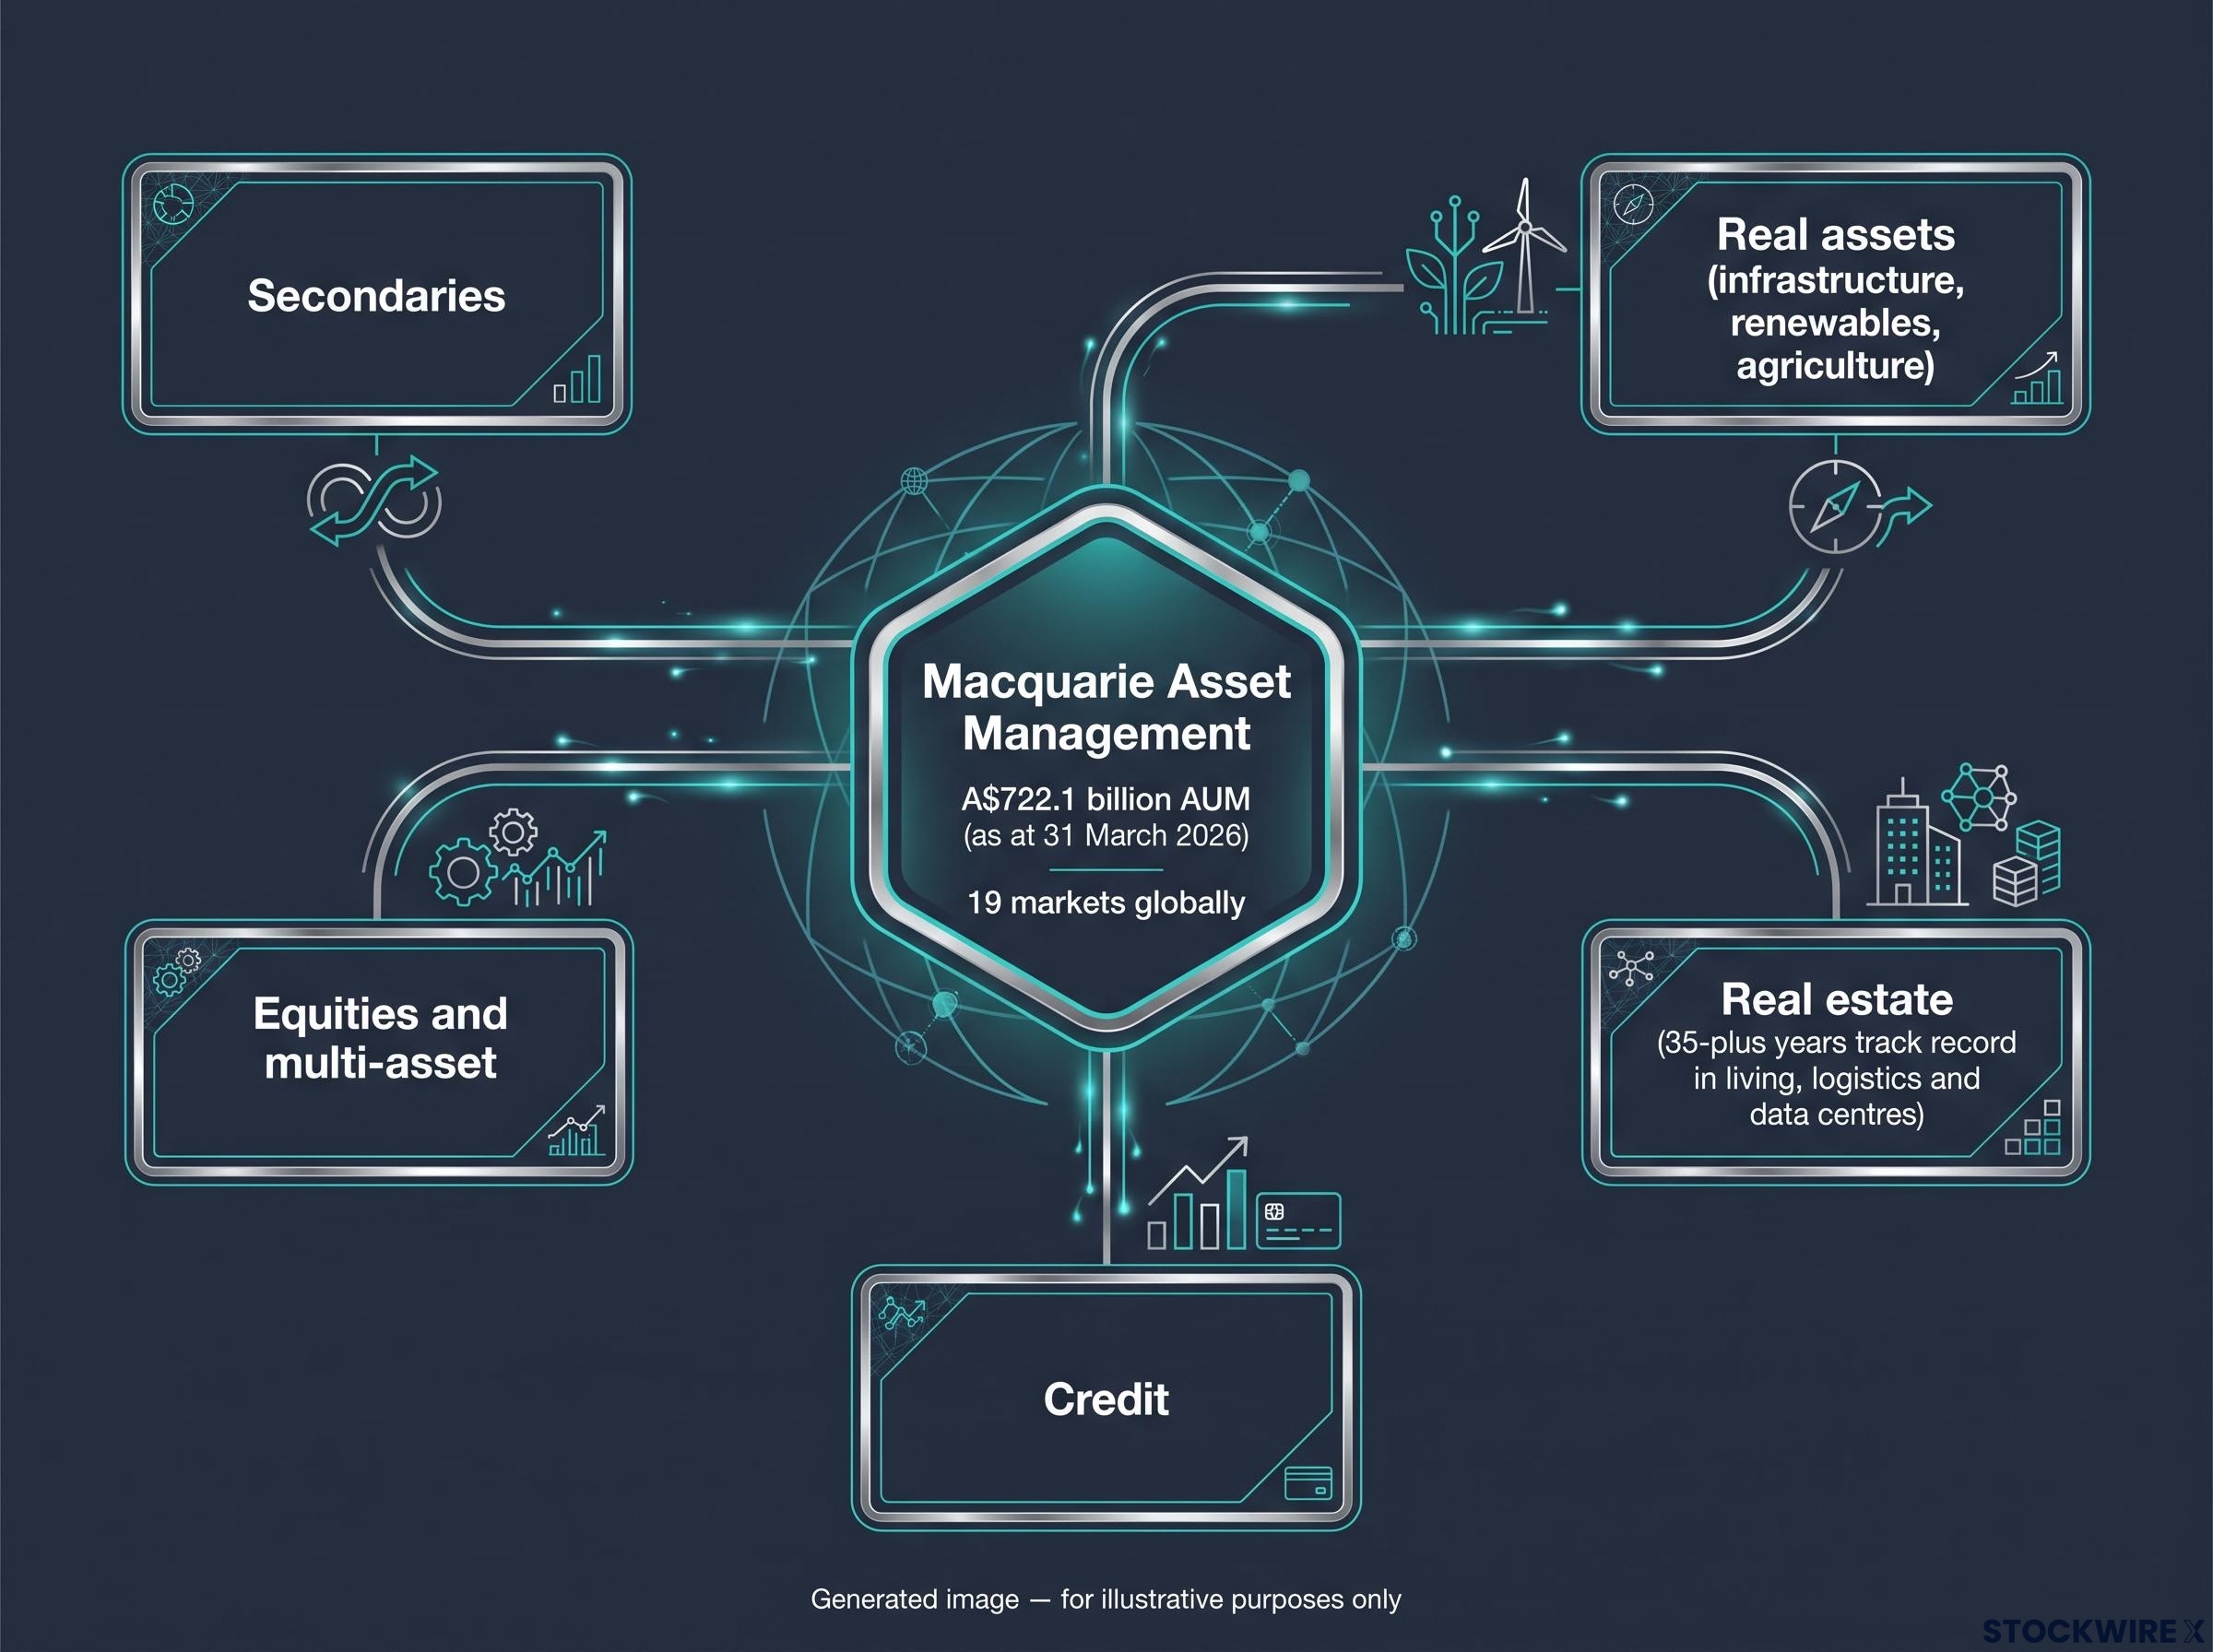
What makes it different from a typical fund manager is what it invests in and how it structures its capital. MAM is built around real assets, with infrastructure as the dominant strategic pillar. Its five investment capability areas are:
- Real assets (infrastructure, renewables, agriculture)
- Real estate (a track record spanning 35-plus years, concentrated in living, logistics and data centres)
- Credit
- Equities and multi-asset
- Secondaries
A$722.1 billion in assets under management as at 31 March 2026, with portfolio companies operating across 19 markets globally.
MAM is positioned as a top-50 global asset manager and one of the world’s largest dedicated infrastructure managers, competing at the institutional level with Blackstone, Brookfield and Global Infrastructure Partners.
The origin point matters. Macquarie began its infrastructure investment business in 1994 with the Hills Motorway in Sydney. That is not just historical colour. It means MAM entered infrastructure as an institutional asset class before most of its current competitors existed in this space. Three decades of accumulated regulatory knowledge, operational experience and institutional relationships is something later entrants cannot compress into a few fundraising cycles.
When big ASX news breaks, our subscribers know first
How MAM makes its money: the fee architecture explained
Fee architecture is the single most important variable in understanding whether an asset manager’s earnings are durable or cyclical. This section gives you the mechanics.
Management fees: the predictable engine
In a private markets fund, investors commit capital upfront. That capital is locked up for the life of the fund, typically seven to twelve years. MAM charges management fees on that committed or invested capital, which means revenue flows once the fund closes, regardless of what public markets are doing on any given day. Market volatility does not trigger redemptions, because investors cannot redeem. The lock-up period insulates this income stream from the short-term sentiment swings that erode public fund AUM.
This is the base engine: predictable, recurring, and insensitive to daily market pricing.
Carried interest: the performance layer
Performance fees, known as carried interest, work differently. These are a share of profits above a preferred return or hurdle rate, which is a minimum return threshold that investors must receive before the manager earns any performance fee. Carried interest crystallises when assets are actually sold, not when they appreciate on paper.
The hurdle rate embedded in a private fund structure is the mechanism that determines whether investors or managers capture first claim on returns, and the specific rate chosen has material implications for how performance fees accrue across different deal environments.
That timing dependency is important. A fund can own infrastructure assets that have doubled in appraised value, but until those assets are sold and the profits realised, the performance fee does not convert to income. Carried interest arrives in lumps tied to the deal cycle: exits either happen or they do not.
The December 2025 Nomura divestiture removed MAM’s public markets book, concentrating the remaining platform around these private markets mechanics. For you, that means base management fee revenue is now more predictable quarter to quarter, but performance fee income is more binary and harder to model.
| Attribute | Private markets strategies | Public markets strategies |
|---|---|---|
| Fee rate profile | Higher headline rates | Lower headline rates |
| Revenue predictability | High (locked-up capital) | Lower (flow-sensitive) |
| Sensitivity to market levels | Low for base fees | High |
| Key income driver | Management fees + carried interest on exits | Management fees tied to AUM levels |
Where MAM’s competitive edge comes from
The competitive moat in infrastructure asset management is not a brand claim. It is a structural accumulation of things that take decades to build, and you should understand the three components that make MAM’s position genuinely difficult to replicate.
A competitive moat in asset management is built from overlapping sources: intangible assets accumulated through decades of regulatory navigation, switching costs embedded in long-duration institutional relationships, and the efficient scale that comes from operating the same infrastructure playbook across 19 markets simultaneously.
First-mover depth. Infrastructure as an institutional asset class was pioneered in the 1990s. Macquarie was among the earliest movers, and that 30-plus year head start has produced something specific: deep operational know-how across toll roads, airports, energy networks, renewables and digital infrastructure, built across 19 markets with local teams, regulatory relationships and governance frameworks already in place. Later entrants can raise capital, but they cannot compress decades of on-the-ground operating experience.
Group ecosystem coherence. MAM does not operate in isolation. It sits alongside Macquarie Capital, a sector-focused advisory arm with deep infrastructure and energy expertise. Advisory relationships, sector insight and deal flow on one side; long-duration capital and operational expertise on the other. This two-way feed creates a sourcing advantage that a standalone manager cannot replicate.
The institutional relationship flywheel. MAM raises capital from pension funds, sovereign wealth funds and insurers across multiple fund vintages. Repeat relationships with the same institutional investors reduce the cost and friction of capital formation with each successive fundraise. Morningstar analyst Nathan Zaia identifies MAM’s specialised infrastructure and real estate expertise as a primary competitive differentiator, and observes that incumbent managers with proven track records in this space tend to capture a disproportionate share of new allocations flowing into the category. That concentration of flows among incumbents is a structural tailwind for MAM’s fundraising, and a meaningful barrier for any new entrant trying to compete.
The three core moat components, summarised:
- First-mover depth across 30-plus years and 19 markets
- Strategic coherence with Macquarie Capital’s advisory ecosystem
- Institutional relationship flywheel across multiple fund vintages
The Nomura deal and what it signals about MAM’s direction
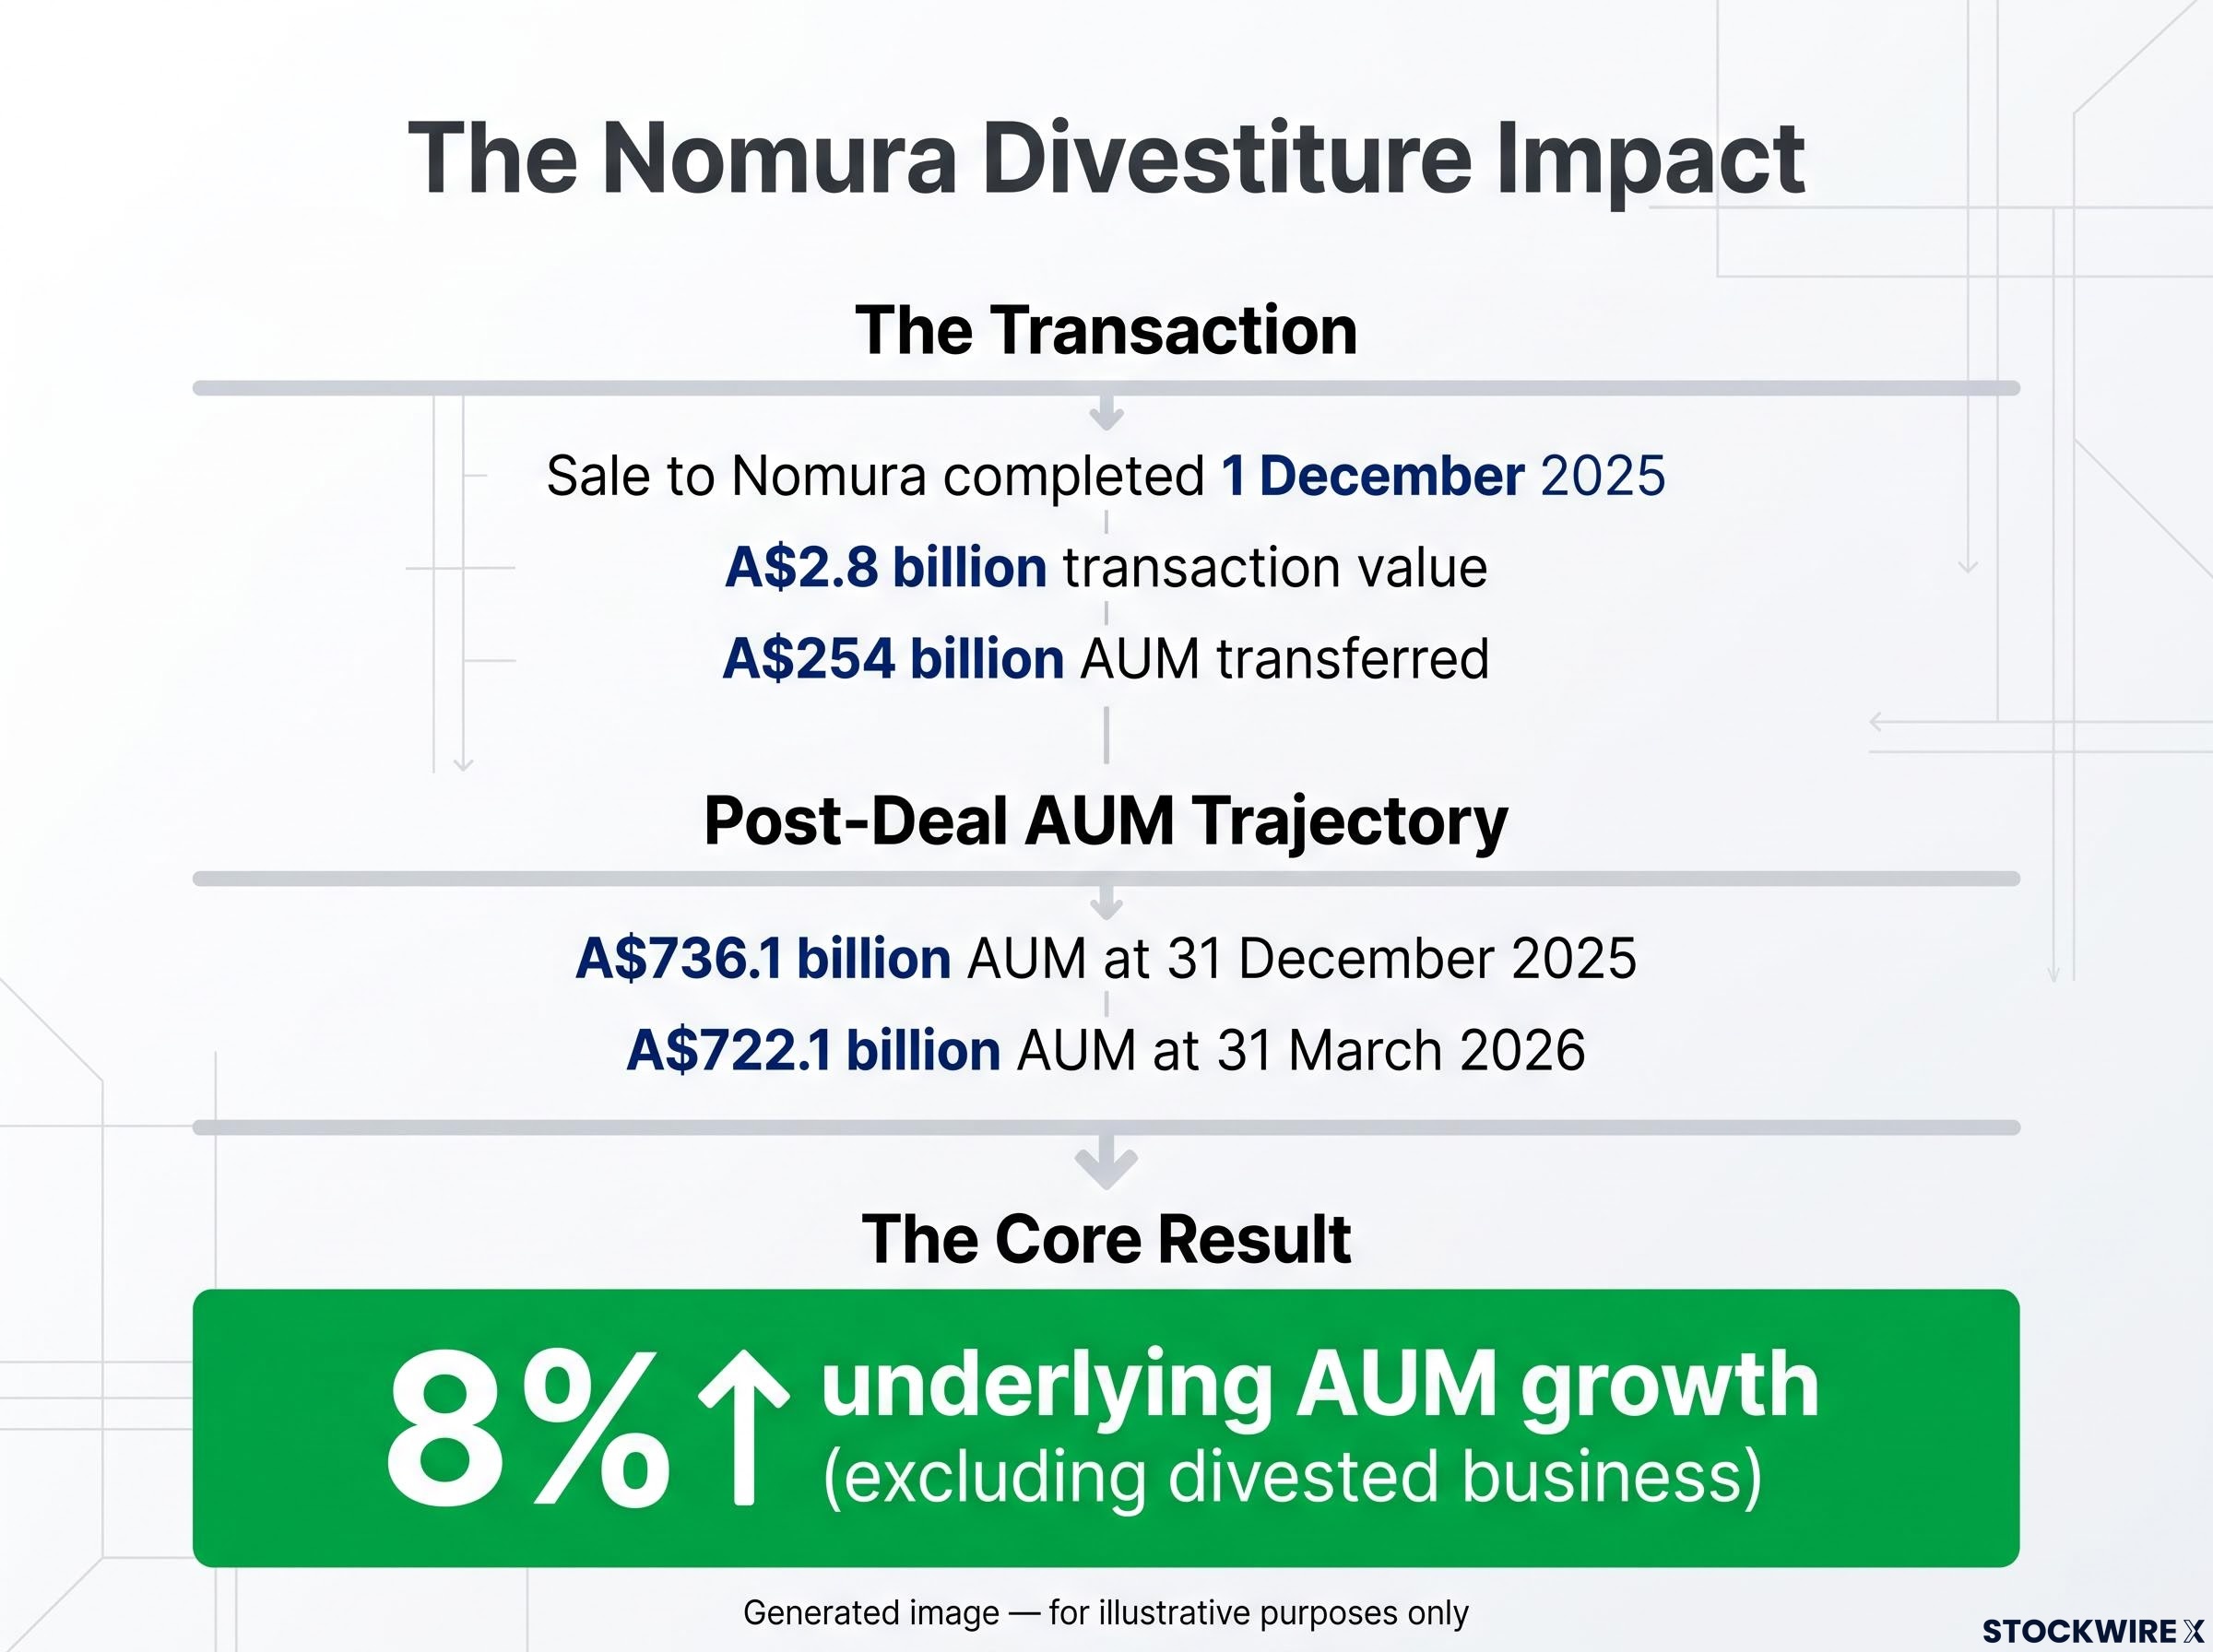
The headline read like a contraction. Macquarie sold its North American and European public investments business to Nomura, completed on 1 December 2025, for approximately A$2.8 billion. The transaction transferred approximately A$254 billion of assets under management. On paper, the division got smaller.
The strategic logic tells a different story.
- Pre-deal profile: MAM managed both public and private market strategies. The public markets book carried lower fee rates, was more sensitive to market levels and fund flows, and contributed a less stable earnings profile compared to the private infrastructure and real assets platform.
- Transaction mechanics: The sale removed the public book in a single transaction, concentrating the remaining AUM around the strategies where Macquarie has the deepest expertise and the highest-quality fee economics.
- Post-deal growth trajectory: MAM AUM stood at A$736.1 billion at 31 December 2025 and A$722.1 billion at 31 March 2026. The Q1 2026 decline reflects foreign exchange headwinds and other divestments, not institutional outflows. Critically, AUM was up 8% year-on-year excluding the divested business, driven by increased investments, net asset valuation changes and net flows.
8% underlying AUM growth (31 March 2026 versus 31 March 2025, excluding the divested business)
That 8% figure is the number that matters for the long-term earnings case. It tells you that the remaining private markets platform is growing on its own terms. The headline AUM reduction was a deliberate editorial choice about business mix, not a symptom of institutional outflows or competitive weakness. If you are tracking Macquarie’s AUM trajectory without this context, you are reading the wrong number.
Why the US infrastructure decade matters for MAM
The macro opportunity is large. The United States is committing substantial public and private investment to infrastructure renewal over the coming decade: transportation networks, electricity systems, grid modernisation, renewables, transmission and storage. Recent federal legislation has earmarked significant funding across these categories. Morningstar analyst Nathan Zaia identifies this sustained period of elevated US infrastructure spending as a meaningful tailwind for MAM.
The institutional appetite behind this tailwind is measurable: private infrastructure fundraising trends tracked across closed-end vehicles show a nearly 60 percent increase in fundraising in 2025 to close to $200 billion, with a majority of institutional investors planning to increase their allocations to infrastructure over the following three years.
Where the opportunity is real
Private capital plays a role where projects are structured as public-private partnerships (PPPs), arrangements where governments and private investors share the financing, construction and operation of infrastructure assets. Corporate spin-offs of asset-heavy businesses into investable vehicles create another deployment channel. MAM’s 30-plus years of experience in PPP structures, regulated networks and renewables, across a 19-market operating footprint, positions it for the type of complex, policy-linked deals the US pipeline will generate.
The infrastructure spending categories most likely to produce private fund opportunities include:
- Public-private partnership structures for transport, social infrastructure and utilities
- Energy transition assets: renewables, transmission, battery storage
- Corporate infrastructure spin-offs into standalone investable vehicles
Where the caveats apply
Not all public infrastructure spending translates into deployable private capital. Government-owned and government-operated projects bypass private fund structures entirely. The distinction matters: a reader who equates headline federal spending with MAM’s addressable market is overestimating the opportunity.
Competition is intense. Blackstone, Brookfield and Global Infrastructure Partners are all targeting the same US deal flow. Fundraising cycles and deployment windows must align with actual deal timing to convert macro tailwinds into AUM growth and performance fees. MAM’s experience gives it an edge, but that advantage is not automatic. Execution, competitive pricing and timing discipline will determine how much of the macro opportunity actually flows through to fee income.
The structural risks that come with scale in private infrastructure
The growth thesis is real, but so are the structural risks that come with the territory. These are not idiosyncratic failures; they are features of the private markets model that any informed reader should hold alongside the opportunity case.
Asset-level risks
Illiquidity and valuation. Private infrastructure assets are appraised rather than continuously marked to market. An appraisal is a periodic valuation estimate, not a live market price. This creates potential gaps between carrying values and achievable exit prices, particularly in stressed environments. For you, this means that paper performance and realised performance can diverge meaningfully. Carried interest depends on exits, not appreciation. A period of quiet deal markets can produce a significant gap between AUM growth and actual fee income.
Private markets valuation opacity creates a structural lag between deteriorating credit conditions and the point at which fund carrying values reflect those conditions, a gap that regulators across multiple jurisdictions have begun flagging as a systemic concern at scale.
Regulatory and political exposure. Infrastructure assets underpin economies and communities. They are structurally exposed to changes in concession terms, tariff frameworks, foreign-ownership rules and environmental regulation. Across a 19-market portfolio, the surface area for regulatory risk is substantial and ongoing.
Platform-level risks
Post-divestiture concentration. Removing the public markets book improved earnings quality in normal conditions, but it also reduced diversification across market cycles. Performance fee income is now more dependent on exit activity, which can be delayed or suppressed in constrained deal environments.
Fundraising dependency. MAM’s fee revenue growth relies on continued institutional appetite for infrastructure and real assets, and on successful capital formation in new fund vintages. The long duration of private vehicles can mask sensitivity to allocation shifts, but the structural dependency on fundraising is present across the platform. Macquarie’s emphasis on responsible management and long-term outcomes for communities signals the governance investment required to manage operational, safety, cyber and reputational risk at this scale.
| Risk category | Primary mechanism | MAM-specific context |
|---|---|---|
| Illiquidity and valuation | Appraisal-based pricing; exit-dependent carry | Carried interest crystallises on sales, not NAV growth |
| Regulatory and political | Policy changes to tariffs, concessions, ownership rules | 19-market portfolio creates broad regulatory surface area |
| Concentration | Reduced diversification post-Nomura divestiture | Earnings more dependent on private markets exit cycles |
| Fundraising dependency | Fee growth requires continued institutional allocations | Long fund durations can mask allocation sensitivity |
A leaner MAM, and what the next chapter looks like
The picture that emerges is specific. The Nomura divestiture produced a MAM that is smaller by AUM but more concentrated in the strategies where Macquarie has its deepest competitive advantage. The 8% underlying growth rate post-divestiture confirms the remaining platform has positive organic momentum. Morningstar analyst Nathan Zaia characterises MAM as a key source of long-duration, fee-based earnings for Macquarie Group, and that characterisation is more accurate now than before the sale.
The US infrastructure decade is a genuine but conditional tailwind. The opportunity is structurally aligned with MAM’s capabilities, its 30-plus years of PPP and regulated asset experience across 19 markets, but conversion into fee income depends on execution, deal pricing discipline and the timing of fundraising cycles.
Three variables will determine whether the forward thesis plays out:
- Sustained institutional appetite for infrastructure allocations across new fund vintages
- Exit market conditions that allow performance fees to crystallise at scale
- US deal flow share won against global competitors including Blackstone, Brookfield and GIP
The bull case for MAM is not about AUM headline size. It is about earnings quality. A smaller, more concentrated private markets platform with genuine infrastructure expertise, entering a decade that is structurally well-suited to that expertise, is a more defensible earnings engine than a larger but more generic asset manager. That is the distinction worth understanding.
For investors wanting to place MAM’s earnings profile in the context of the broader alternatives sector, our full explainer on alternative asset manager fee economics examines how KKR, Blackstone, and Macquarie Group itself are compounding fee-related earnings faster than their asset bases grow.
This article is for informational purposes only and should not be considered financial advice. Investors should conduct their own research and consult with financial professionals before making investment decisions. Past performance does not guarantee future results. Financial projections are subject to market conditions and various risk factors.
—