The carry trade is one of the most popular strategies in forex and bond markets, built on a straightforward premise: borrow in a low-yielding currency, invest in a higher-yielding one, and pocket the difference. Summer, the logic goes, is when this trade works best, because volatility drops, markets thin out, and the yield just accumulates.
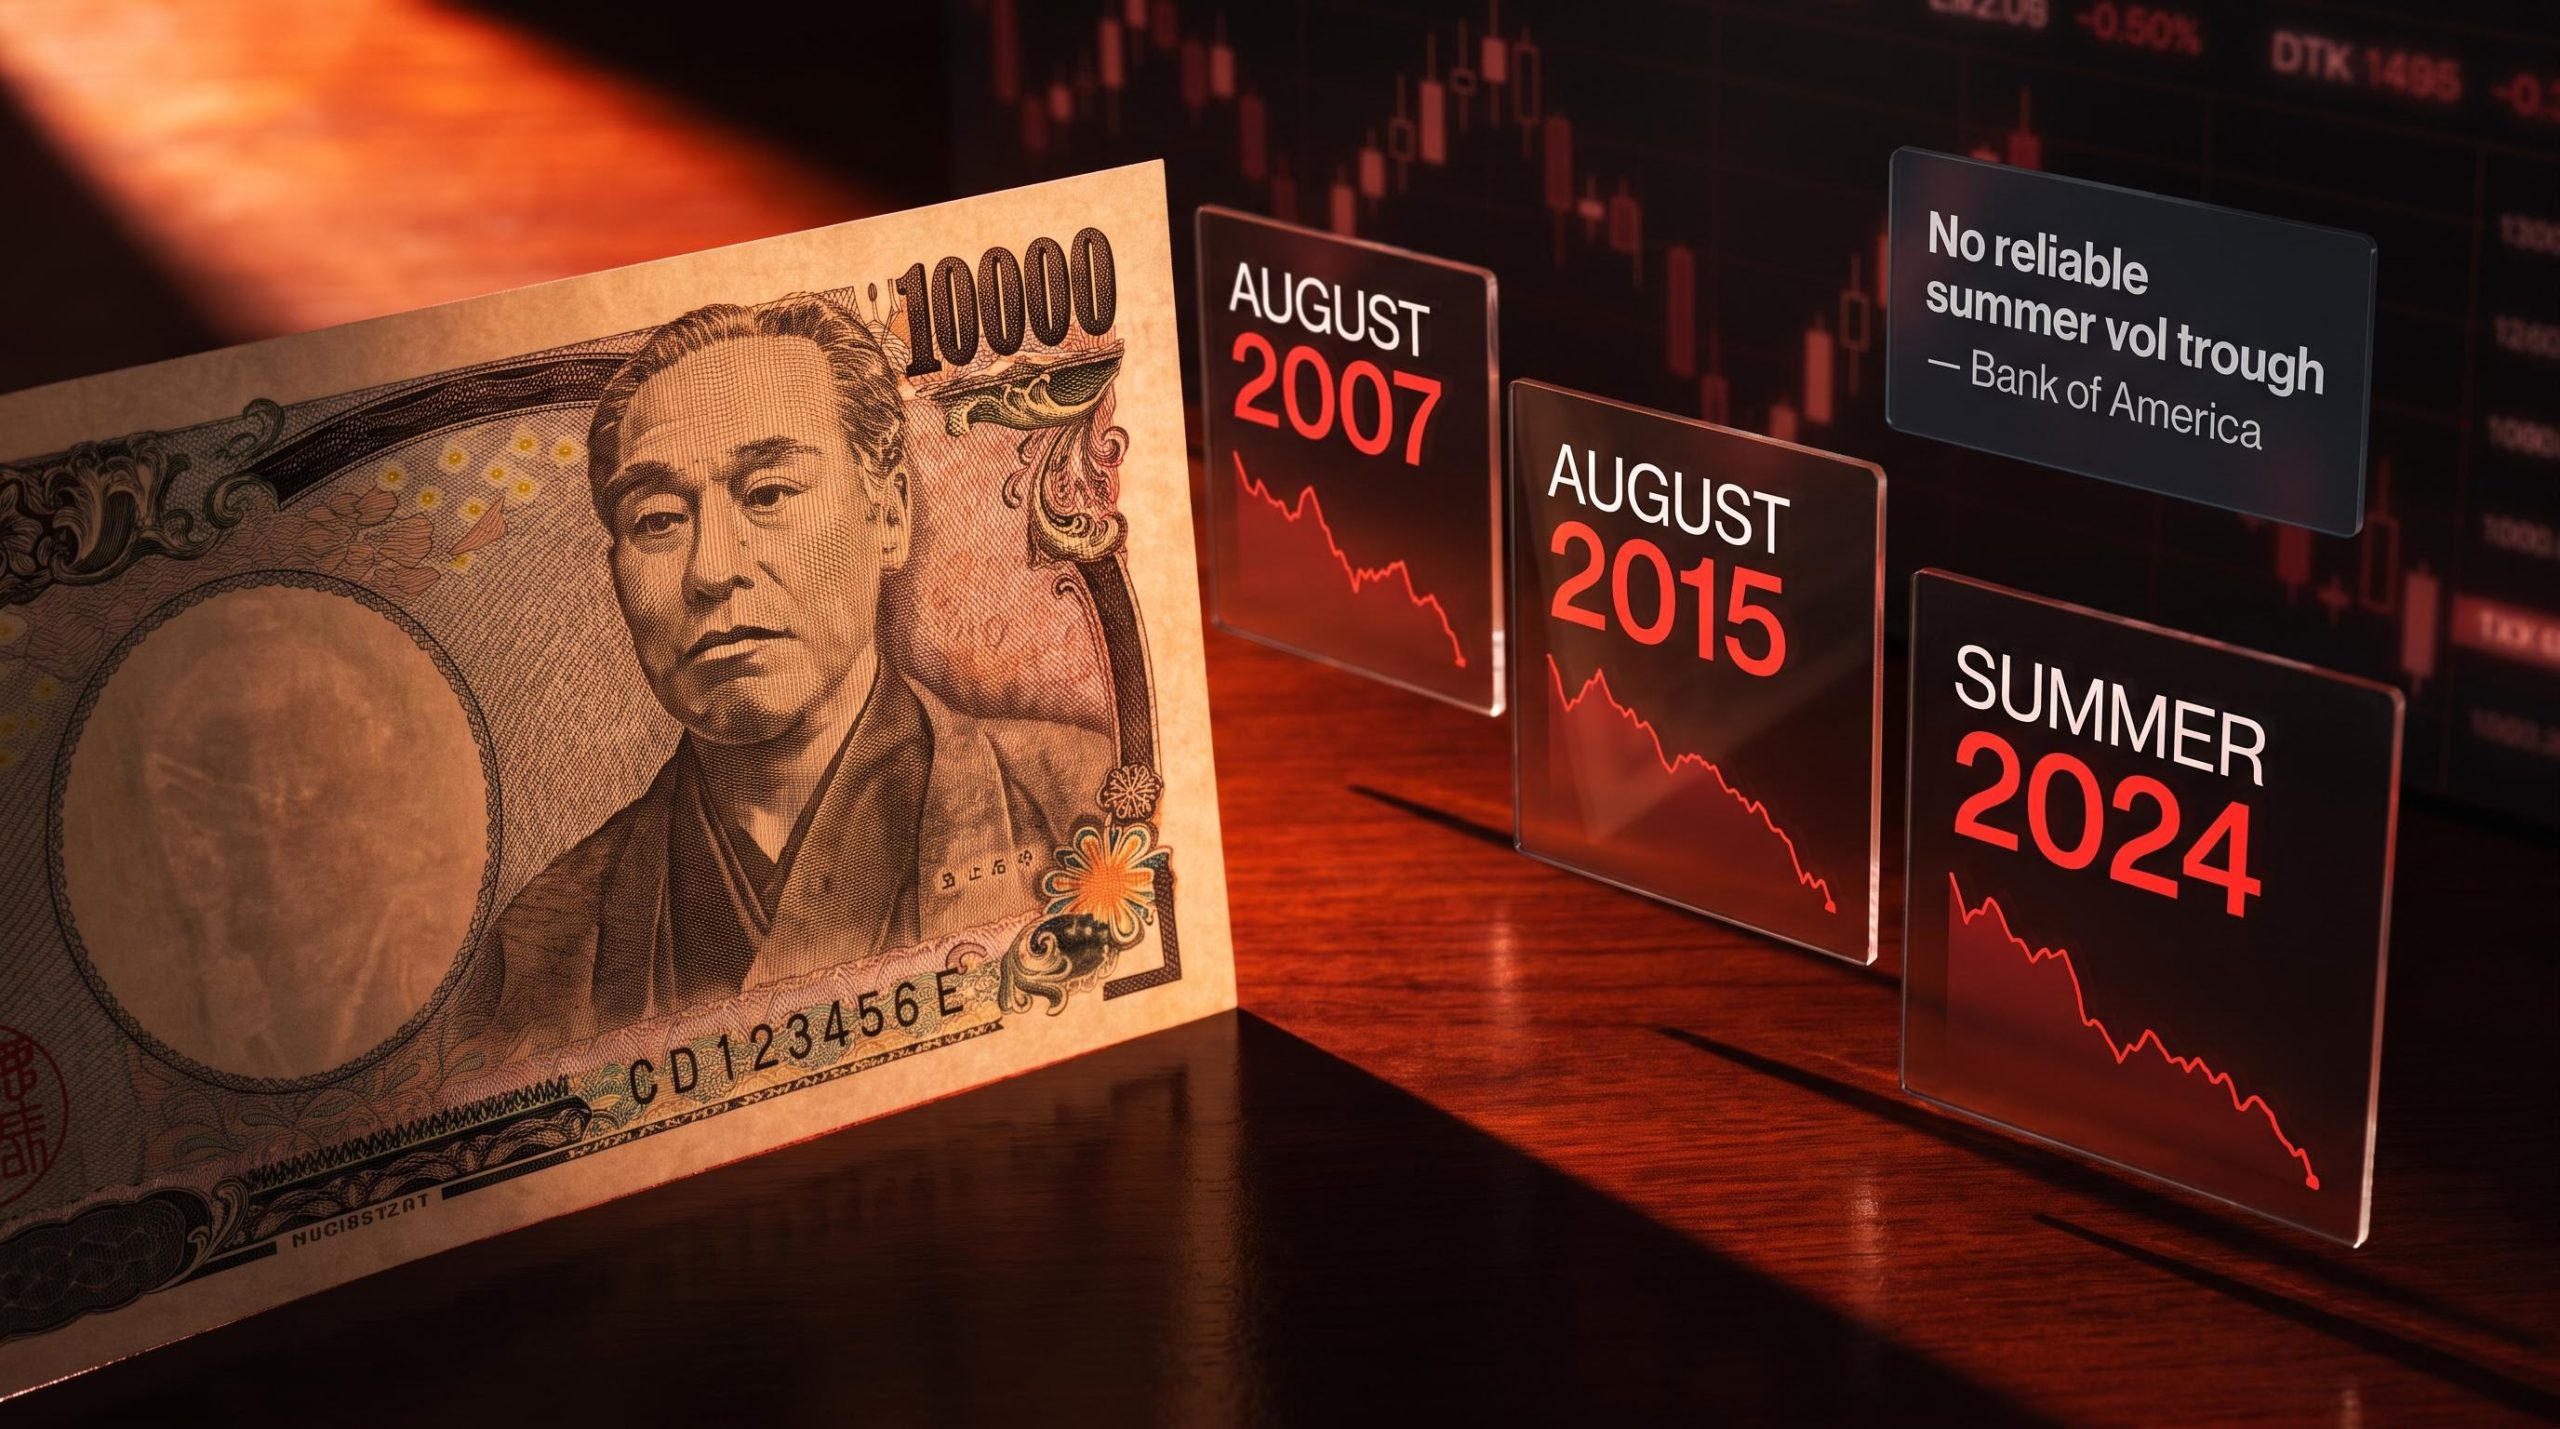
Bank of America has tested that thesis directly, and the conclusion is uncomfortable: the data do not bear out any structural advantage that July and August offer carry investors over other months of the year. The seasonal story investors tell themselves about summer calm is not backed by the data on realised volatility, and the episodes where carry has blown up most violently, August 2007, August 2015, summer 2024, all happened inside the supposedly safest window on the calendar.
Here is what the evidence actually shows about the summer carry trade, and what it means for how you assess carry risk in any month following a central bank decision.
How carry trades actually work, and why volatility is the central variable
A carry trade works by borrowing in a currency with low interest rates, typically the Japanese yen or Swiss franc (known as funding currencies), and deploying that capital into higher-yielding currencies or fixed-income assets. The profit comes from the interest rate differential between the two, collected over time.
The catch is the payoff structure. Carry income accumulates slowly, drip by drip. But if the funding currency suddenly appreciates, those months of accumulated yield can be wiped out in hours. This is the asymmetry at the heart of every carry position: gains are incremental, losses are fast and potentially severe.
The yen carry trade mechanics that make borrowing cheap and investing in higher-yielding assets attractive have persisted even as the Bank of Japan raised rates to a 31-year high, because a spread of roughly 2.5%-2.75% over U.S. rates still makes the structural arbitrage compelling for leveraged participants.
That asymmetry makes carry performance directly dependent on one variable above all others: volatility. The strategy’s returns are gated by how stable the environment stays.
- Carry thrives when: volatility is low, rate differentials are stable or widening, funding currencies are depreciating or flat, and credit conditions are healthy.
- Carry unravels when: volatility spikes, funding currencies appreciate sharply, risk sentiment deteriorates, and crowded positions trigger forced liquidation.
Any assumption that reduces your perception of downside risk, including a seasonal one, directly increases your exposure to the strategy’s worst-case outcome. That is why the summer volatility question is not academic. If the volatility assumption is wrong, the entire seasonal rationale collapses.
When big ASX news breaks, our subscribers know first
What Bank of America’s analysis actually found about summer volatility
The seasonal thesis predicts a reliable drop in volatility during July and August, creating a structurally favourable window for carry. Bank of America tested that prediction against historical data and found a different picture.
Bank of America analysts found limited statistical support for a reliable “summer carry bias.” When examining historical records, no consistent or meaningful summer trough in realised interest-rate volatility emerges. Volatility shifts occur across all seasons, and some of the more pronounced moves take place in the months preceding summer.
There is a dip in implied volatility around mid-year, but the source of that dip matters. Implied volatility is derived from options pricing and reflects how much compensation the market demands for bearing risk. A mid-year decline in implied vol does not necessarily mean risk has fallen. It may instead indicate that the shift is relatively modest in scale and reflects a compression in risk premia rather than any genuine improvement in the underlying uncertainty.
- What the seasonal thesis assumes: summer volatility is structurally lower, carry income is more secure, and the risk-reward profile improves.
- What the data show: summer brings no reliable reduction in realised rate volatility, any dip in implied vol appears to capture shrinking risk premia rather than true calm, and carry outcomes are driven by macro conditions that pay no attention to the time of year.
When implied volatility falls because markets are demanding less compensation for risk rather than because risk has genuinely declined, carry positions are being built on complacency. That is precisely when the payoff skews most dangerously against you.
The gap between implied versus realised volatility is one of 2026’s most consequential market dynamics, with implied vol running above 23% while realised vol sits below 14%, a divergence that mirrors precisely the complacency signal the current article identifies as the most dangerous regime for carry positioning.
The liquidity paradox that makes quiet summers dangerous
Summer markets are typically quieter, but the source of that quiet is the problem. Trading volumes drop. Market-maker activity contracts. Institutional desks run lighter staffing. The result is thinner liquidity, not lower risk.
This creates a structural irony. The feature that gives summer its calm reputation is the same mechanism that makes carry reversals more violent when something goes wrong. Thin liquidity means:
- Larger price impact per unit of order flow: fewer counterparties on the other side of each trade means prices move further on smaller volumes.
- Fewer counterparties to absorb shocks: when a macro event hits, the bids that would ordinarily slow a decline are absent or shallow.
- Crowded positioning amplification: when carry trades are popular and need to unwind simultaneously, thin summer markets accelerate the cascade rather than cushioning it.
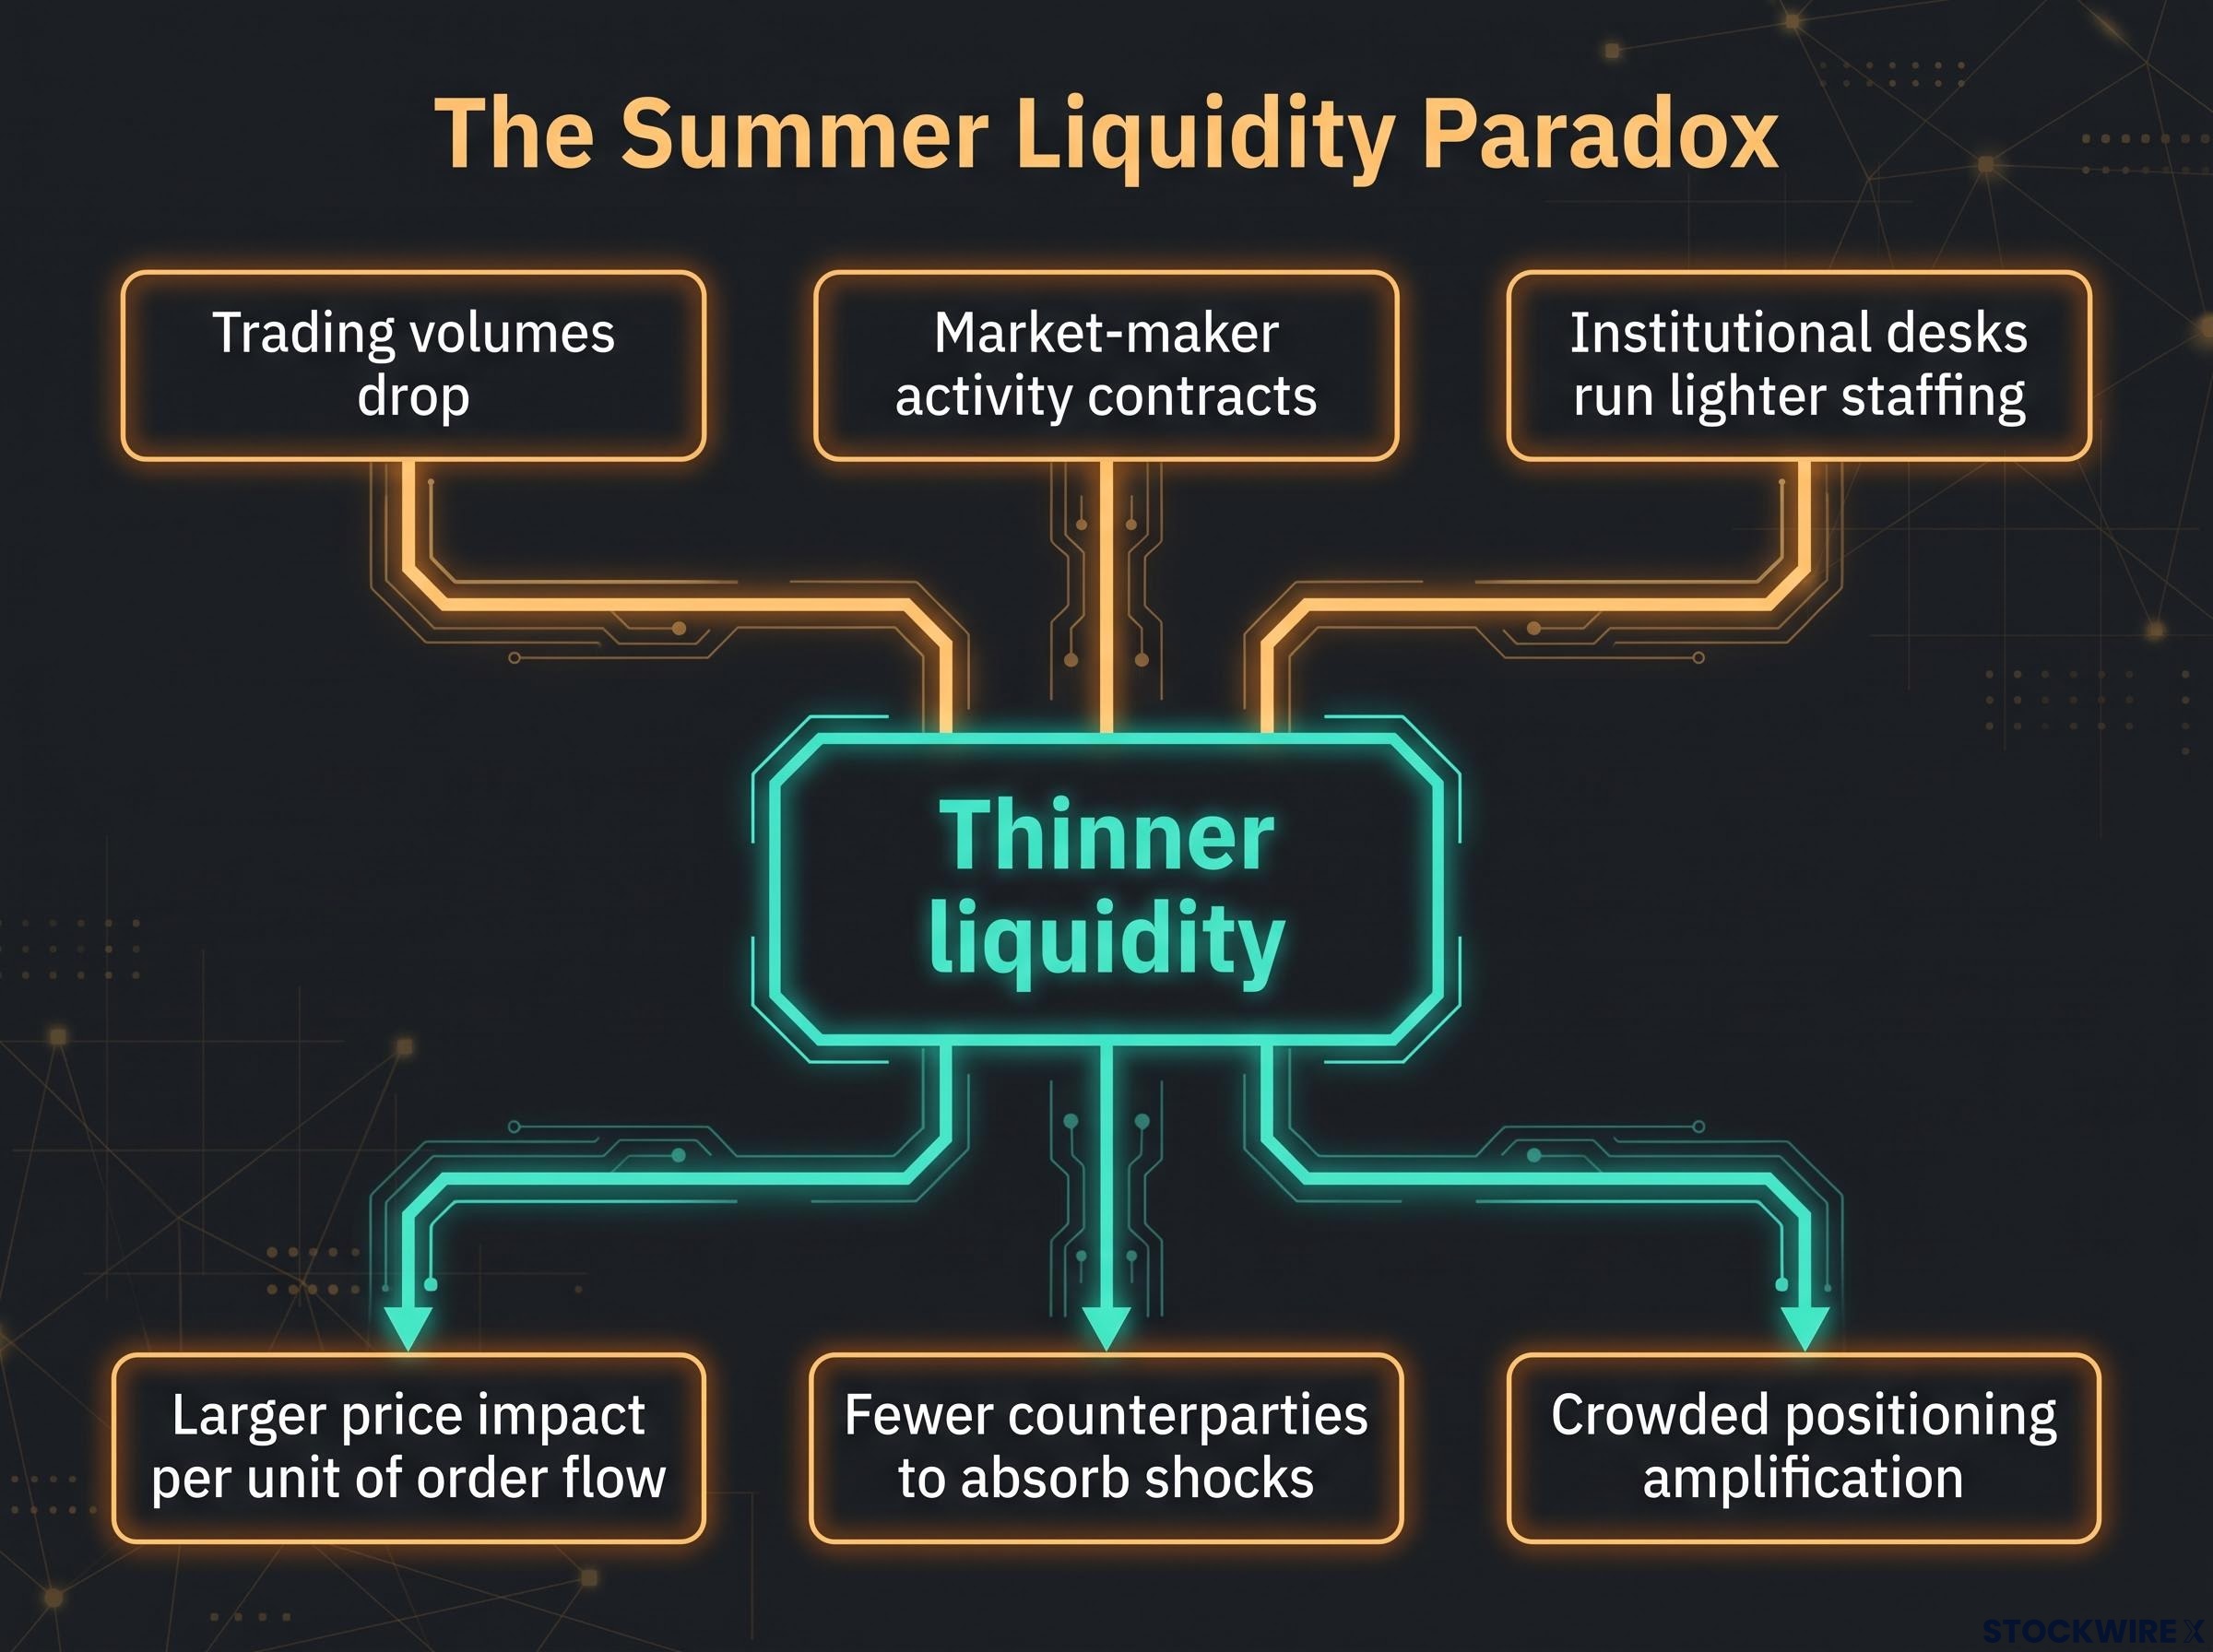
Bank of America’s analysis highlights that reduced market depth during summer months can cause volatility to amplify sharply once an unexpected shock materialises. Lower traded volume does not reduce your risk as a carry investor; it concentrates it. A shock that would be absorbed gradually in a deep market can instead cascade through your position in hours.
Federal Reserve research on liquidity and price amplification confirms that order flow imbalances produce outsized price moves when market depth is thin, a dynamic that directly explains why carry reversals accelerate rather than dissipate during periods of low trading volume.
Three Augusts that proved the seasonal thesis wrong
Three structurally distinct episodes, each occurring in the calendar window that the seasonal thesis claims is safest, demonstrate how reliably macro shocks override seasonal assumptions.
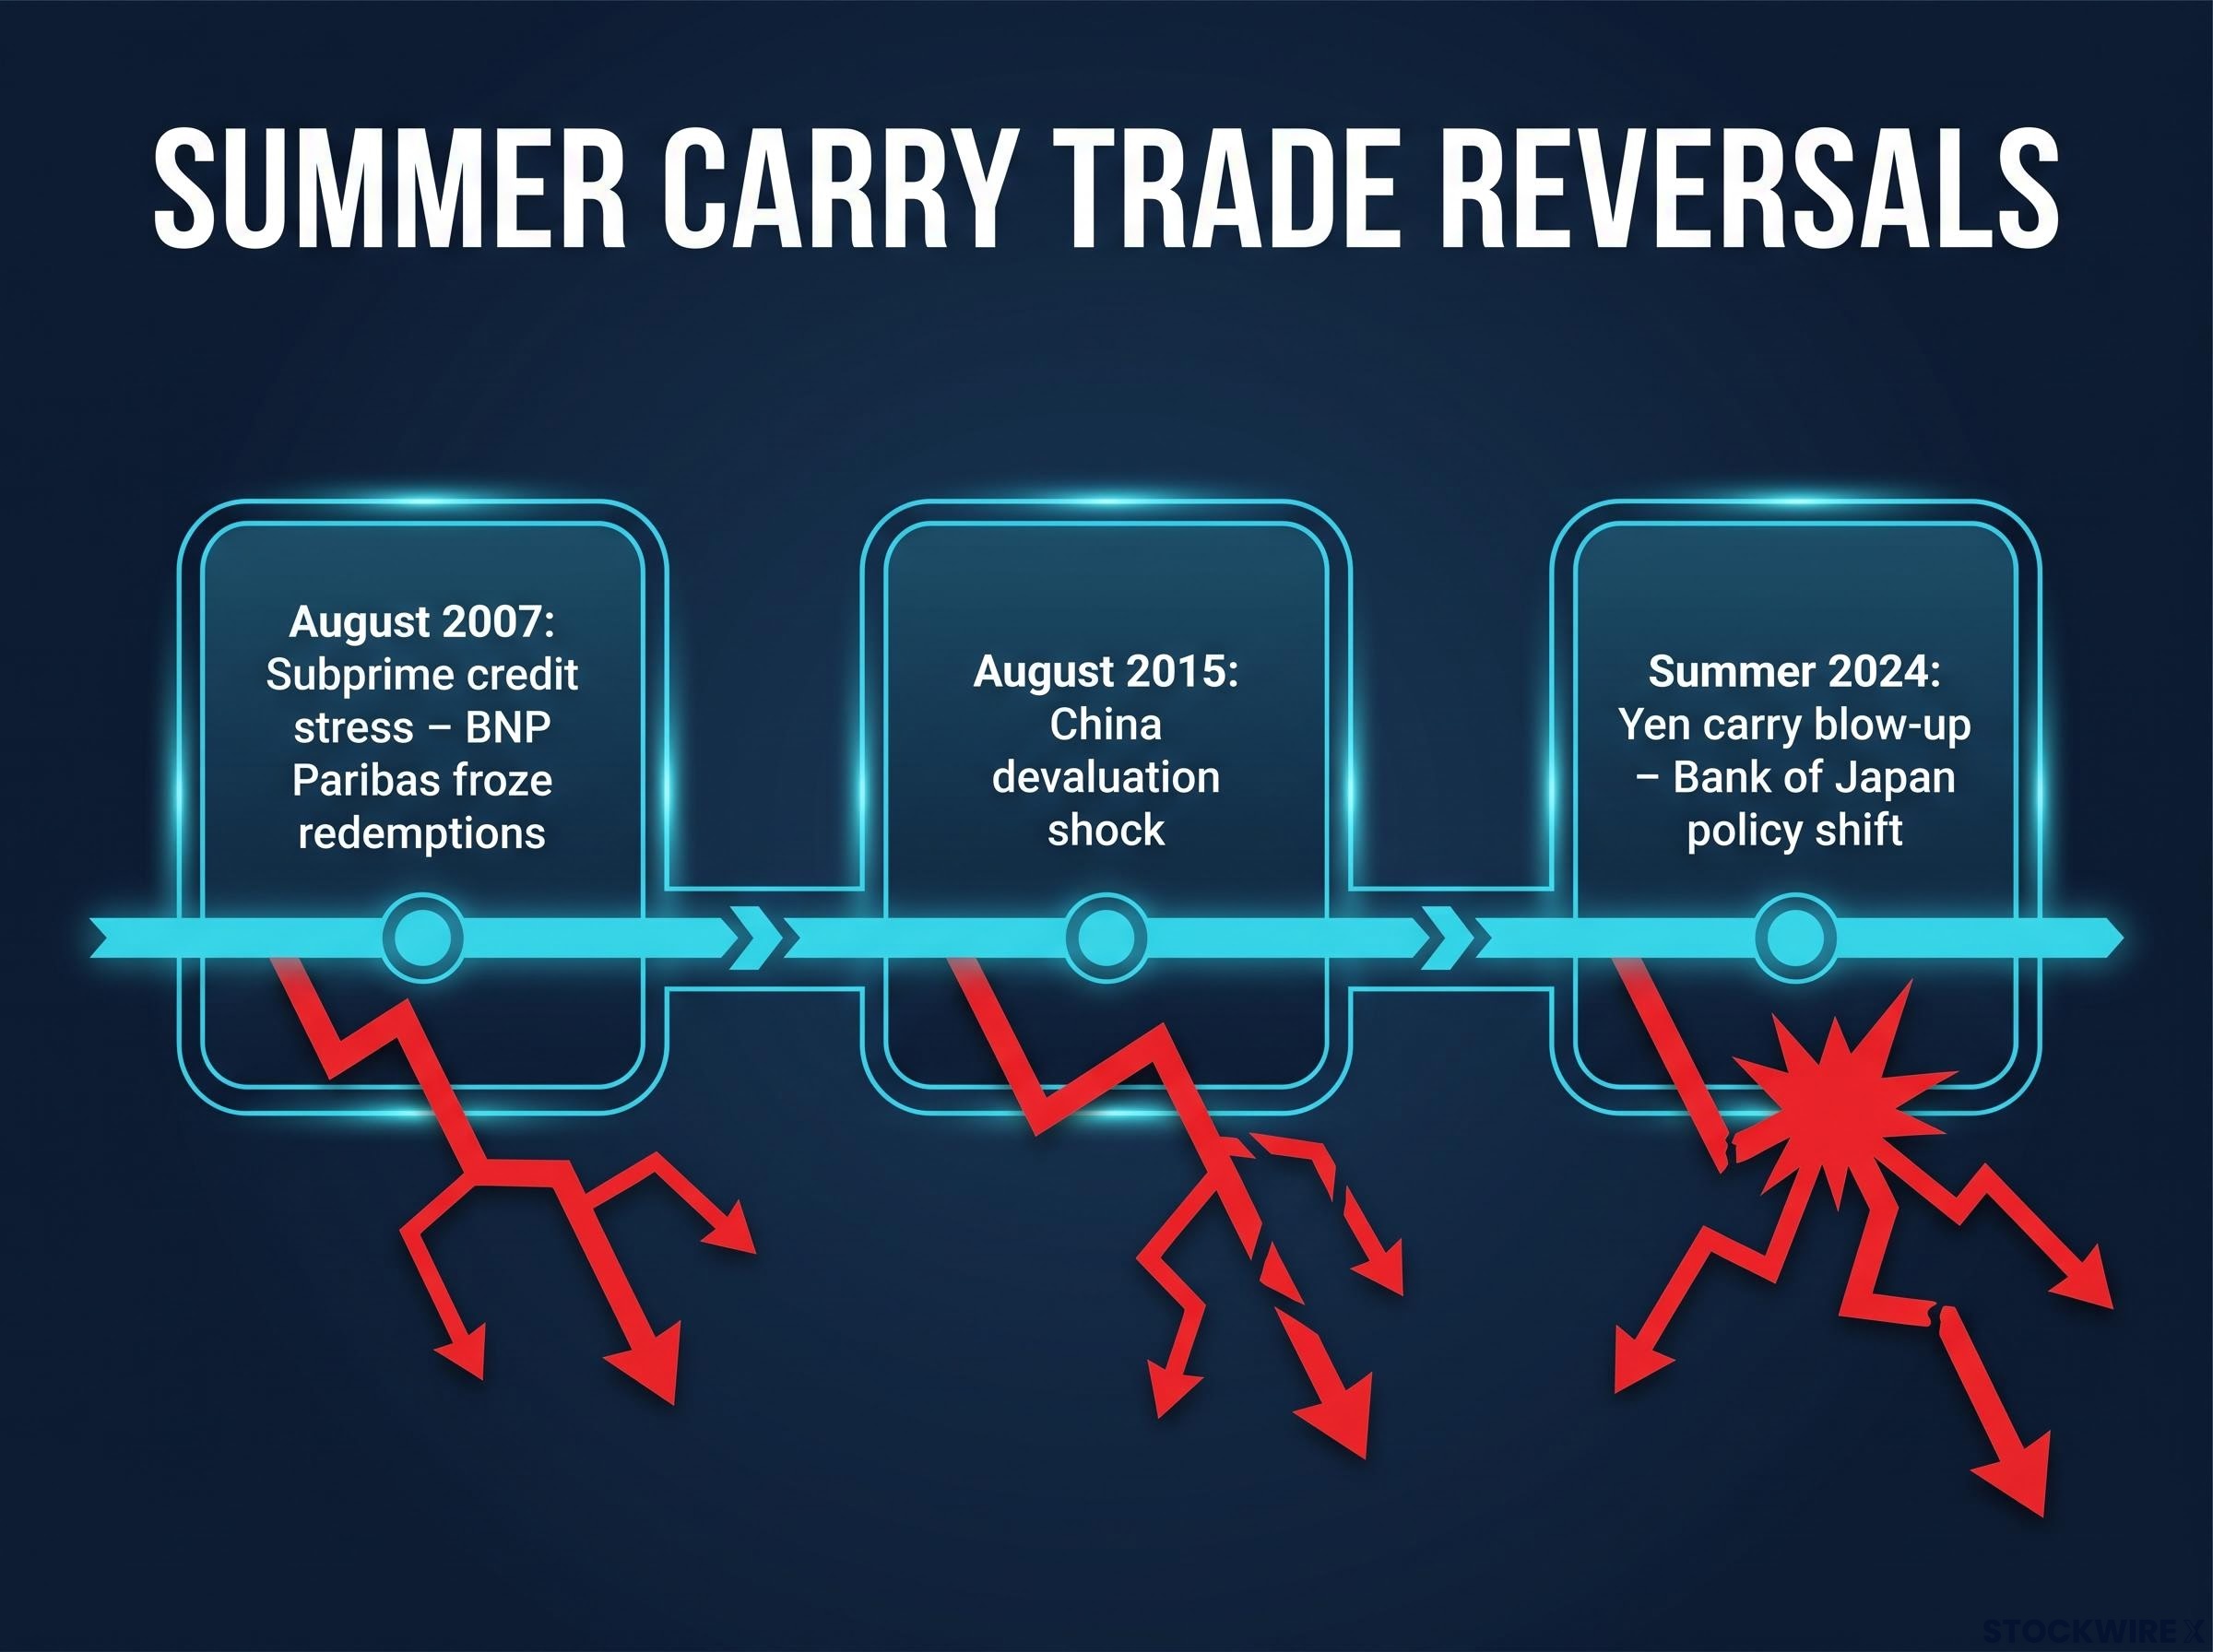
| Episode | Month/Year | Catalyst | Carry mechanism affected | Market outcome |
|---|---|---|---|---|
| Subprime credit stress | August 2007 | BNP Paribas froze redemptions in subprime-linked funds, triggering funding-market disruption | Yen-funded carry reversed sharply as volatility surged and credit spreads blew out | Broad risk-asset selloff; carry positions unwound across G10 and EM currencies |
| China devaluation shock | August 2015 | China’s surprise yuan devaluation triggered a global risk-off move | EM carry trades funded in low-yielding currencies unwound rapidly as VIX surged | Emerging-market currencies sold off hard; safety-seeking flows crushed carry returns |
| Yen carry blow-up | Summer 2024 | Bank of Japan policy shift triggered sudden yen appreciation | Massive yen-funded carry positions reversed as the funding currency surged | Widespread global market disruption; carry losses across asset classes |
The catalysts were different each time: a credit crisis, a currency devaluation, a central bank pivot. But the outcome was the same. Crowded carry positions, sitting in thin summer liquidity, reversed faster and harder than they would have in a deep market.
Three major reversals across three different causal mechanisms in the same calendar window is not bad luck. It tells you that seasonal timing offers no protection against the macro shocks that define carry’s worst outcomes.
Carry unwind dynamics in the 2024 episode resolved within weeks, with 40-60% of speculative positioning cleared in that window and no cascading structural breakdown following, a pattern that illustrates how quickly thin-market reversals can exhaust themselves once forced liquidation runs its course.
What actually drives carry performance: macro fundamentals over the calendar
If the calendar does not predict carry performance, what does? The evidence points to four macro variables that dominate across cycles.
Rate and policy drivers
Carry thrives when rate differentials are stable or widening, and when funding-currency central banks are credibly on hold. It fractures when markets begin pricing policy normalisation in funding currencies (as happened with the Bank of Japan in 2024) or rate cuts in high-yielding targets.
Current carry trade warning signals identified by analysts include JGB yields surging to multi-decade highs and narrowing cross-currency spreads, both of which compress the borrowing-cost advantage from the funding side before any macro shock needs to materialise.
- Conditions that support carry: stable or widening rate spreads, funding central banks credibly on hold, contained inflation, improving or stable growth, healthy credit markets.
- Conditions that fracture carry: policy normalisation pricing in funding currencies, inflation shocks, credit stress, recession fears, risk-off sentiment cascades.
Valuation as a carry risk signal
GMO highlights that carry is riskier when it runs against valuation, meaning high-yielding currencies that are also expensive relative to fair value. In these regimes, the potential gains from carry are small relative to the downside, making blind reliance on seasonal patterns or recent performance particularly dangerous.
If the rate differential anchoring your carry thesis is simultaneously running against valuation, the calendar month is irrelevant. The position is exposed from two directions, and seasonal assumptions provide no cover.
What this means before you put on the next carry position
The conclusion from the data is not that carry is a bad strategy in summer. It is that the season itself tells you nothing useful about the strategy’s prospects. Investors who substitute seasonal pattern for macro analysis are absorbing the full downside risk without realising it.
Before any carry position, regardless of month, run through four checks:
- Rate differentials: Is the spread stable, widening, or compressing? Is the differential large enough to compensate for the FX risk?
- Central bank trajectory: Are funding-currency central banks credibly on hold, or is the market starting to price normalisation? Policy shifts in funding currencies are the single most common catalyst for carry reversals.
- Valuation: Is the high-yielding currency cheap, fair, or expensive relative to historical norms? Carry running against valuation leaves no cushion.
- Implied volatility quality check: Is implied vol low because risk has genuinely declined, or because markets are demanding less compensation for the same risk? The latter is a crowding signal, not a green light.
Summer liquidity conditions demand specific discipline on position sizing. Thinner markets mean higher slippage and faster unwind dynamics, so leverage levels must account for the possibility of disorderly exits.
The asymmetric payoff structure of carry, slow gains, fast losses, does not change because the calendar reads July. Only your analysis of macro conditions can tell you whether the risk is worth taking.
This article is for informational purposes only and should not be considered financial advice. Investors should conduct their own research and consult with financial professionals before making investment decisions. Past performance does not guarantee future results. Financial projections are subject to market conditions and various risk factors.