
Why an 11% Yield Fund Left Investors $20,000 Behind
10 hrs ago

In July 2024, the S&P 500 shed roughly 10% in three weeks. No major earnings miss triggered it. No Federal Reserve surprise explained the speed. The most credible mechanism pointed to Tokyo.
Most US retail investors monitor the Fed, corporate earnings, and domestic economic data. Very few track the USD/JPY exchange rate or Japanese government bond yields. Yet as of mid-2026, two of the three conditions that preceded the 2024 episode are already active, and the third is the variable to watch.
What follows is an explanation of exactly how the yen carry trade works, why a USD/JPY reversal or a further rise in Japanese bond yields can cascade into a rapid global equity sell-off, and what three specific signals retail investors should monitor to position ahead of the next dislocation.
The carry trade is a three-step process that has operated for decades on a simple arithmetic:
Borrow at approximately 0.5% in yen. Invest at approximately 4.5% in US assets. The multi-point spread, amplified by leverage, has made this one of the most consistently profitable trades in global macro for the better part of two decades.
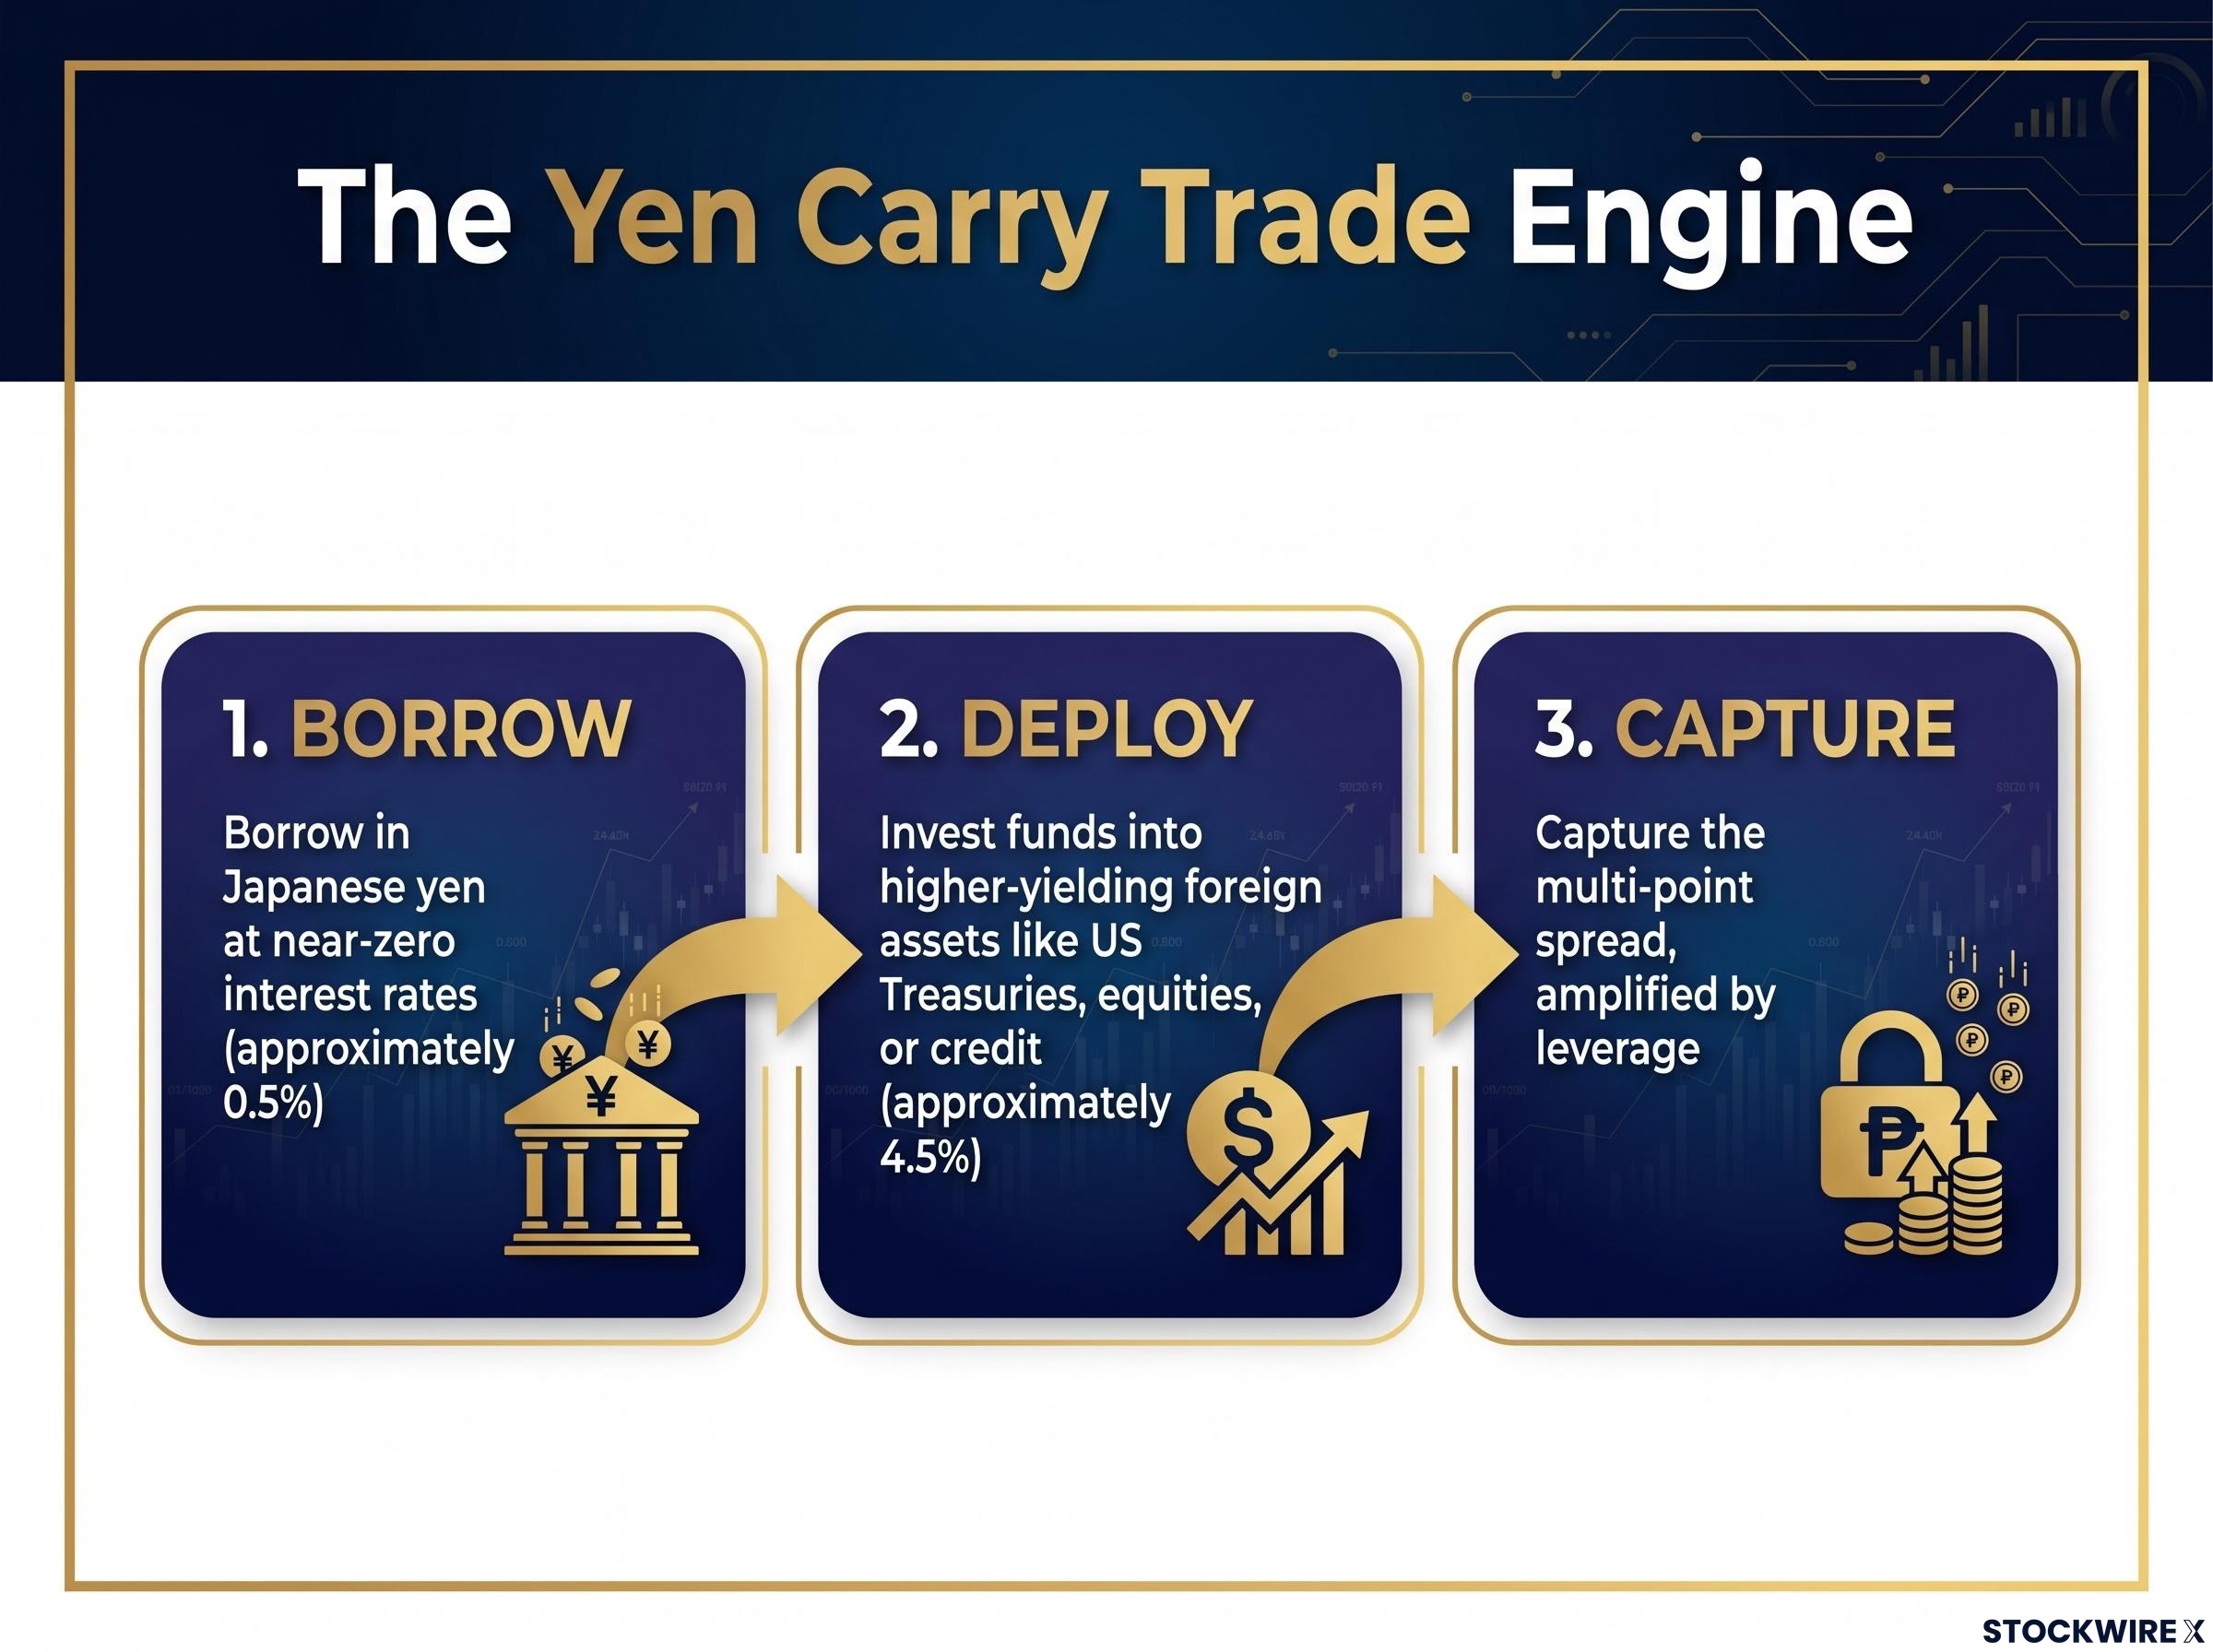
The profitability depends entirely on two conditions holding simultaneously: Japanese interest rates remaining low, and the yen remaining stable or weakening. Both conditions are now eroding. Japan’s 10-year government bond yield has climbed from below 1% to approximately 2.65% as of 19 June 2026, with a recent high near 2.809%, the highest level since the mid-1990s. The carry spread that once made this trade self-evidently attractive is narrowing fast.
The Bank of Japan rate hike to 1.0% on 16 June 2026, a 31-year high delivered by a 7-1 board vote, represents exactly the kind of structural monetary normalisation that compresses the carry spread from the borrowing-cost side; the simultaneous tapering of JGB purchases by approximately 200 billion yen per quarter through March 2027 adds direct upward pressure on JGB yields from reduced central bank demand.
Because this trade has been available for decades, the accumulated positions are not small. They are large enough to move global asset prices when they unwind. Leverage clustering creates non-linear dynamics: when positions begin to reverse, forced sellers do not wait for good prices. They liquidate into whatever liquidity exists, and the resulting selling pressure feeds on itself, pulling other leveraged participants into the same forced exit.
Something unusual happened in July and August 2024. The S&P 500 dropped approximately 10% over roughly three weeks, a magnitude and speed that sat well outside normal volatility. There was no proportionate fundamental catalyst. No single earnings season disaster. No emergency rate decision.
What there was: a sharp move in the yen.
USD/JPY broke lower during the same window, with the yen strengthening rapidly against the dollar. The timing aligned precisely with the equity decline’s onset. The breadth of the selling, cutting across sectors and geographies, was consistent with indiscriminate liquidation rather than stock-specific or sector-specific deterioration.
Several co-factors were also present and should be acknowledged:
These elements contributed. But the speed, the breadth, and the absence of a clear fundamental trigger pointed toward one mechanism with sufficient scale to explain the magnitude: the unwinding of carry trade positions.
A 10% yen strengthening can wipe out more than a year’s accumulated carry spread, forcing position liquidation regardless of the underlying asset’s fundamentals.
This framework and case study analysis was originally developed by Gareth Soloway, Chief Market Strategist at VerifiedInvesting.com, who identified the carry trade mechanism as the most credible explanation consistent with the observable evidence.
The yield regime in Japan has changed. This is not a cyclical fluctuation or a temporary spike. Japan’s 10-year JGB yield has moved from below 1% to above 2.65% in roughly two years, a structural break from decades of near-zero rates.
| Variable | Current Level | 52-Week High | Historical Context |
|---|---|---|---|
| Japan 10-year JGB yield | ~2.65% | ~2.809% | Highest since mid-1990s |
| US 10-year Treasury yield | ~4.46-4.49% | Sustained mid-4% range | Well above 2010s lows |
| USD/JPY | ~160 | Repeated rejection from high-150s to ~160 | Multi-decade high resistance zone |
Japan’s fiscal stance and heavier bond issuance have been flagged by bond market participants as structural drivers of the yield rise, not transient ones. The forces pushing JGB yields higher are embedded in policy and fiscal reality, meaning they are unlikely to reverse quickly.
A synchronised bond market selloff on 18 May 2026 drove Japan’s 30-year yield to an all-time high of 4.170% and the US 10-year to its highest since February 2025 at 4.631%, providing concrete evidence that the structural forces described here are not hypothetical; both the JGB yield trajectory and the US yield elevation discussed as Signals 2 and 3 were simultaneously in motion during a single observable market session.
A bullish flag is a shallow consolidation that follows a strong move higher. When the pattern breaks to the upside, it typically signals resumption of the prior trend. The JGB yield chart is forming precisely this pattern, with consolidation occurring in the 2.5-2.8% range following the sharp climb from below 1%.
The approximately 3% level has been identified as the threshold at which carry spread compression becomes acute enough to materially accelerate position unwinding. With yields already at 2.65% and recently touching 2.809%, that threshold is within striking distance. The pattern tends to resolve higher, though technical formations should always be understood probabilistically rather than as guarantees.
The three variables that interacted to produce the 2024 episode can be distilled into a specific, checkable framework:
Japanese intervention risk adds a second mechanism through which USD/JPY can move sharply lower: beyond natural carry trade unwinding, Japan’s Ministry of Finance has already deployed an estimated $73 billion in a single recent operation defending the 160 level, meaning any further yen weakness toward 161.80-161.95 raises the probability of a forced official reversal that would trigger carry liquidation at pace rather than gradually.
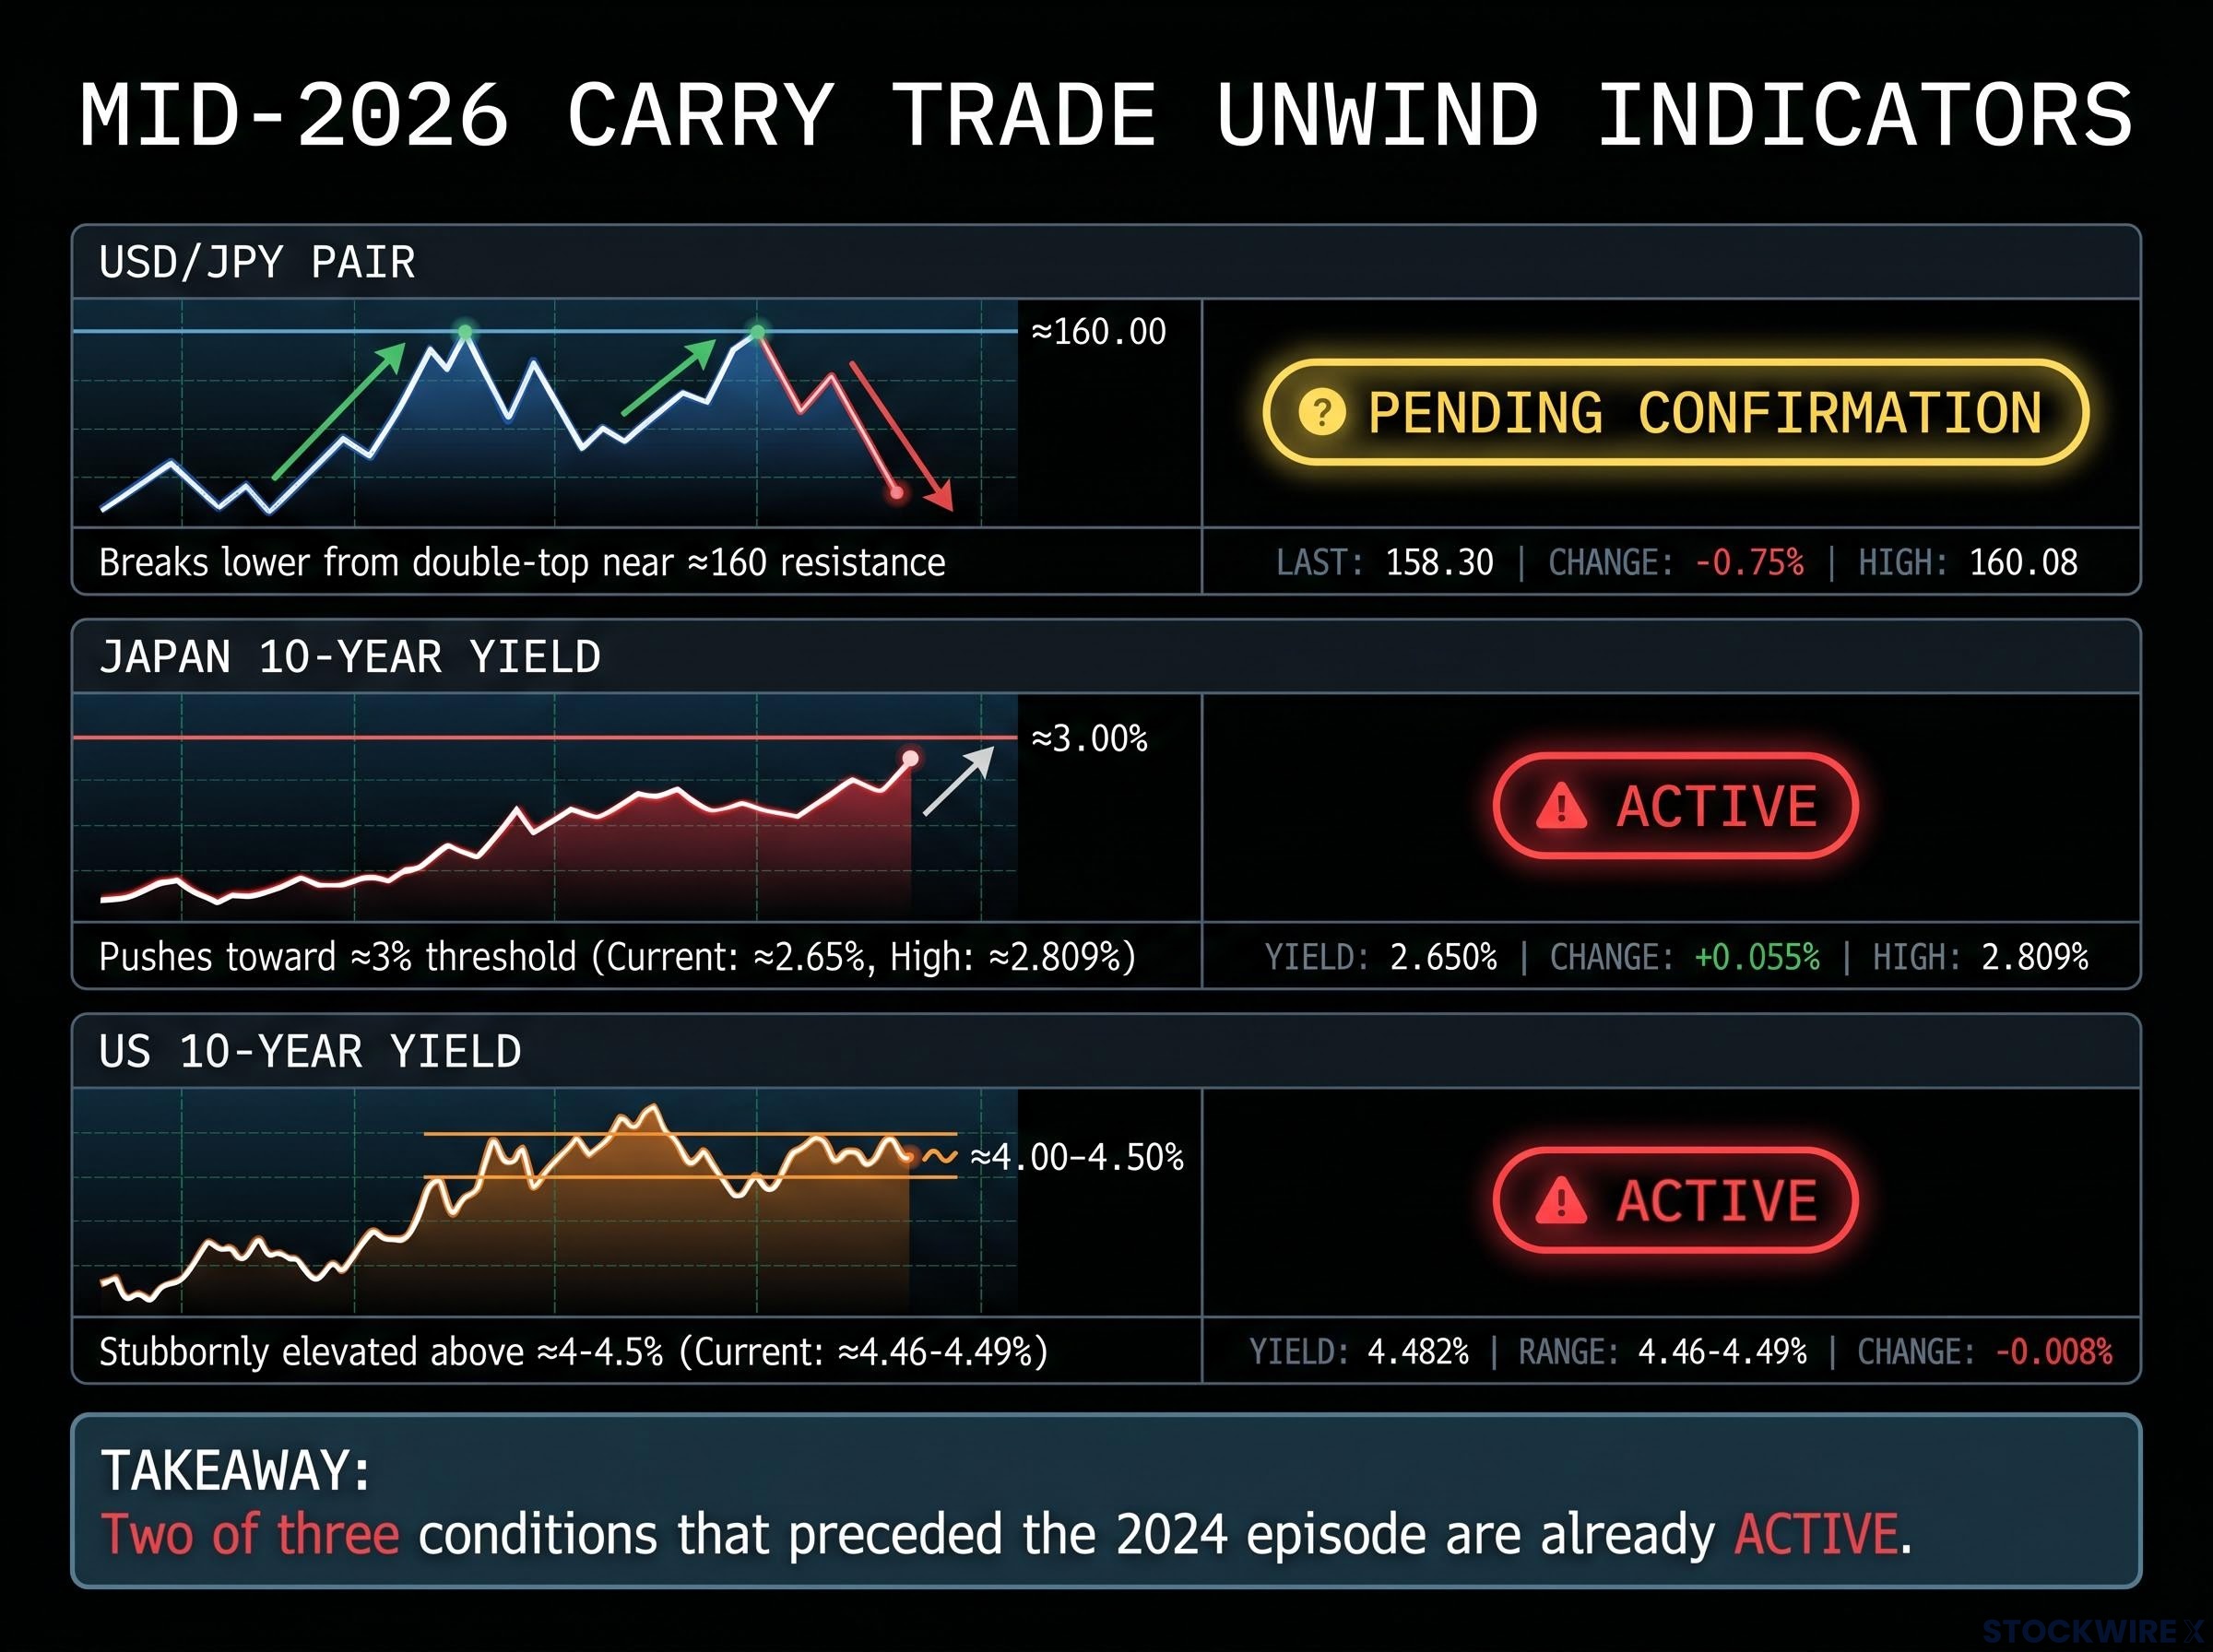
One signal alone is a yellow flag. All three moving in the same direction simultaneously is a red flag for global risk assets.
The current configuration is clear: two of three signals are already active. Signal one, a confirmed USD/JPY breakdown from the double-top structure near 160, remains the trigger to watch.
During forced deleveraging episodes, something uncomfortable happens to portfolio theory. Assets that normally move independently begin falling simultaneously, because the selling is not driven by asset-specific fundamentals. It is driven by margin calls, position sizing, and the mechanical need to raise cash, regardless of what is being sold.
The 2024 episode demonstrated this dynamic. The breadth and speed of the equity decline were consistent with indiscriminate forced selling rather than deterioration in any specific sector or company. Correlations across equities, credit, and foreign assets compressed toward 1.0 during the acute unwinding window.
CTA selling amplification is one of the co-factors that can convert an initial carry-trade unwind into a much larger market move: Bank of America’s trigger mapping estimates that a roughly 3% S&P 500 decline could unleash approximately $100 billion in programmatic equity selling by trend-following funds, a mechanical cascade that would layer on top of any forced carry liquidation and accelerate the correlation-compression dynamic described above.
Certain assets may still hold or appreciate during such episodes:
The problem is the short window, not diversification as a strategy. Carry trade unwinds compress the benefit of diversification to near zero for days or weeks at a time, but this is a specific, time-limited phenomenon. Over full market cycles, diversified portfolio construction retains its value. Investors who understand this distinction can make more informed decisions about whether short-term hedging adjustments are warranted during periods of elevated structural risk, without abandoning their long-term allocation framework.
Everything in this analysis reduces to a practical monitoring habit. The three levels to track are publicly available and require no proprietary data access:
The FRED Treasury yield data series, maintained directly by the Federal Reserve Bank of St. Louis, provides the benchmark 10-year constant maturity yield figures that underpin the discount rate pressure argument, with the series currently reflecting sustained readings in the mid-4% range that represent a structural departure from the post-2008 low-rate environment.
The current configuration, two of three signals active, does not mean a sell-off is imminent or inevitable. Technical patterns resolve probabilistically, not deterministically. What the framework identifies is that the structural preconditions are in place, the remaining trigger is identifiable, and the cost of monitoring three data points is effectively zero.
The value of this framework is not in predicting a crash. It is in closing the information gap between what sophisticated macro traders watch and what most retail investors track, providing tools to make more informed decisions about risk tolerance and positioning.
This article is for informational purposes only and should not be considered financial advice. Investors should conduct their own research and consult with financial professionals before making investment decisions. Technical patterns and historical precedents are presented as analytical frameworks, not predictions. Past performance does not guarantee future results.
The yen carry trade involves borrowing in Japanese yen at low interest rates and investing in higher-yielding foreign assets such as US equities or Treasuries. When the yen strengthens or Japanese rates rise, traders are forced to unwind these positions rapidly, triggering broad sell-offs across global markets regardless of underlying stock fundamentals.
The most credible explanation for the roughly 10% S&P 500 decline over three weeks in July-August 2024 is the unwinding of yen carry trade positions, coinciding with a sharp yen strengthening against the dollar. The sell-off was unusually broad and fast with no proportionate earnings or Federal Reserve catalyst, consistent with indiscriminate forced liquidation rather than stock-specific deterioration.
The three signals are: a confirmed USD/JPY breakdown below the double-top neckline near the 160 level (currently pending), Japan's 10-year JGB yield approaching or breaching approximately 3% (currently active at around 2.65%), and the US 10-year Treasury yield remaining stubbornly elevated above 4-4.5% (currently active at approximately 4.46-4.49%).
USD/JPY and Japan's 10-year JGB yield can be tracked daily on Trading Economics and Investing.com at no cost, while US 10-year Treasury yields are available directly from the Federal Reserve via the FRED database at fred.stlouisfed.org.
During forced deleveraging episodes, asset correlations compress toward 1.0 because selling is driven by margin calls and the mechanical need to raise cash, not by asset-specific fundamentals. This means equities, credit, and foreign assets can fall simultaneously for days or weeks, temporarily eliminating the protective benefit of a diversified portfolio.


