A Canadian ETF generating twice-monthly income from the aerospace and defence sector sounds straightforward, until you notice it holds SpaceX alongside Lockheed Martin, writes options on only part of its portfolio by design, and rests on a geopolitical thesis that NATO itself may not fully deliver.
EDHI launched on the Toronto Stock Exchange on 15 September 2026, entering a covered call ETF market that has grown from CAD 3.7 billion to roughly CAD 57 billion over the past decade.
But defence is not a typical covered call sector, and this is not a typical covered call structure. The fund blends legacy primes, commercial aviation, and emerging space companies under an equal-weight approach, then layers on a partial options overlay and modest leverage.
Understanding how those pieces fit together matters before you reach any conclusion about whether the fund belongs in your portfolio.
Here is a framework for evaluating this Ninepoint product: how it is built, what the income mechanics actually deliver, how credible the NATO spending tailwind really is, and where the genuine risks sit. These are the five things that matter most when assessing whether the fund delivers what it promises.
What EDHI actually holds, and why the mix is unconventional
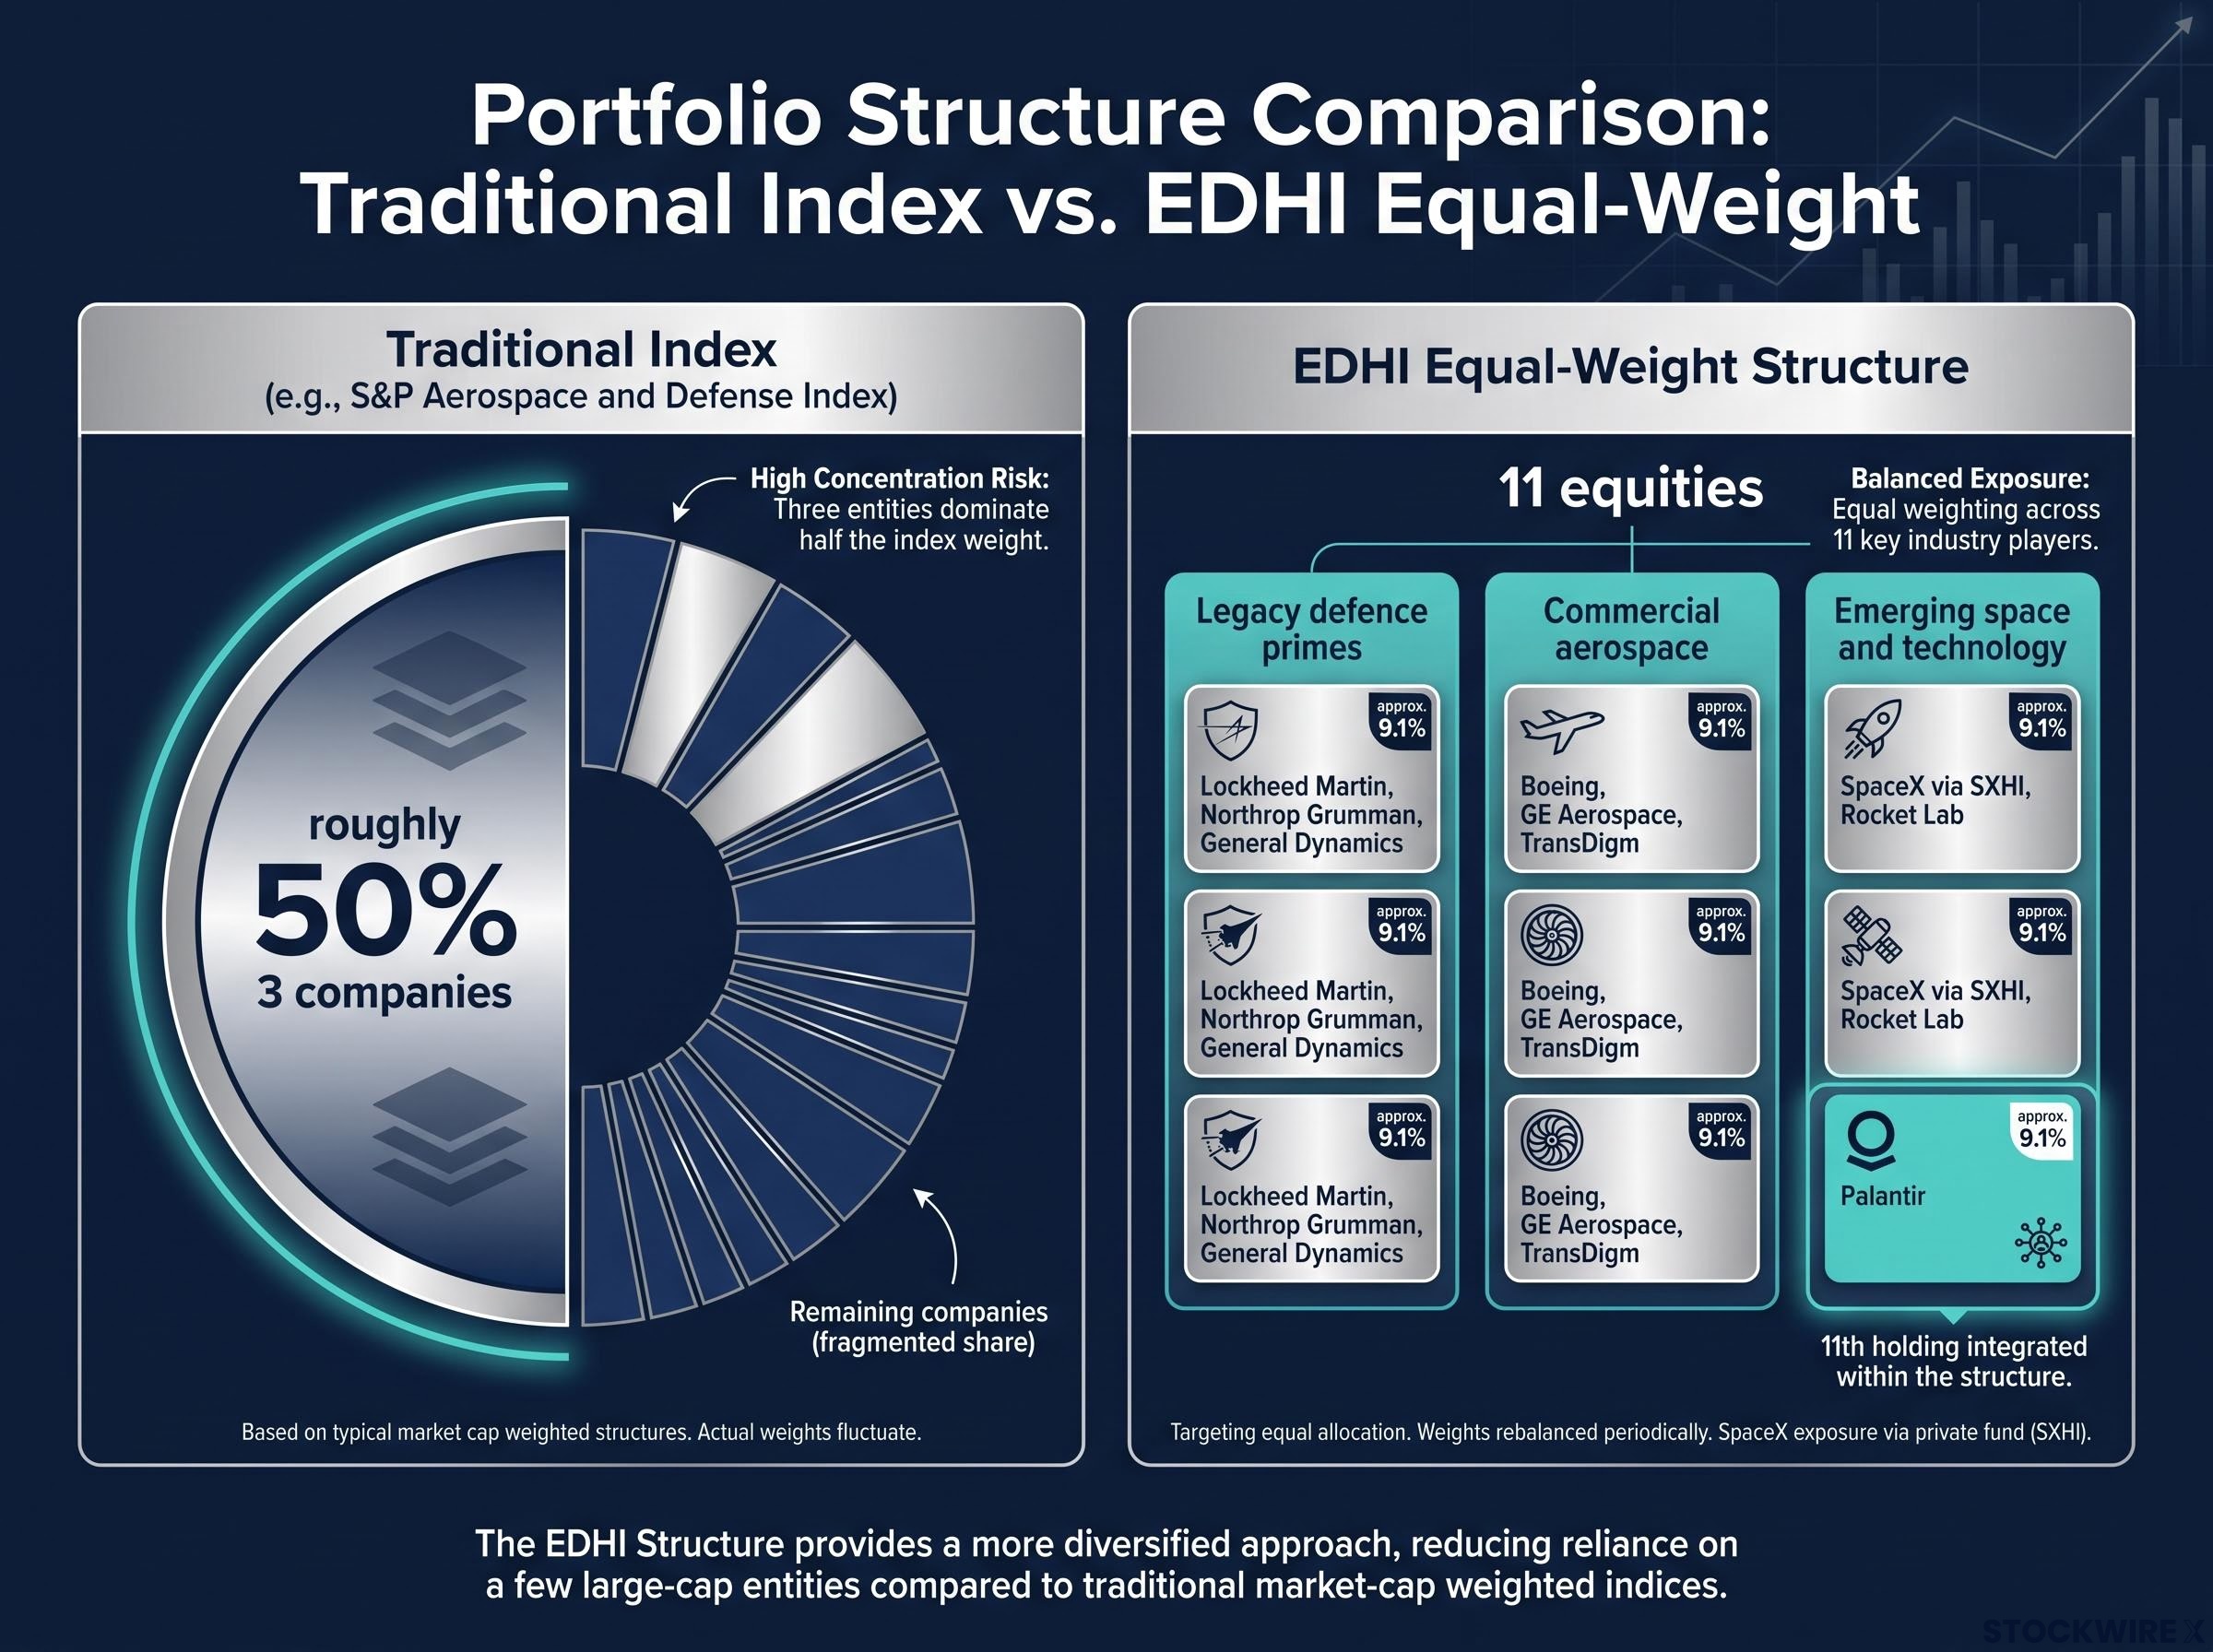
Start with the portfolio, because the label “defence ETF” hides more than it reveals. The fund holds just 11 equities, sorted deliberately into three sub-categories, and the logic of each tier tells you something about what the managers were trying to build.
| Sub-category | Representative holdings | Construction logic |
|---|---|---|
| Legacy defence primes | Lockheed Martin, Northrop Grumman, General Dynamics | Direct exposure to arms procurement and contract cycles |
| Commercial aerospace | Boeing, GE Aerospace, TransDigm | Civil aviation demand and aftermarket parts revenue |
| Emerging space and technology | SpaceX (via SXHI), Rocket Lab | Growth exposure to the commercial space build-out |
The three tiers work as follows. Legacy primes are the pure defence engine, tied to government contracts and budget votes. Commercial aerospace tracks civil aviation cycles and the steady flow of aftermarket parts. Emerging space adds a growth leg through names most defence funds ignore entirely.
The equal-weight rationale
Here is the problem the structure is solving. In a standard passive defence index like the S&P Aerospace and Defense Index, roughly 50% of assets sit in just three companies. Buy that index and you are effectively buying a handful of primes, with everything else along for the ride.
EDHI’s equal-weight approach spreads capital evenly across the three sub-themes instead. That gives commercial aerospace and emerging space names real representation, exposure that cap-weighted defence indices structurally suppress.
The Palantir question: defence company or defence-adjacent tech play?
Then there is the eleventh holding, and it complicates the whole picture.
Ninepoint’s management explicitly acknowledged the debate before adding Palantir, justifying its inclusion on the basis of government contracts and drone-linked revenues. The company’s platforms are used in battlefield targeting, mission planning, and intelligence fusion, all genuinely defence-relevant work.
The counter-argument is that Palantir trades at growth-stock multiples, not the cash-generative valuations typical of primes. Its expanding commercial business across finance, healthcare, and energy means its share price is often driven more by tech-sector sentiment than by defence-budget cycles.
The Palantir revenue breakdown by segment shows that approximately 55% of the company’s 2024 global revenue came from government contracts, a figure that complicates the pure-defence framing: its expanding commercial side across finance and healthcare means its share price can diverge sharply from defence-budget cycles.
For you, the practical read is this: EDHI is not a pure-play defence fund. If you want a targeted allocation to military hardware, understand that you are also buying commercial aviation exposure and an AI-data analytics factor that may behave nothing like the rest of the basket.
When big ASX news breaks, our subscribers know first
How the covered call overlay actually works, and what it costs you
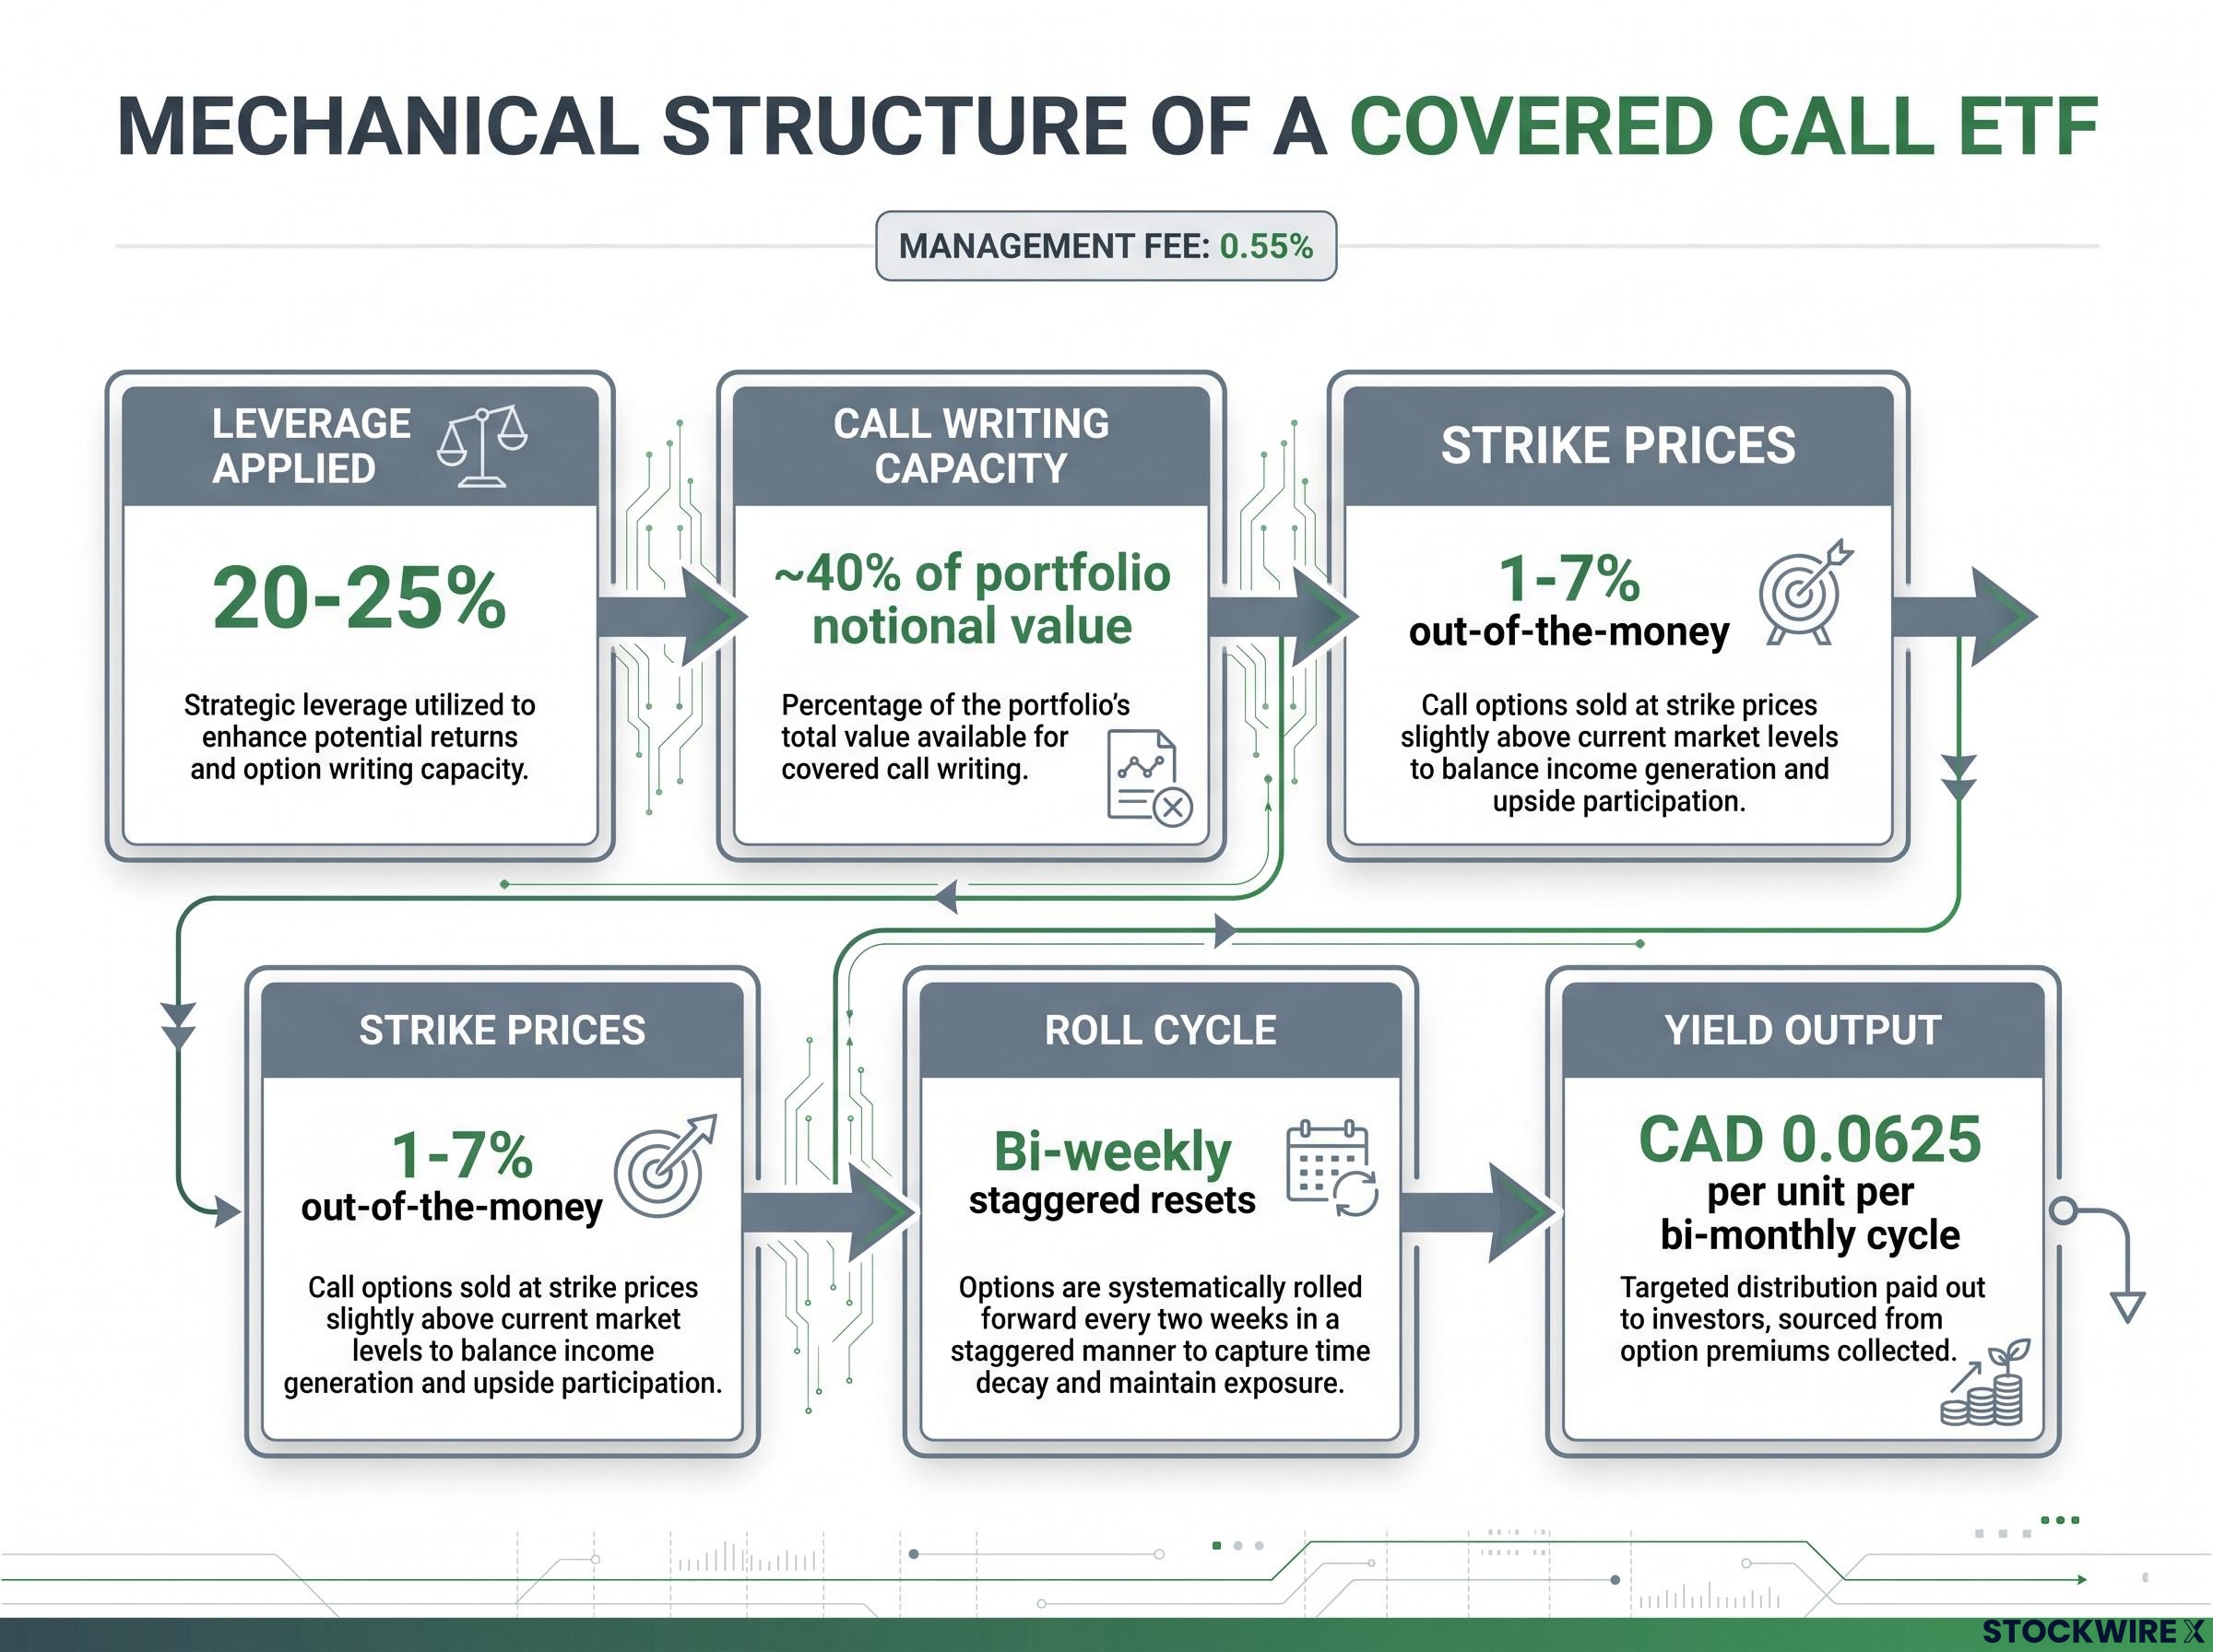
The income is the visible signal. EDHI declared an initial distribution of CAD 0.0625 per unit per bi-monthly cycle, paid twice monthly. That regular cash flow is the whole appeal for income-focused buyers, but the mechanics behind it determine what you give up to receive it.
Here is the sequence that produces the yield.
- Modest leverage of roughly 20-25% is applied to build a larger portfolio base and expand call-writing capacity.
- Covered calls are written on approximately 40% of the portfolio’s notional value, not the whole thing.
- Strikes are set roughly 1-7% out-of-the-money, varying by each stock’s volatility profile.
- Options roll on a bi-weekly, staggered cycle, giving regular resets rather than one large monthly expiry.
- The premiums collected fund the twice-monthly distributions.
A covered call, in plain terms, is a contract you sell that gives someone else the right to buy your stock at a fixed price. You pocket a premium for that promise, but you cap how much you can gain if the stock climbs past the agreed price.
The mechanics that determine covered call ETF yield sit upstream of the distribution you receive: overwrite percentage, strike placement, and how leverage is managed as prices move each shape the final income figure before a single dollar reaches your account.
The design choice that defines EDHI is what it deliberately does not do.
Management has stated the fund does not aim to maximise option premiums, on the basis that an excessive income focus can impair long-term capital growth. Writing calls on only 40% of the portfolio, and doing so out-of-the-money, preserves meaningful upside participation.
Option premium yields exceeding 20% are referenced by management as contributing to downside mitigation, but the priority is total return with income enhancement, not maximum yield.
When covered calls hurt most in defence and aerospace
The trade-off has a specific shape in this sector. The events that most benefit defence primes are exactly the events where sold calls cap your gains.
Picture a major prime winning an unexpected multi-billion-dollar contract, or a sudden geopolitical shock re-rating the entire sector overnight. Stocks gap through their call strikes before the fund can react, the positions get called away, and the ETF sells into strength.
EDHI’s mitigation is real but partial. Out-of-the-money strikes and 40% coverage mean it keeps more upside than a fully covered portfolio would. Foregone participation in a sharp rally is a structural feature of the design, not an edge case.
For you, that 40% limit is the key. This is a total-return-with-income structure, not a pure yield product. If your goal is maximum income, benchmark EDHI against higher-coverage alternatives before committing, because it will underperform the sector in a sharp defence rally and tends to shine in flat or modestly declining markets.
What NATO’s 5% pledge actually means, and what the gap looks like
The macro story underpinning the fund is genuinely significant. At the 2025 Hague Summit, all 32 NATO members committed to spending 5% of GDP annually on defence and defence-related security by 2035. That target splits into at least 3.5% for core defence requirements and up to 1.5% for broader security-related activities, including critical infrastructure and civil resilience.
This is the most ambitious spending commitment in the alliance’s history. If delivered, it would drive a structural, multi-year increase in procurement revenues for exactly the kinds of companies EDHI holds.
Now the distance between pledge and reality.
| Metric | Committed level | Current status | Projected compliance |
|---|---|---|---|
| Prior spending floor | 2% of GDP | All 32 members now meet it | Universally satisfied |
| Core defence target | 3.5% of GDP | Only 3 members reached it (2025) | ~69% may reach 3% by 2030 |
| Full target | 5% of GDP by 2035 | ~27 of 32 fully committed | ~38% likely to reach it by 2035 |
The compliance picture is uneven. All 32 members now clear the old 2% floor for the first time, but as of 2025, only three states had reached the 3.5% core-defence threshold. Five members, including the United States and Canada, have already stepped back from the full 5% figure, leaving roughly 27 fully committed as of early 2026.
According to Janes projections, only about 38% of NATO members are likely to reach the full 5% target by 2035, while roughly 69% may reach 3% of GDP by 2030.
The scale required is enormous. Total NATO spending would need to rise by approximately USD 912 billion to reach around USD 2.36 trillion within a decade. European allies plus Canada did lift real defence outlays by an additional USD 90 billion in 2025 versus 2024, so the direction is real, but the pledge carries no legal enforcement mechanism.
Why creative accounting could widen the gap further
The 1.5% broader-security component is where the headline figures can mislead. Governments can count existing infrastructure, cyber, and civil-resilience budgets toward compliance, meaning reported spending may rise without a proportional increase in actual hardware procurement.
Analysts also note that a large share of any increase can be absorbed by personnel costs and pensions rather than complex systems and equipment. Those are precisely the line items that generate revenue for defence primes, so the procurement signal could be softer than the top-line numbers suggest.
The takeaway for you is a matter of discipline. The NATO thesis is a structural tailwind, not a guaranteed demand forecast. Size your conviction to the probability of delivery, not the ambition of the pledge, and expect the direction to be right while the pace may fall short of the headlines.
The converging risks in defence stocks extend beyond budget timelines: free cash flow conversion gaps at major primes, energy-cost pressures on European industrials, and procurement urgency concentrated in consumables rather than long-cycle platforms each create dynamics that are separate from, but interact with, the NATO spending trajectory EDHI relies on.
Equal-weight construction: the diversification benefit and its hidden costs
Equal-weighting sounds like a free upgrade, more diversification at no cost. It is not, and understanding why sharpens your view of what you are actually buying.
The benefit is concrete. By spreading capital across three sub-themes rather than letting the largest primes dominate, EDHI avoids the concentration that defines cap-weighted defence indices, where roughly 50% sits in the top three names. That balance gives commercial aerospace and emerging space companies genuine weight in returns, exposure passive defence indices structurally underweight.
The costs are equally specific.
- Benefits: reduced single-name concentration, meaningful exposure to emerging space and commercial aerospace, balanced weighting across all three sub-themes.
- Costs: rebalancing drag in trending markets, liquidity risk in smaller names, thinner and pricier options markets on those names, and potential underperformance when large primes lead a rally.
Rebalancing drag is the clearest mechanism. To keep weights equal, the fund must periodically sell its winners and buy its laggards. In a sustained uptrend led by the biggest primes, that “trim the leaders” discipline works against you, and a cap-weighted structure would capture more of the move.
Liquidity and options thinness in smaller defence names
The second cost hides inside the overlay. Emerging names like Rocket Lab trade with wider bid-ask spreads and lower volumes than the large primes.
For a covered call ETF, that thinness bites twice. It raises the cost of equity rebalancing, and it makes writing calls efficiently harder, because options markets on smaller companies can be illiquid or demand wider spreads. The overlay’s efficiency across the whole portfolio can suffer as a result.
So the honest read for you is that equal-weighting swaps one risk for another. You reduce concentration risk and take on rebalancing and liquidity risk instead. Which trade-off serves you better depends on how you expect the sector to behave over your holding period.
The Canadian covered call ETF context: where EDHI sits in a crowded market
Investor appetite for this style of product is not in doubt. Canadian covered call ETF assets grew from CAD 3.7 billion in 2016 to roughly CAD 57 billion in 2026, and the category pulled in CAD 9.8 billion of net inflows in 2025 alone.
Canadian covered call ETF assets under management climbed from CAD 3.7 billion in 2016 to approximately CAD 57 billion in 2026, more than a fifteen-fold increase over the decade.
That confirms a structurally strong market. The narrower question is what makes a defence-specific version distinctive rather than just another income wrapper.
The answer sits in volatility. Aerospace and defence names carry structurally elevated implied volatility, which translates directly into richer option premiums than income-focused funds can harvest in calmer sectors.
- Implied volatility rises around contract award cycles, when tender outcomes are uncertain.
- Defence-budget debates and votes create recurring event-driven premium spikes.
- Geopolitical crises and export-control decisions can reprice the whole sector quickly.
Compare that to utilities or consumer staples, where volatility, and therefore premium, is far lower. The sector’s turbulence is the fund’s raw material.
There is a catch when it comes to comparison shopping. Precise, up-to-date distribution yields for individual Canadian defence-focused or sector-specific covered call ETFs are not publicly available in enough detail for clean benchmarking.
Return of capital distributions complicate the income picture further: part of a headline yield may simply be the investor’s own principal returned rather than earned income, and funds relying heavily on this mechanism can mask quiet NAV erosion even as distributions arrive on schedule.
That absence changes how you should evaluate the fund. You cannot judge EDHI on yield alone against direct rivals, because those numbers are not transparent. The decision turns instead on its mechanics, its 0.55% management fee, its twice-monthly distributions, and whether its sub-sector composition fills a genuine gap in your portfolio rather than duplicating exposure you could hold more cheaply through a broader covered call fund.
What the evidence says before you decide on EDHI
Pull the five dimensions together and you are left with a set of questions to answer for your own situation, not a verdict to accept.
| Conditions favouring EDHI | Conditions working against EDHI |
|---|---|
| A flat-to-moderately-rising defence sector, where capped upside costs little | A sharp, sustained rally led by large primes, where sold calls cut participation |
| A sustained, if uneven, NATO spending ramp that lifts procurement revenues | A reversal of NATO momentum that weakens the macro tailwind |
| A portfolio currently lacking aerospace and defence exposure | An investor who needs maximum income rather than total return with income enhancement |
There is a fourth variable that sits outside the sector thesis entirely. Because the fund holds US-dollar-denominated names without currency hedging, a rising Canadian dollar against the US dollar erodes returns for Canadian investors, and the covered call overlay does nothing to offset that.
Defence sector valuations add another variable to the holding-period calculation: ITA and XAR were trading at forward P/E multiples roughly 10-20% above their five-year averages as of mid-2026, with Goldman Sachs and Barclays both flagging overcrowding, a valuation backdrop that shapes whether the NATO spending tailwind is already priced in.
Two watch items deserve a permanent place on your radar:
- Unhedged currency risk: CAD strength against the US dollar reduces your returns, uncompensated by the income strategy.
- The 2029 NATO compliance review: the next structured checkpoint on whether the spending trajectory is actually on track.
That 2029 review is the single most important external event on the fund’s horizon. If progress is materially below trajectory by then, the structural tailwind supporting the thesis weakens well before the 2035 target comes into view.
This article is for informational purposes only and should not be considered financial advice. Investors should conduct their own research and consult with financial professionals before making investment decisions. Financial projections are subject to market conditions and various risk factors, and forward-looking statements around NATO spending are speculative and subject to change based on political and economic developments.