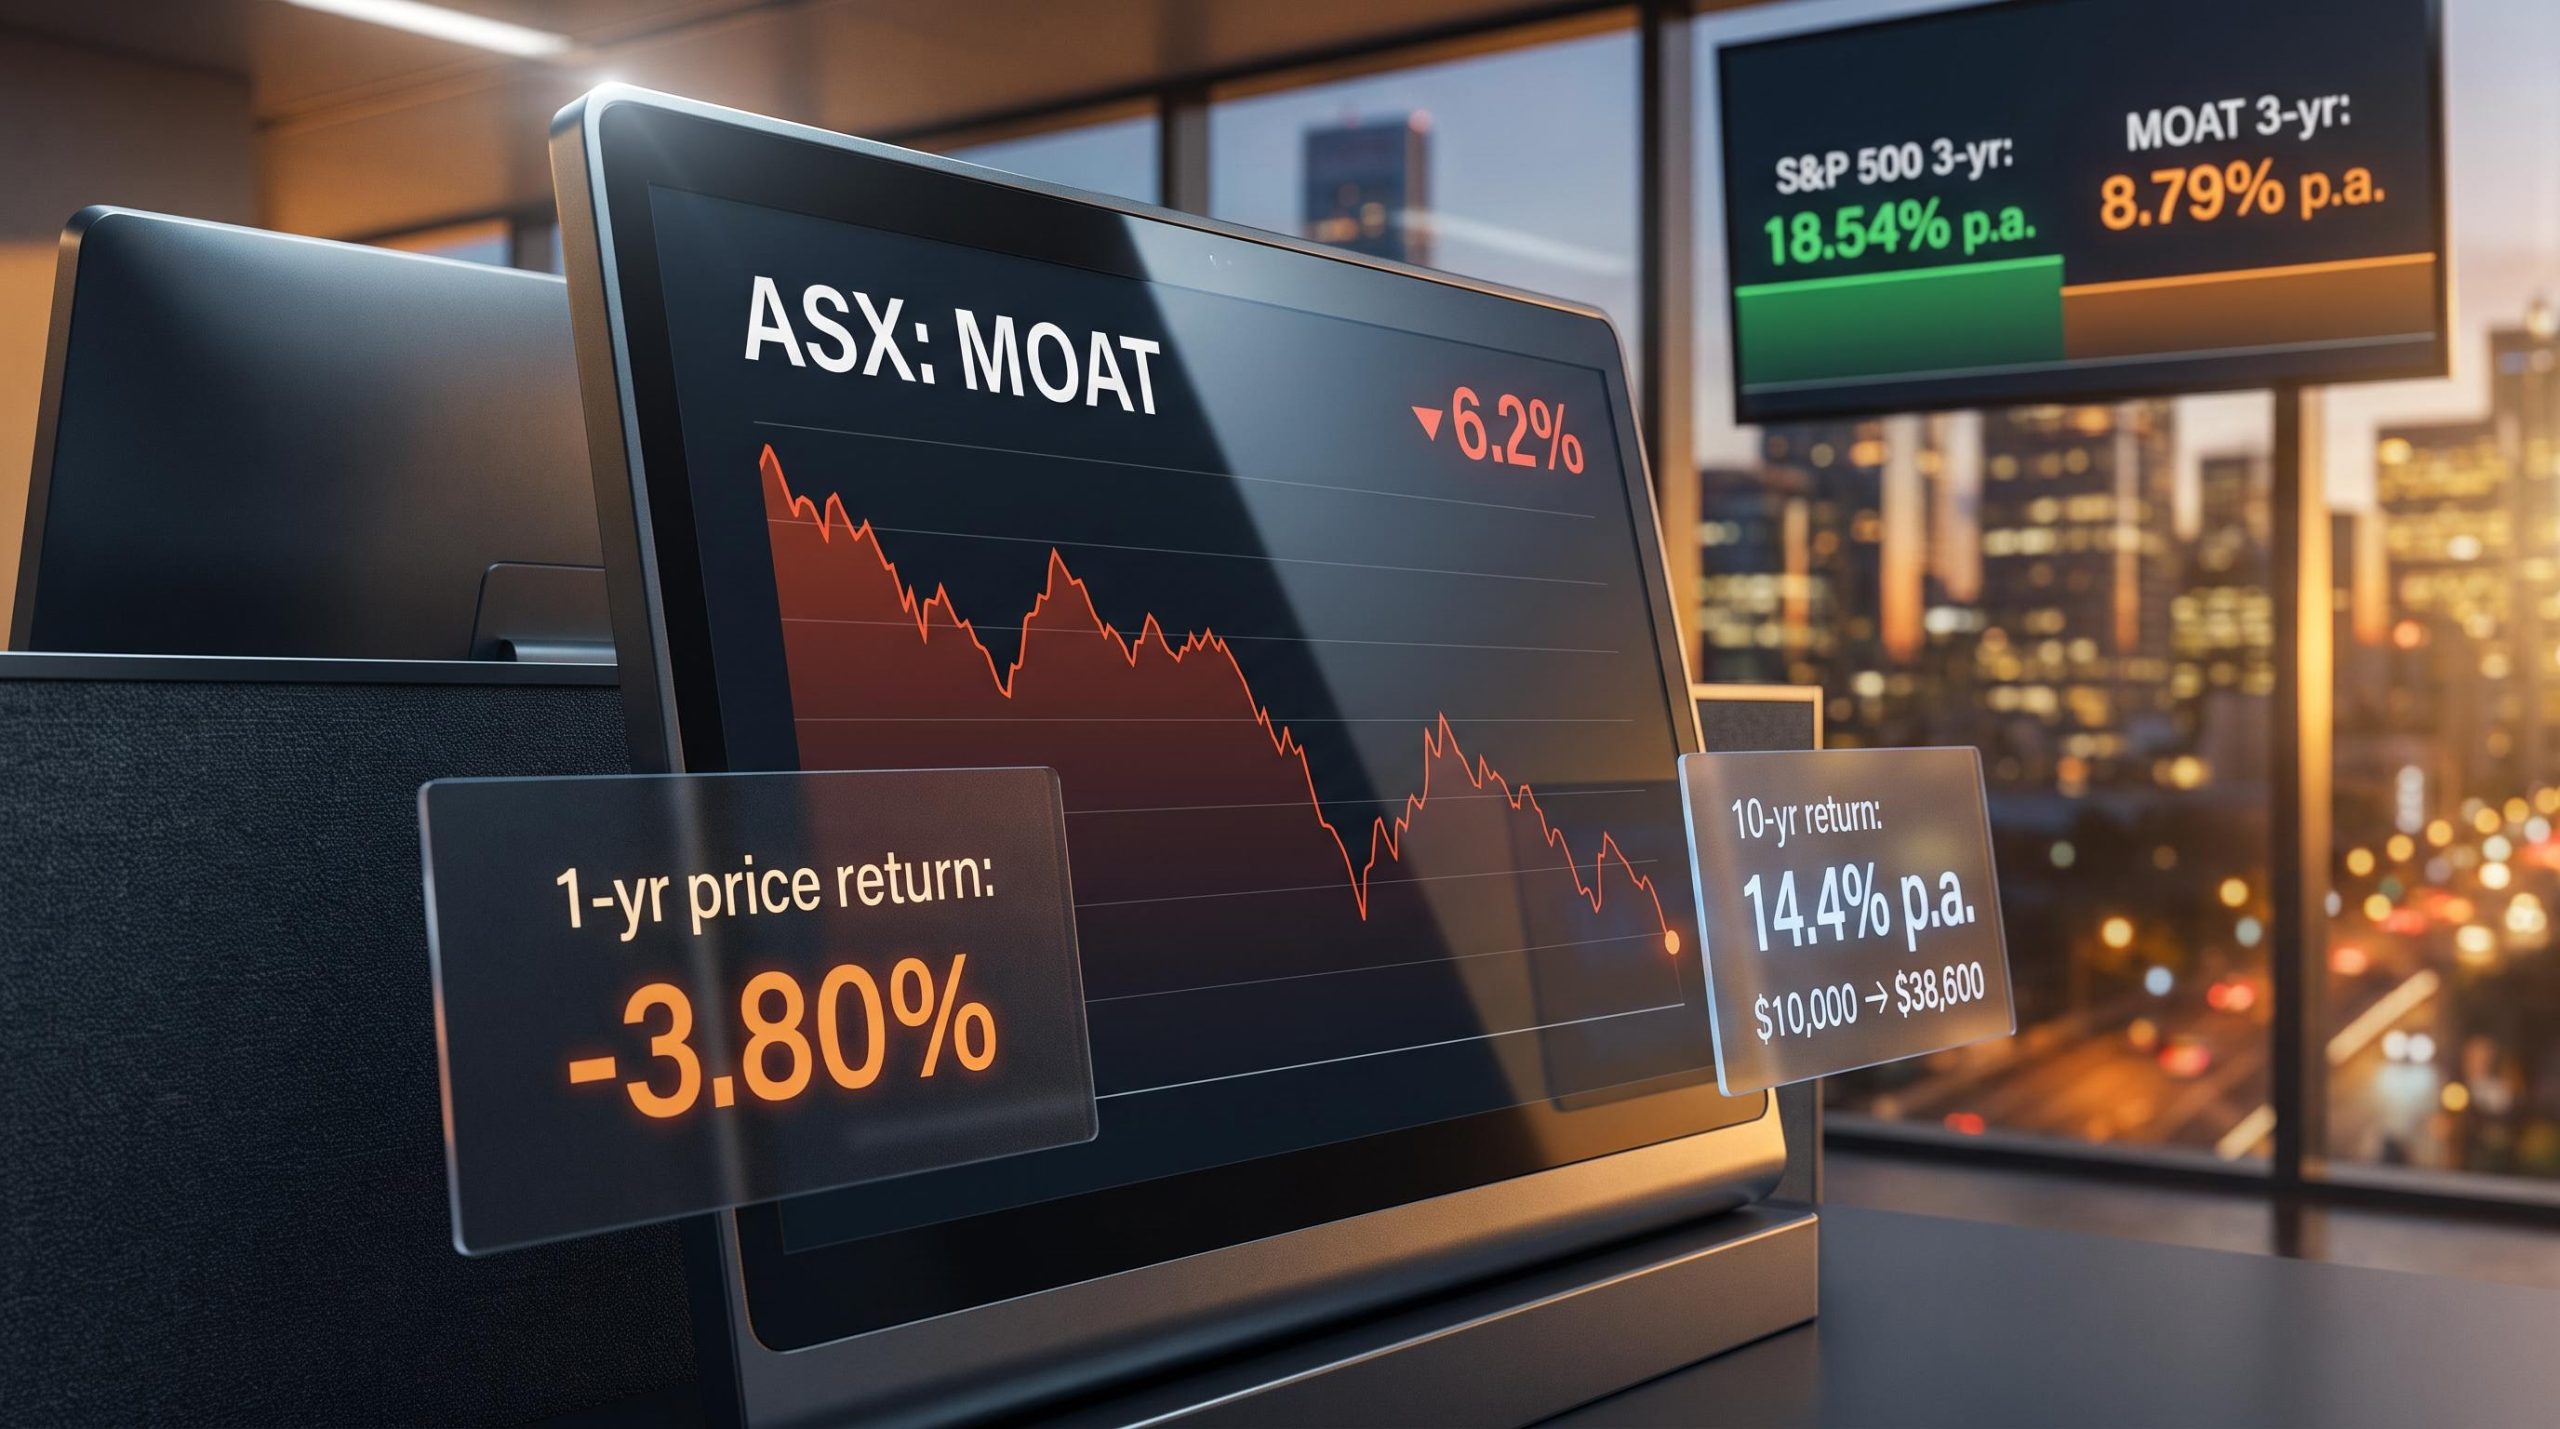
A fund built on Warren Buffett’s most famous investing principle, the idea that the best companies are protected by durable competitive advantages, has just delivered its weakest unit price performance in recent memory. Measured at 22 July 2026, the VanEck Morningstar Wide Moat ETF (ASX: MOAT) has shed roughly 6.2% from recent highs, with its 1-year price return sitting at -3.80% through to 30 June 2026.
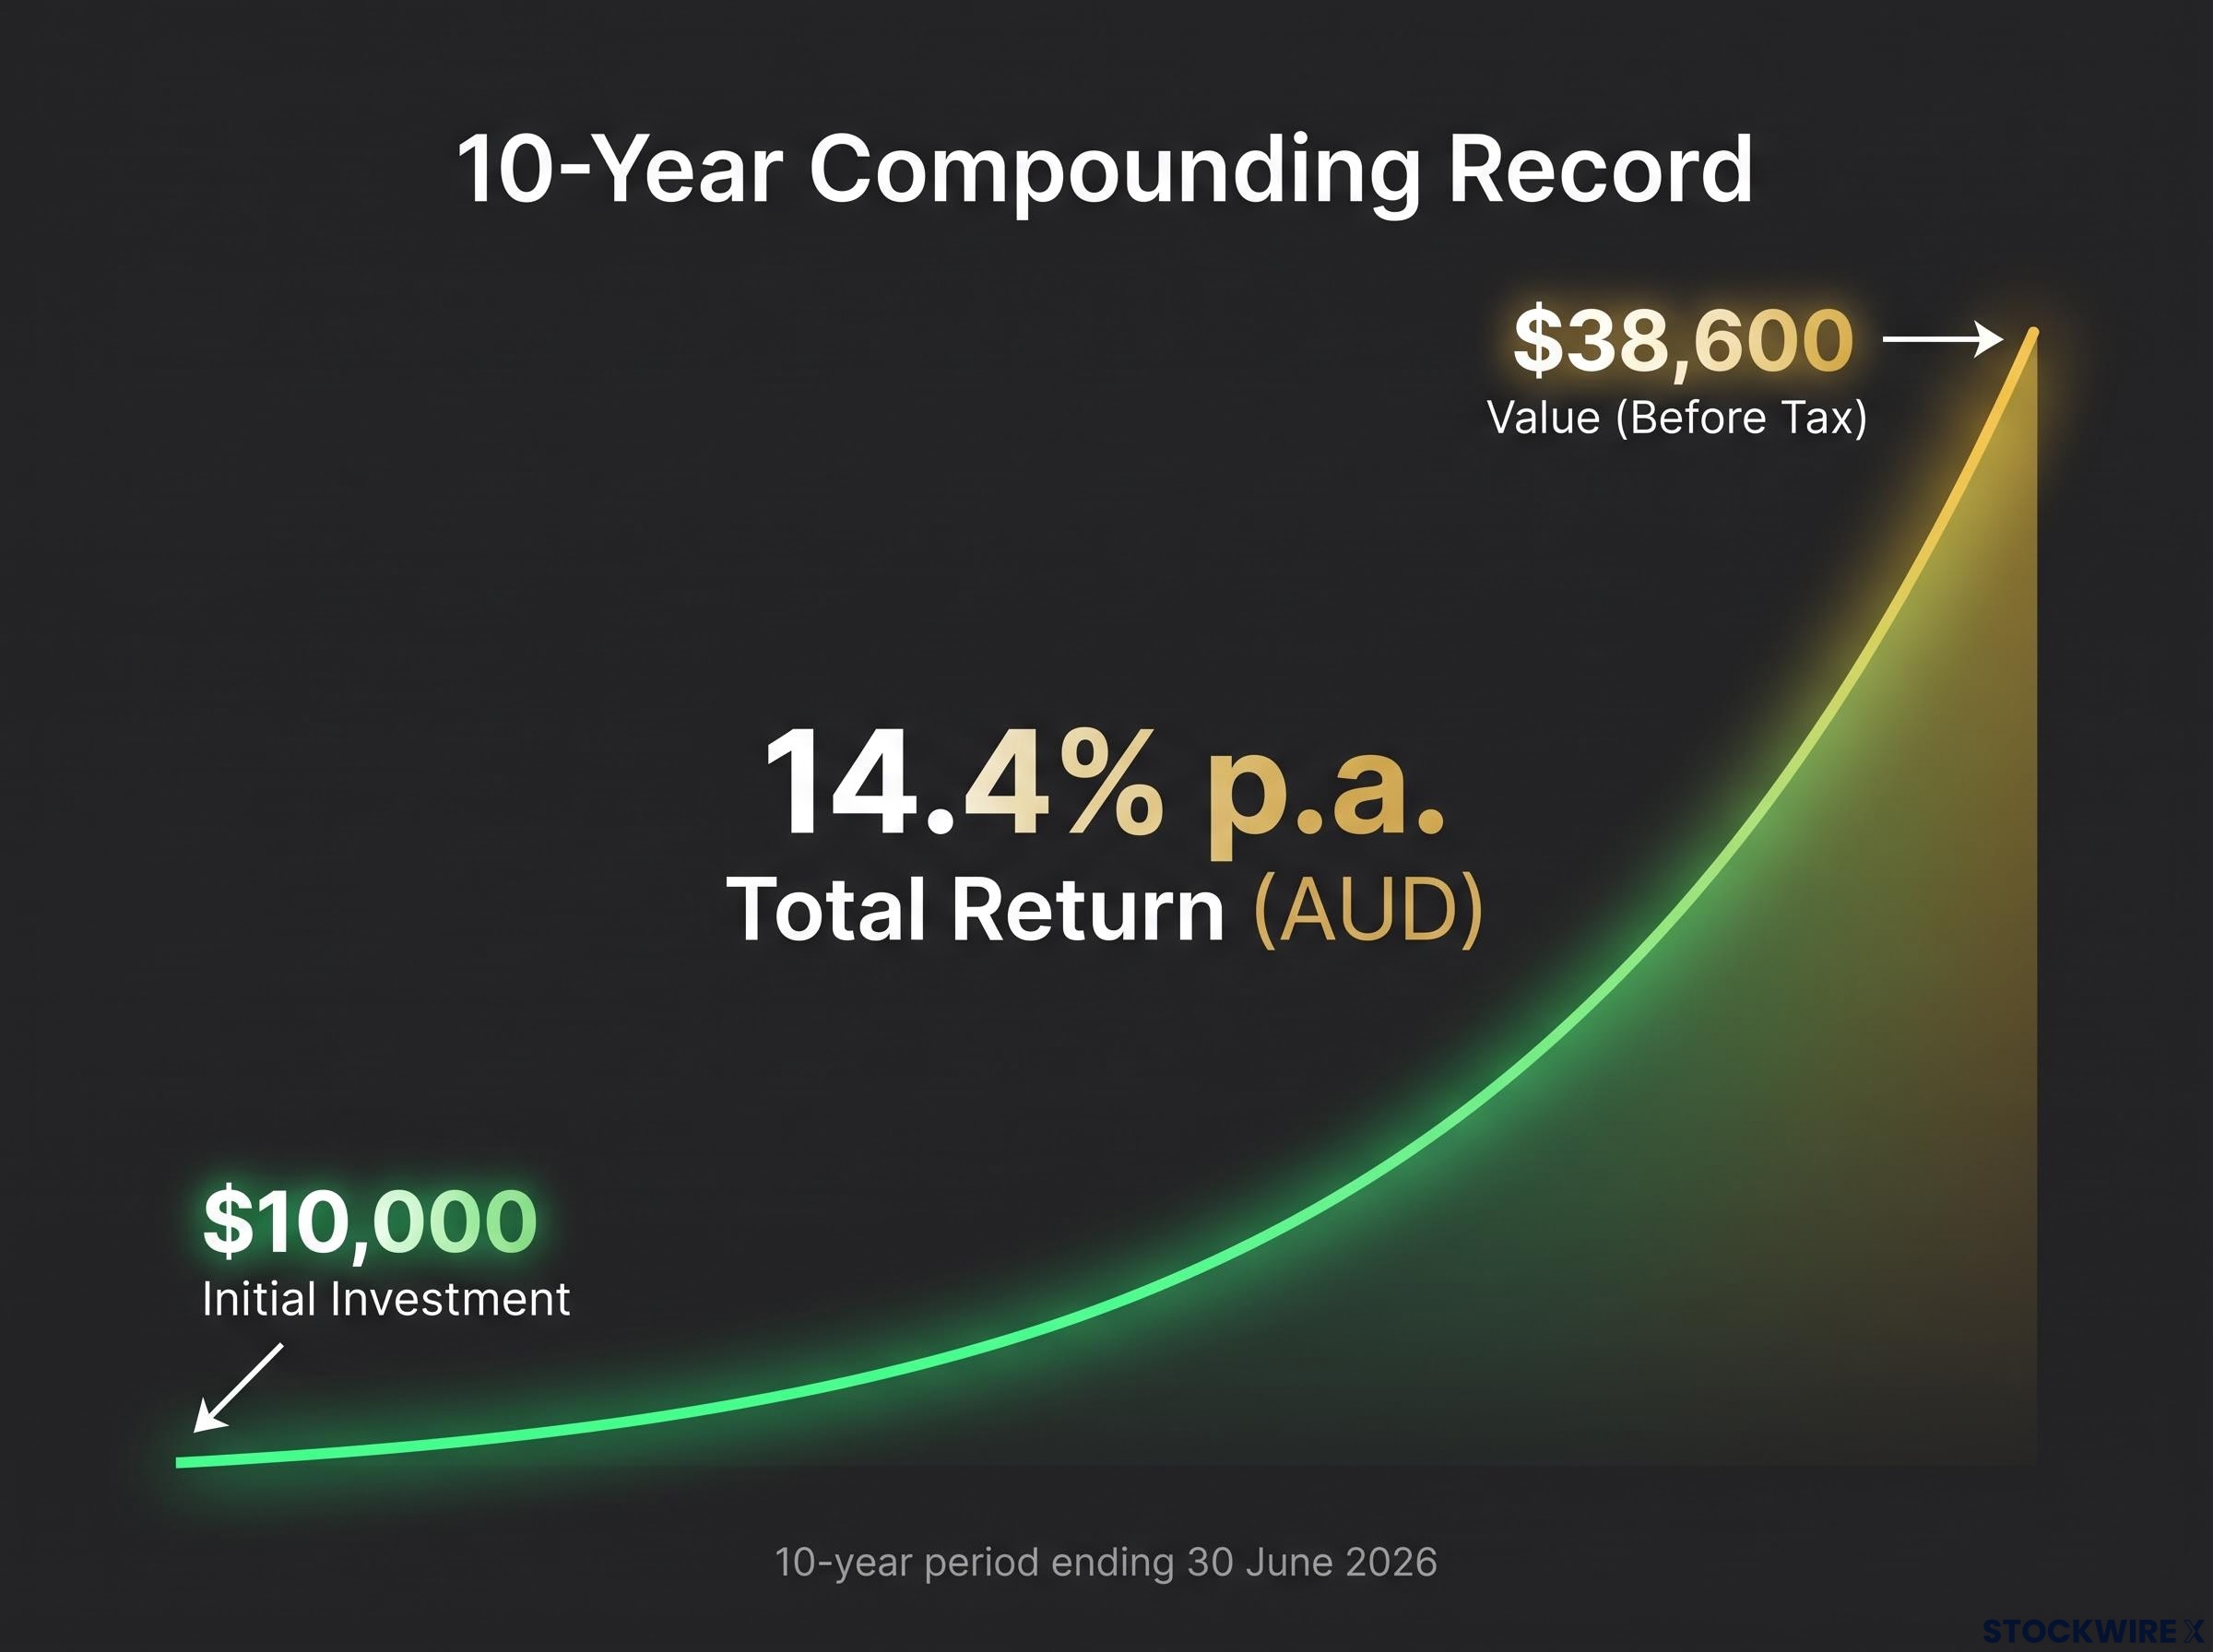
That number looks uncomfortable against the fund’s own history. Over the past decade, MOAT has delivered annualised total returns of 14.4% p.a. in AUD, a record that turned $10,000 into approximately $38,600. But over the most recent 1-year and 3-year windows, it has meaningfully underperformed the S&P 500. For an Australian investor weighing up whether to buy, hold, or walk away, that gap between the long-term record and the short-term reality is the question worth examining closely.
Here is the framework for making that call: what the wide-moat philosophy actually commits the fund to doing, why that philosophy has been a headwind over the past three years specifically, and whether the current dip looks more like a structural warning or a style-cycle pattern that this fund has navigated before.
The economic moat idea and why it shapes everything this fund does
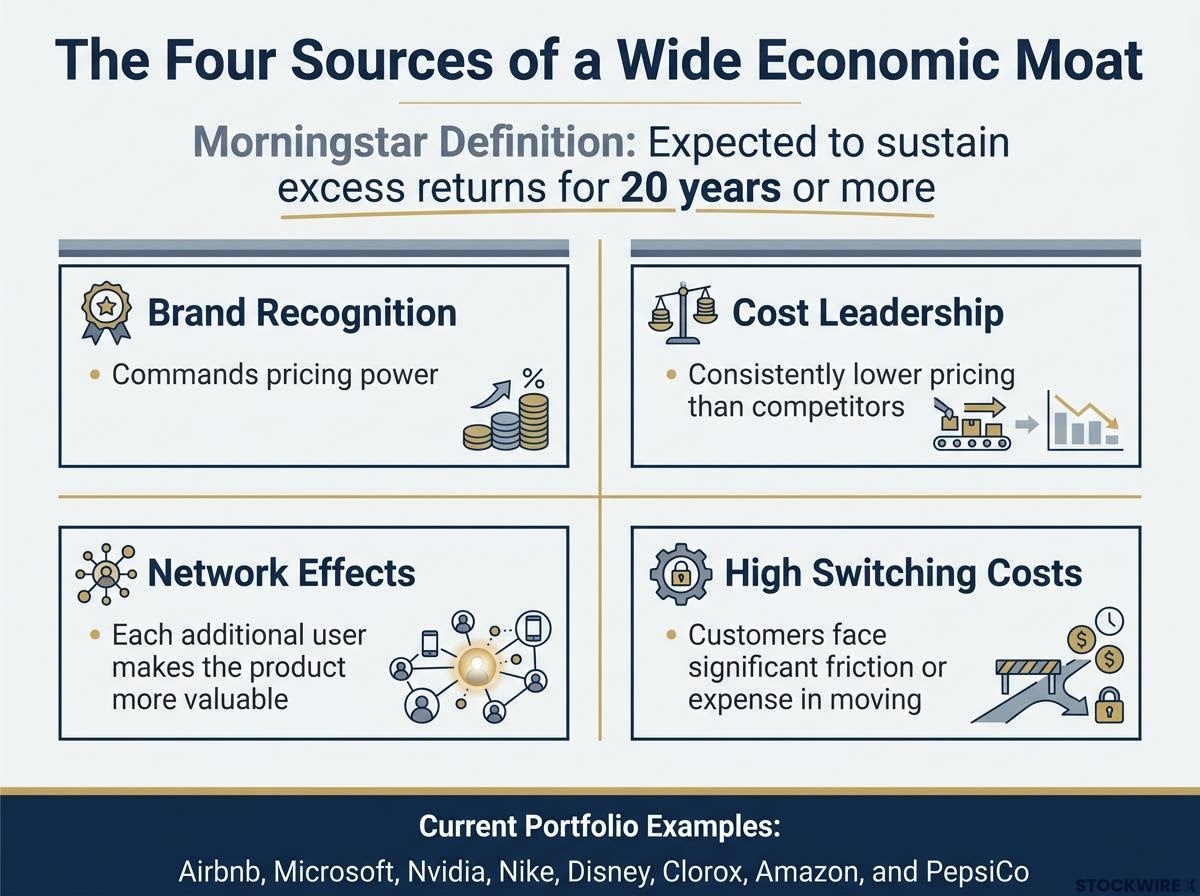
The concept is Warren Buffett’s. A company with an economic moat possesses a durable structural edge that prevents competitors from eroding its market position while keeping customers loyal over time. Morningstar, which provides the index MOAT tracks, defines “wide moat” companies as those expected to sustain excess returns for 20 years or more.
The sources of those moats vary, but they cluster around four identifiable advantages:
- Brand recognition that commands pricing power
- Cost leadership that enables consistently lower pricing than competitors
- Network effects, where each additional user makes the product more valuable for all users
- High switching costs, where customers face significant friction or expense in moving to a competitor
MOAT’s current holdings reflect that diversity. Names like Airbnb, Microsoft, Nvidia, Nike, Disney, Clorox, Amazon, and PepsiCo span consumer brands, technology platforms, and defensive staples. What unites them is not sector; it is the Morningstar assessment that each holds a wide moat.
Pricing power as a moat signal is considered the single most actionable diagnostic for individual investors because it can be assessed directly from public data: earnings transcripts, annual reports, and competitor filings all reveal whether a business is raising prices without losing volume, which is the clearest real-world expression of a durable competitive advantage.
How Morningstar builds the portfolio from moat-qualified companies
Qualifying as a wide-moat company is necessary but not sufficient. Morningstar applies a valuation screen on top of moat qualification, constructing the Morningstar Wide Moat Focus NR AUD Index from wide-moat companies that are also trading at attractive prices relative to Morningstar’s fair value estimates. The portfolio is rebalanced annually.
This dual filter, quality plus valuation, is not cosmetic. It means the fund will routinely hold different companies at different weights compared to the S&P 500. When the most expensive mega-cap growth names are driving the index, MOAT’s methodology deliberately underweights them. That is a feature of the design, not a portfolio manager making an active bet. Investors who expect MOAT to track the S&P 500 closely have misunderstood the product they own.
The equal-weighted construction of the index means that at each annual rebalance, every position is reset to roughly the same allocation regardless of market capitalisation, a design choice that structurally limits the fund’s exposure to the most expensive mega-cap names and explains much of its divergence from cap-weighted US indices over the 2023-2026 period.
When big ASX news breaks, our subscribers know first
What the 10-year return record actually tells you
Start with the anchor figure. Looking at performance to 30 June 2026, MOAT has compounded at 14.4% p.a. in total returns over ten years, combining a 10.10% p.a. price return with a 4.30% p.a. income return. Extend the window back to the fund’s launch in June 2015 and the annualised total return across the full period comes to 13.94% p.a.
What compounding at 14.4% p.a. looks like: A $10,000 investment held for the full decade would have grown to approximately $38,600 before tax, a near-quadrupling of capital through a period that included the 2020 crash, the 2022 rate-hiking cycle, and the AI-driven bull market.
Now introduce the comparison. Over the same 10-year window, the S&P 500 returned 15.62% p.a. in AUD. MOAT has lagged, but the gap is narrower than recent headlines suggest, and the absolute return is strong across a full market cycle.
Here is where it gets interesting for an Australian investor. In USD terms, the US-listed version of MOAT has actually marginally outperformed the S&P 500 over 10 years: 14.32% p.a. versus 14.22% p.a. The fact that MOAT outperforms in USD but slightly underperforms in AUD tells you that currency is doing meaningful work in your result. A strengthening Australian dollar is a real headwind to your returns even when the underlying US companies perform well.
| Period | MOAT (AUD) | S&P 500 (AUD) | MOAT (USD) |
|---|---|---|---|
| 1-year total return | +5.97% | 15.30% | — |
| 3-year total return (p.a.) | 8.79% | 18.54% | — |
| 10-year total return (p.a.) | 14.40% | 15.62% | 14.32% |
| Since inception (p.a.) | 13.94% | — | — |
Returns to 30 June 2026. Source: VanEck fact sheet data. S&P 500 USD 10-year return: 14.22% p.a.
The 10-year figure is the most honest signal available about what this fund’s philosophy can deliver across full cycles. It is the number that matters most if your time horizon is measured in years rather than quarters.
Why MOAT has lagged recently, and what is actually driving it
The recent numbers deserve a genuine explanation, not a dismissal. MOAT’s 1-year price return of -3.80% and 3-year total return of 8.79% p.a. versus the S&P 500’s 18.54% p.a. represent real underperformance across a meaningful window.
Four factors are operating together:
- Valuation discipline versus momentum. When a narrow group of AI-driven mega-cap stocks powers the S&P 500 higher, MOAT’s methodology is designed to underweight those names if they trade at stretched valuations. Over the 2023-2026 window, that underweight has been the primary performance drag. The philosophy is working exactly as intended; it is the market that is rewarding the opposite factor tilt.
- Sector and factor tilts. Relative to the S&P 500, MOAT carries a quality-and-value lean. When markets reward aggressive growth and momentum more than valuation discipline, that lean translates directly into short-term underperformance.
- Currency effects. All of MOAT’s underlying holdings are US-listed. Every return period for an ASX investor includes the AUD/USD currency overlay, and movements in the Australian dollar affect your result independently of how well the companies themselves perform.
Currency hedging decisions carry particular weight for ASX investors in unhedged US equity funds: the AUD appreciated approximately 20% against the USD between January 2025 and May 2026, a move that erased a meaningful portion of underlying equity gains for holders of unhedged international ETFs regardless of how well the companies themselves performed.
- Distribution mechanics. The 1-year figures show a -3.80% price return alongside a +9.77% income return. That is not a paradox; it is how fund distributions work.
Why a negative price return can still mean a positive investor outcome
When MOAT pays a large distribution, whether from dividends, capital gains, or a combination, the unit price falls by approximately the distribution amount on the ex-distribution date. That mechanical price drop makes the price return look weak even when investors have received substantial cash.
Total return, which combines price movement and income received, is the correct measure of investor experience. In this case, the +5.97% total return is what investors actually received over the year. The -3.80% price return on its own overstates the pain.
Taken together, these four factors point toward a style-cycle explanation rather than a thesis-breaking one. The wide-moat philosophy has not stopped working. It is working as designed in a market that is temporarily rewarding the opposite set of characteristics.
AQR’s research on factor investing cycles documents the pattern directly: quality and value factors can underperform for extended periods when markets reward momentum, yet their long-run properties remain intact, which is precisely the dynamic MOAT investors are navigating across the 2023-2026 window.
Reading the current price dip as a potential entry signal
The 6.2% unit price drawdown from recent levels as of 22 July 2026 puts an investor today in a specific position: you are buying into the same Morningstar-screened, valuation-filtered, wide-moat basket at a lower price than buyers paid weeks ago. The methodology has not changed. The selection discipline has not changed. The price has.
That matters because value-oriented strategies tend to generate their best subsequent returns precisely when they are bought at depressed levels relative to recent history. The fund’s 10-year track record was built through the 2020 crash, the 2022 rate-hiking environment, and the AI bull market. Investors who captured the full decade held through windows that looked as uncomfortable as this one.
Practitioner perspective (not financial advice): The original source article’s author disclosed a long-term personal holding in MOAT and stated they are evaluating adding further units at current prices. The author also holds VAS and VSO but considers neither to be particularly attractively priced at current levels. This is one experienced investor’s assessment, not a recommendation.
The distinction worth drawing is between a tactical entry and a long-term allocation. A tactical trade demands conviction about short-term price recovery. A long-term allocation demands conviction that the philosophy will compound over a full cycle. The 10-year record supports the second proposition; the first remains unpredictable.
This article is for informational purposes only and should not be considered financial advice. Investors should conduct their own research and consult with financial professionals before making investment decisions.
How MOAT fits into an ASX investor’s portfolio
Most ETF investors hold more than one fund. The relevant question is not whether MOAT is good in isolation but what it adds and what it introduces to a portfolio that likely already includes domestic exposure.
For an investor holding broad Australian equities through something like VAS and small-cap exposure through VSO, MOAT adds a layer that neither provides:
- Targeted US exposure to companies judged to hold durable competitive advantages
- Geographic and business-model diversification away from the ASX’s heavy concentration in financials and resources
- A quality-and-valuation filter that is structurally different from cap-weighted indexing
That comes with three specific risk considerations:
Concentration risk in factor ETFs is often underestimated because the fund name implies diversification: a 40-50 stock portfolio can produce return dispersion that is substantially larger than a 200-stock index, and sector-level underperformance has a proportionally greater impact when each position carries a 2-3% allocation at rebalance.
- Concentration risk. MOAT holds a narrow subset of US stocks. Performance can deviate substantially from the broad US market in either direction.
- Currency risk. All holdings are US-listed and unhedged. AUD/USD movements affect every return period. A strengthening Australian dollar will reduce your AUD returns even if the underlying stocks perform well.
- Higher fees. MOAT’s management cost is meaningfully higher than the very low fees charged by plain-vanilla Australian index ETFs, which typically run at 0.07-0.10% p.a. That is the explicit trade-off for Morningstar’s research-driven selection process.
| What MOAT adds | What it introduces |
|---|---|
| US exposure to quality businesses with identified moats | Concentration risk from a narrow stock selection |
| Geographic diversification away from ASX financials and resources | Unhedged AUD/USD currency exposure |
| Valuation-screened portfolio distinct from cap-weighted indexing | Style divergence risk; extended periods of S&P 500 underperformance |
If you already hold VAS and VSO, adding MOAT is not redundant diversification. It is a deliberate tilt toward quality US businesses. The question is whether you are comfortable with the currency exposure and style-cycle volatility that accompany it.
What the track record and current conditions together suggest for long-term investors
The core tension is straightforward. MOAT’s 10-year record of 14.4% p.a. demonstrates that the wide-moat philosophy works over full cycles. The 3-year return of 8.79% p.a. versus the S&P 500’s 18.54% p.a. demonstrates that it can underperform meaningfully for extended periods when the market rewards momentum and mega-cap concentration.
These two figures are not a contradiction. Together, they are the most important data point in the entire analysis. Style cycles are long, uncomfortable, and survivable. That is precisely what long-term investors in a quality-tilted fund need to understand before committing capital.
The 14.4% p.a. decade-long return was earned by investors who held through the uncomfortable periods, not those who timed exits around short-term underperformance. The since-inception return of 13.94% p.a. confirms the long-run figure is not a statistical artefact of the specific 10-year window.
Since-inception annualised total return: 13.94% p.a. (June 2015 to 30 June 2026, AUD). Source: VanEck fact sheet.
The decision in front of you is not whether MOAT is good or bad in the abstract. It is whether you are positioned for a quality-and-valuation style tilt in US equities, with a multi-year time horizon and genuine comfort with currency volatility and periods where the headline index pulls ahead. If that describes your situation, the current dip gives you a lower entry point into a philosophy that has delivered across the only timeframe that ultimately matters: a full market cycle.
Past performance does not guarantee future results. Financial projections are subject to market conditions and various risk factors.