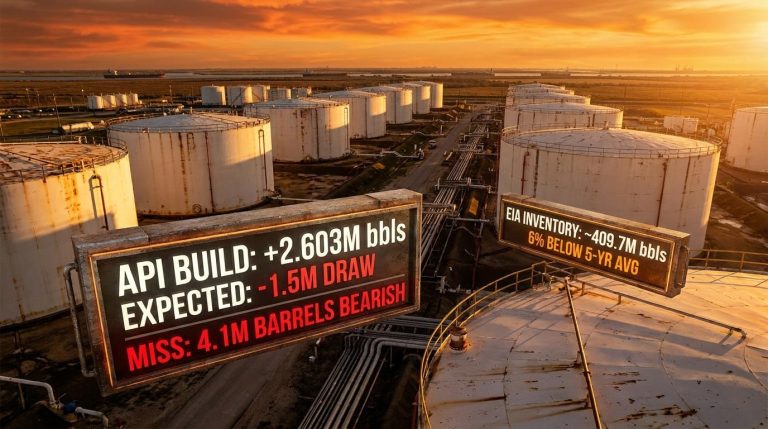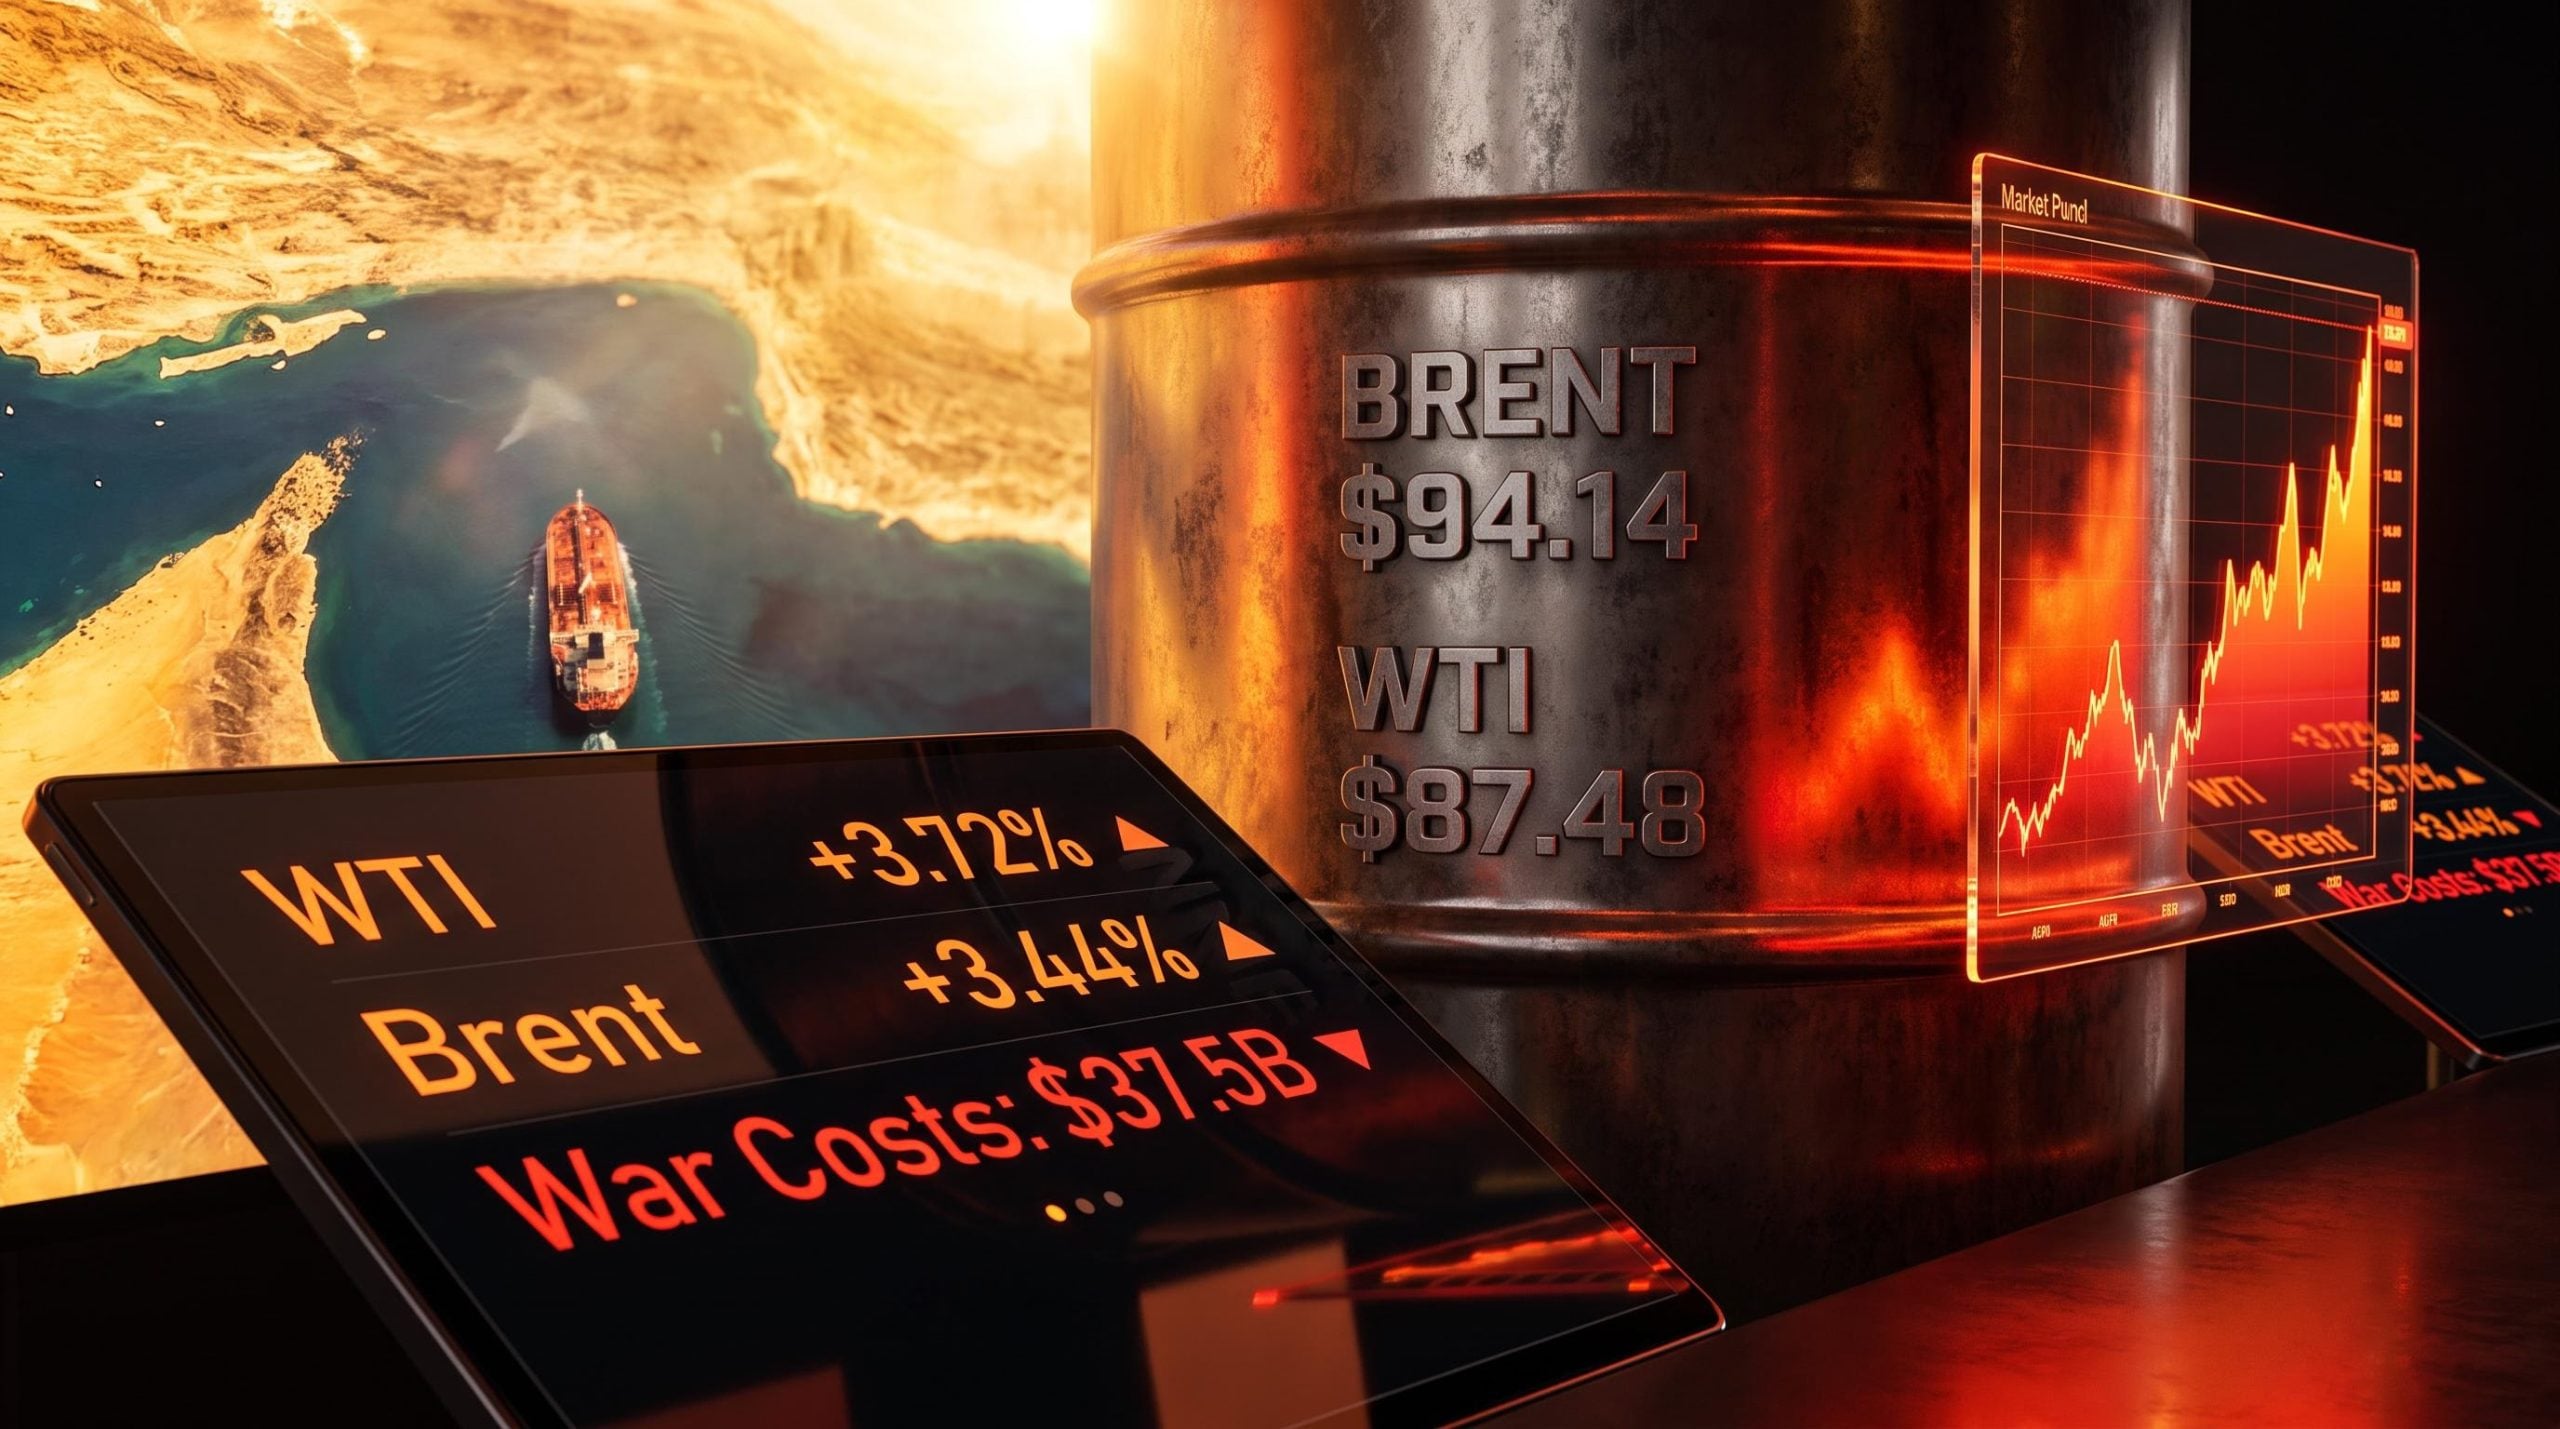
Eleven days of reciprocal military strikes between the United States and Iran have pushed oil prices to a five-week high, with WTI crude at $87.48 and Brent crossing $94.14 on 22 July 2026. Defence Secretary Pete Hegseth has confirmed that total war expenditures stand at $37.5 billion, and the pace of escalation, including threats against Iranian nuclear facilities, has left energy markets pricing in a conflict that shows no sign of pausing.
This is not just an energy story. Oil at these levels is a potential inflation event, one that touches Federal Reserve rate decisions, equity valuations, and the cost of groceries, petrol, and credit. The Strait of Hormuz carries roughly 20% of global oil flows, so every escalation headline doubles as a supply-chain risk with worldwide reach.
Here is what the current market data tells you about how the conflict is transmitting from geopolitics into asset prices, inflation risk, and the interest rate path, and which variables will determine whether this remains a contained shock or becomes something larger.
Why oil moved sharply and what the Strait of Hormuz has to do with it
Start with the geography. The Strait of Hormuz is a narrow waterway between Iran and Oman that funnels approximately 20% of global oil supply to market every day. There is no substitute route of comparable scale. When military operations threaten shipping through Hormuz, the risk premium does not wait for a tanker to be physically blocked. It prices in immediately.
The eleven-day escalation arc explains why. American forces widened their military campaign following the deaths of three U.S. service members during the preceding weekend. President Donald Trump put Iran’s nuclear facilities directly in his crosshairs, prompting Tehran to warn of severe repercussions. Each step widened the conflict’s footprint and deepened the market’s assessment that this is not a brief skirmish.
The price data reflects that assessment:
- WTI Crude Futures: $87.48, up $3.14 (+3.72%) on 22 July 2026
- Brent Oil Futures: $94.14, up $3.13 (+3.44%)
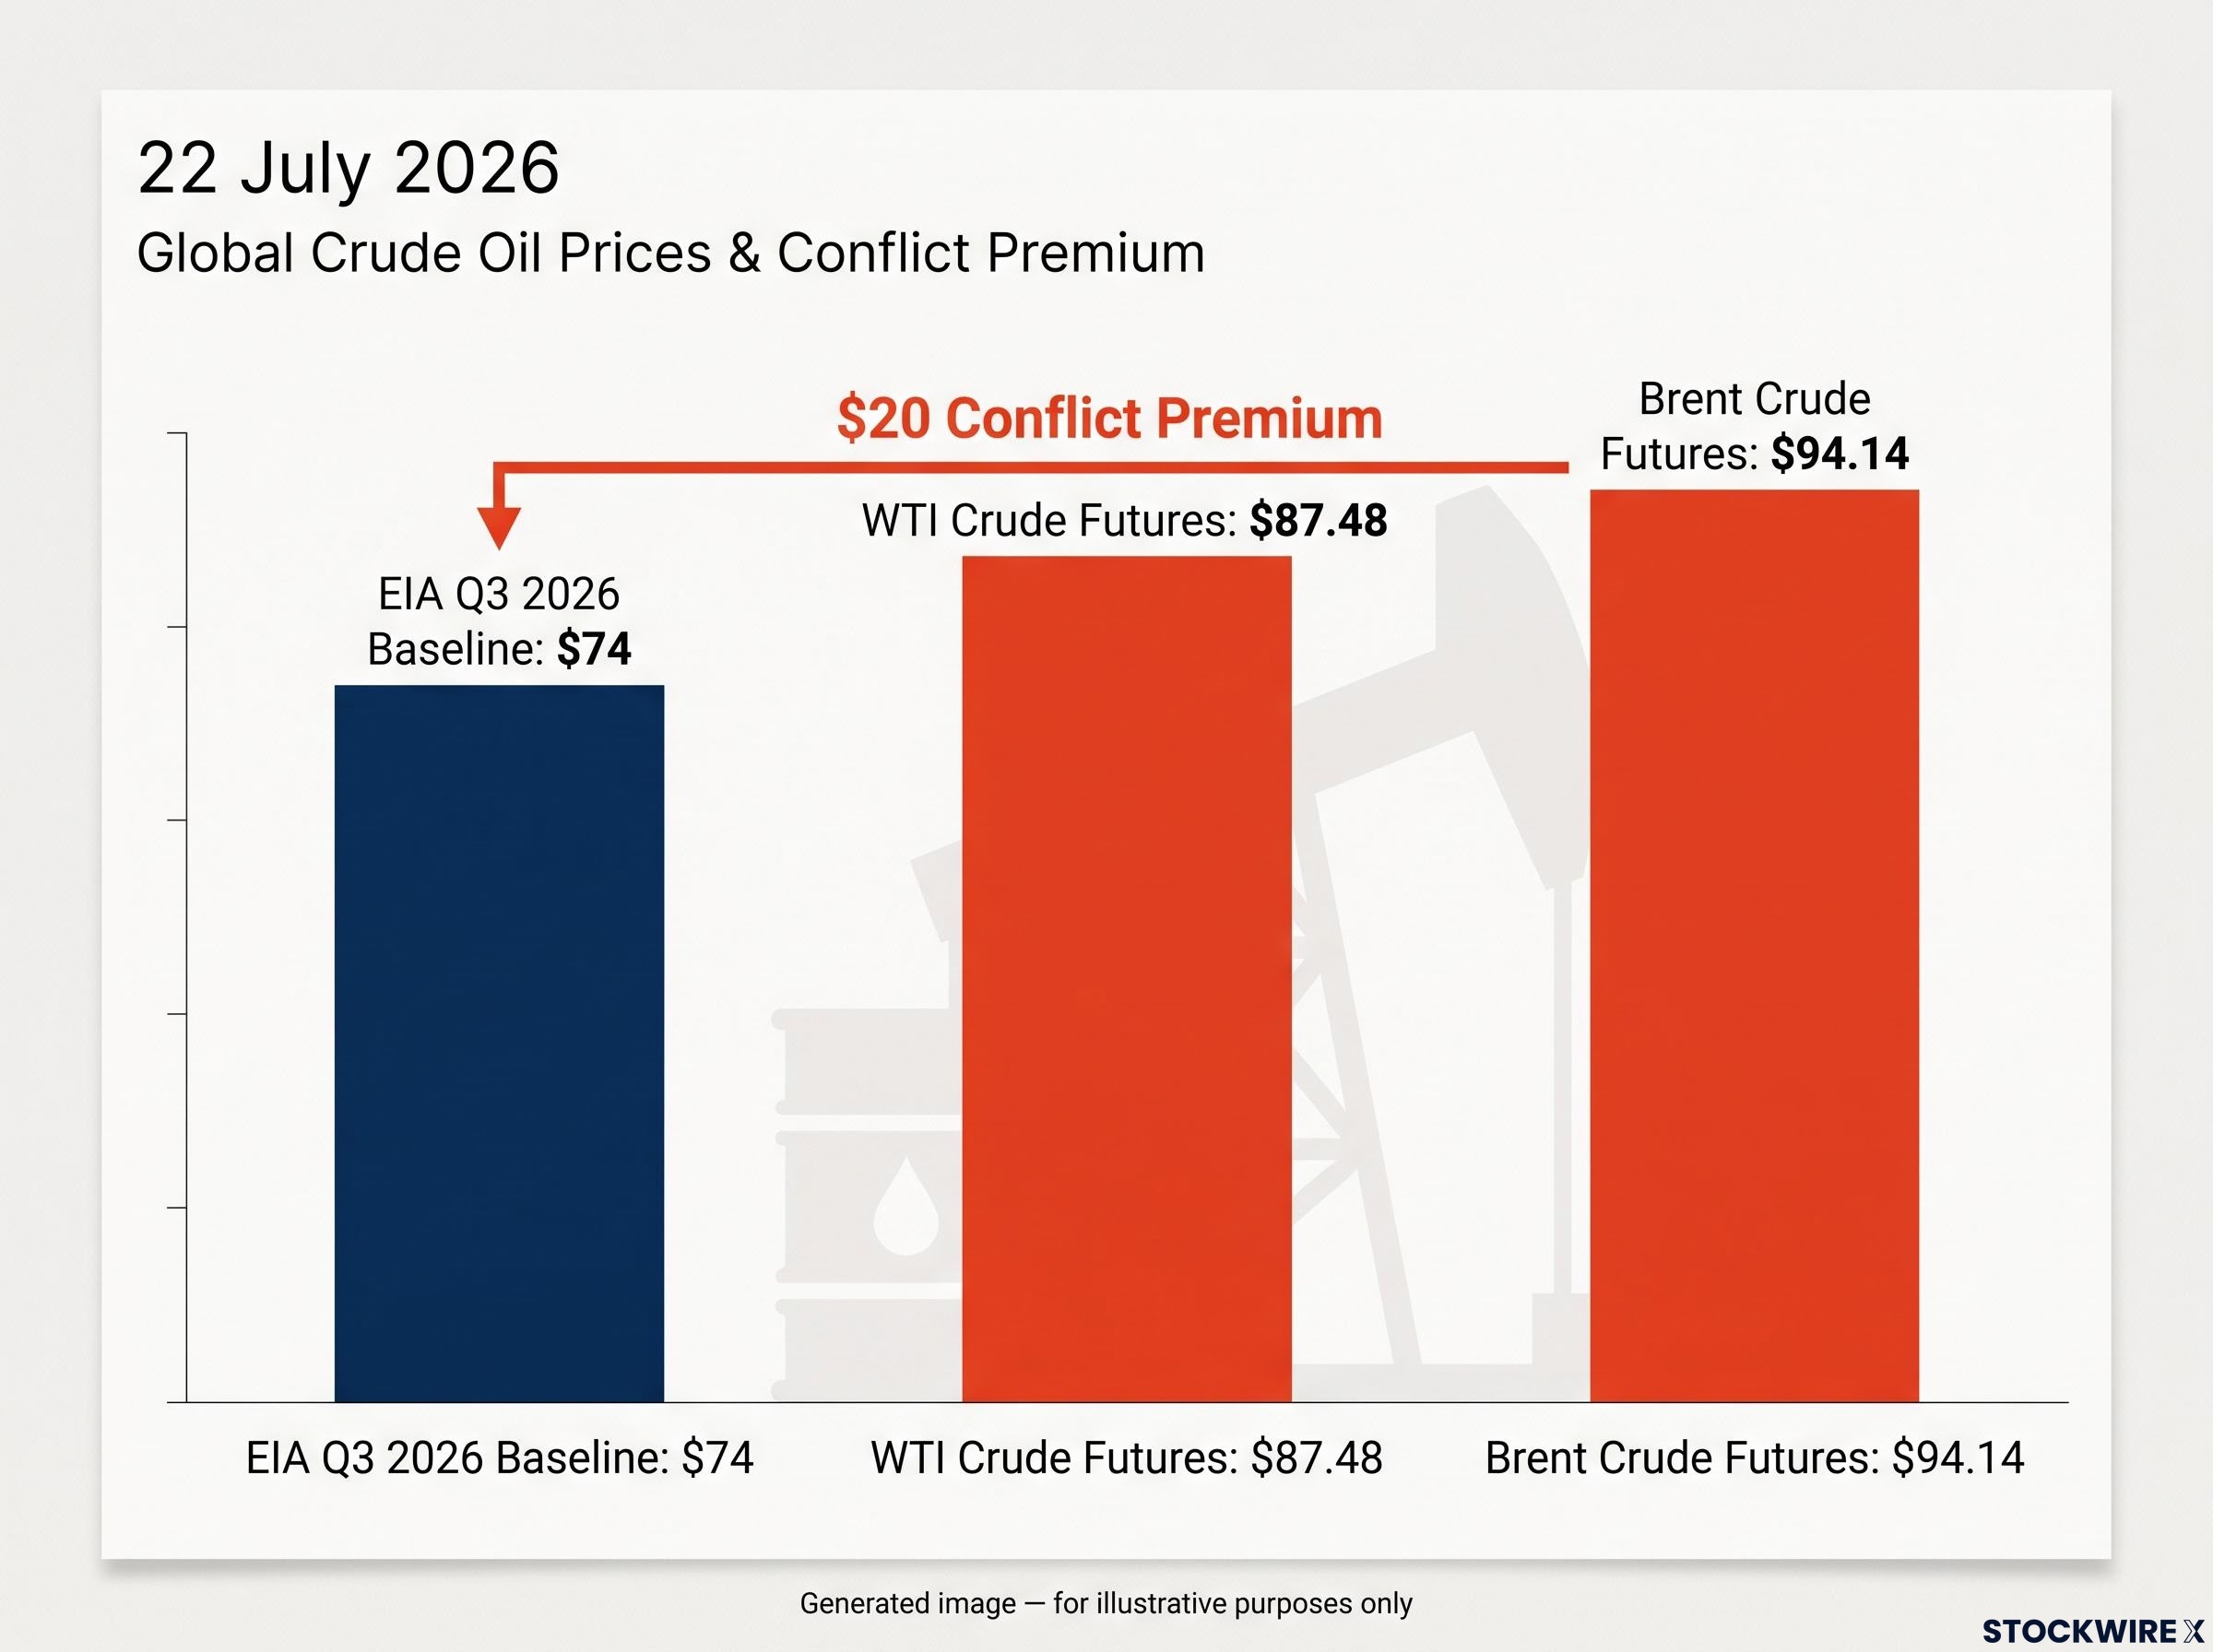
- EIA non-escalation baseline: Brent averaging $74 per barrel in Q3 2026
War costs at $37.5 billion. Defence Secretary Pete Hegseth put the total bill at $37.5 billion on 22 July 2026, with the Trump administration pressing Congress for additional funding to sustain the campaign. That level of expenditure signals a conflict operating at a scale and pace markets cannot dismiss.
The gap between the EIA’s $74 baseline and today’s $94.14 Brent price is the measurable cost of this conflict embedded in every barrel of oil. That $20 premium exists as long as the threat to Hormuz persists, and it ripples outward from the energy sector into inflation, interest rates, and consumer costs.
The Hormuz risk premium does not behave like a standard supply shock; the near-total withdrawal of commercial war-risk insurance effectively closes the strait to standard commercial traffic even when physical passage remains technically possible, meaning price decompression runs on a timeline measured in months rather than days.
When big ASX news breaks, our subscribers know first
How an oil shock travels from the Gulf to your grocery bill
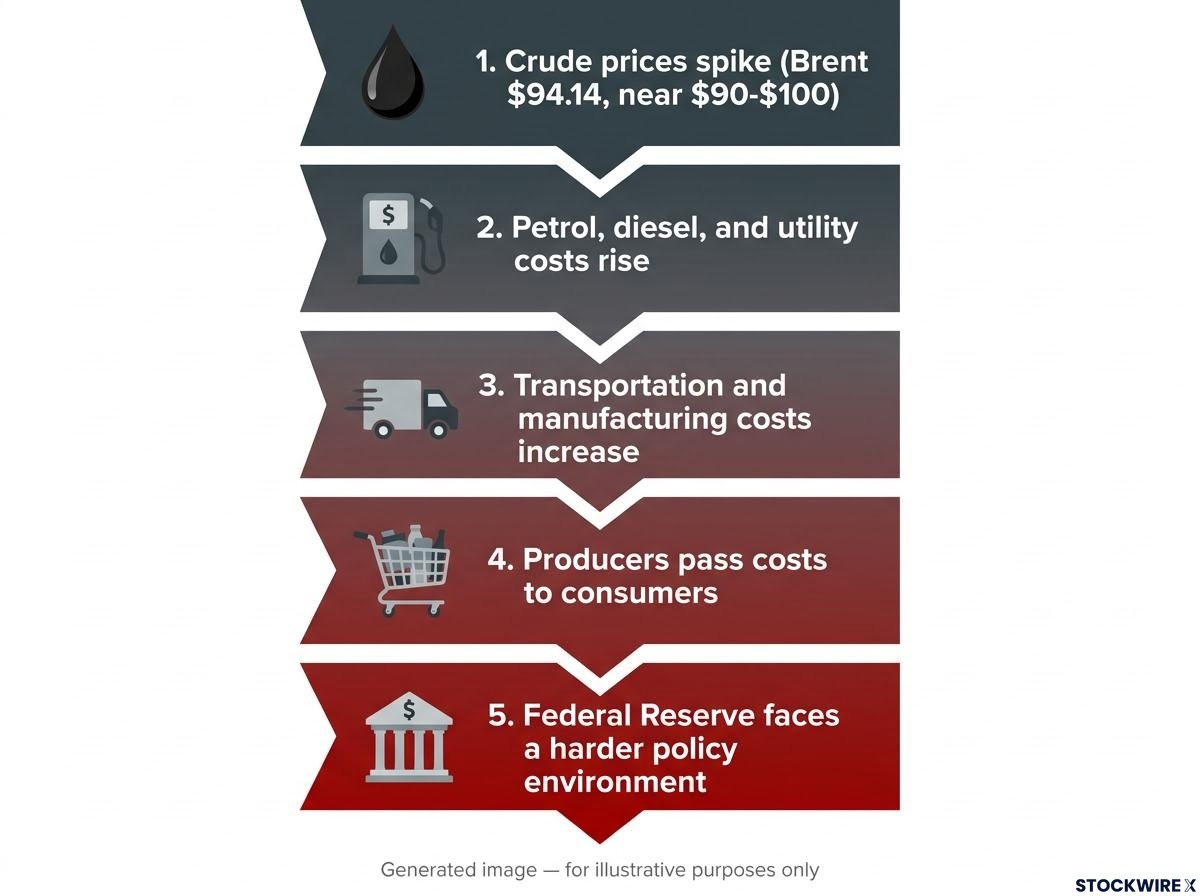
The transmission chain from a crude spike to your household budget follows a predictable sequence, and understanding each step matters because each one compounds the next:
- Crude prices spike on supply disruption fears (Brent at $94.14, already near the $90-$100 threshold analysts flag as material to inflation).
- Petrol, diesel, and utility costs rise almost immediately for households and businesses.
- Transportation and manufacturing costs increase as higher fuel bills flow through supply chains.
- Producers pass those costs to consumers across a wide range of goods and services, from food to freight.
- The Federal Reserve faces a harder policy environment if sustained energy costs add basis points to monthly core inflation readings.
Recent U.S. data show energy-driven consumer price increases posting their fastest year-over-year gains in nearly three years, according to Perplexity research (not independently confirmed). That trajectory is consistent with what you would expect when Brent sits this close to $100.
From the pump to the Fed
When Brent holds near or above $90-$100 per barrel for weeks rather than days, the inflation effect stops being a rounding error and starts changing the Fed’s calculus on rate cuts. The 10-year Treasury yield at 4.624% already reflects restricted room for easing.
“Higher for longer” rates are not an abstraction. They mean more expensive mortgages, higher credit card carrying costs, and increased borrowing expenses for businesses with floating-rate debt. The question is no longer whether energy is affecting inflation; it is whether the effect will be large and sustained enough to push the Fed’s timeline further out.
The Fed dot plot division, with the committee splitting exactly nine to nine between officials favouring further hikes and those favouring no change, reflects a policy body that has not resolved how to classify an energy-driven inflation shock that may or may not prove transitory.
How markets are reading the conflict right now
Here is where the data gets interesting. On the same session that oil spiked and gold rallied, equities closed higher. That sounds contradictory, and understanding why it is not tells you something important about how markets process geopolitical risk in real time.
| Asset | Price / Level (22 July 2026) | Change |
|---|---|---|
| S&P 500 | 7,509.20 | +0.89% |
| Nasdaq Composite | 25,837.21 | +1.29% |
| VIX | 17.36 | +1.82% |
| Gold Futures | $4,123.50 | +1.16% |
| Silver Futures | $59.88 | +1.31% |
| U.S. 10-Year Yield | 4.624% | -0.004 ppts |
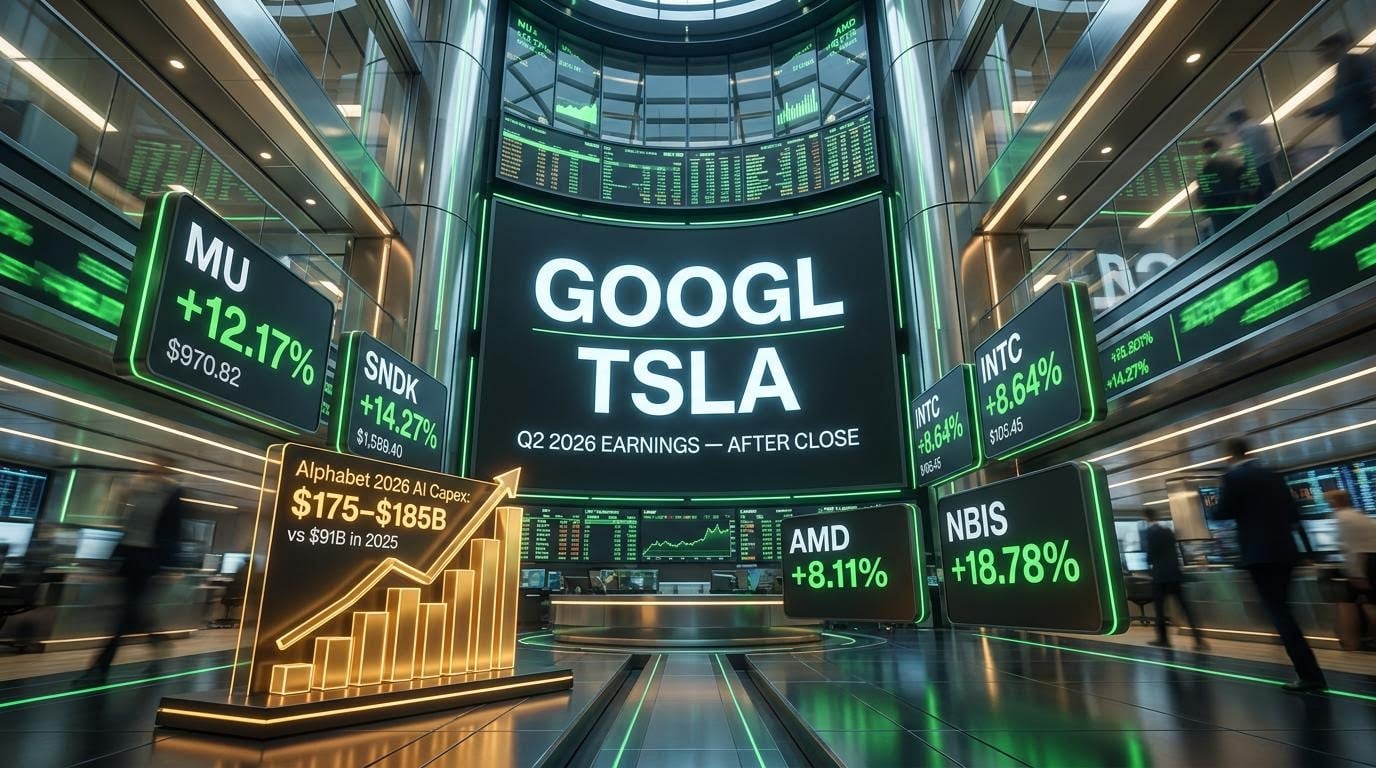
Earnings-driven optimism pushed NVIDIA up 1.97% and Tesla up 2.53%, while Alphabet fell 1.38% and Amazon dropped 0.98%. The divergence is the tell: stock-specific narratives were competing with macro risk, and on this particular session, the earnings side won for the major indices.
VIX at 17.36: Cautious, not panicked. The reading is modestly elevated but well below crisis levels. It signals that markets are repositioning around geopolitical risk without yet treating it as systemic.
The fact that equities, gold, silver, and oil all rose simultaneously tells you markets are not in denial about the conflict. They are choosing, for now, not to reprice it as a systemic threat. The VIX is the best single indicator of when that balance shifts.
The scenarios that decide whether this becomes a macroeconomic shock
Two paths sit in front of markets, and the variables that determine which one plays out are observable right now.
Escalation scenarios:
- Hormuz disruption deepens, with continued targeting of tankers or energy infrastructure keeping a material share of global supply at risk
- Regional actors are drawn into the conflict, magnifying the supply shock and extending its duration
- Ceasefire talks stall and combat operations remain intense for months, producing sustained fuel cost pressure that feeds through to broader prices and slows growth
De-escalation scenarios:
- A durable ceasefire or negotiated pause allows shipping and production to normalise, compressing the risk premium quickly
- Gulf producers ramp output to offset losses, capping crude prices
- The Fed treats the spike as transitory if oil retreats fast enough, reassuring markets about the rate path
The asymmetry matters. The escalation path carries the most direct macro consequences because sustained Brent above $100 is qualitatively different from a spike that reverses in weeks. And the current trajectory, eleven days of strikes, expanding U.S. operations, threats against nuclear facilities, Iran warning of serious retaliation, means the escalation scenario is not a tail risk. It is the current base case trajectory, and investors should be sizing their exposure to rate-sensitive and energy-intensive assets accordingly.
Diplomatic breakdown risk has already demonstrated its market impact in recent weeks; when Iran withdrew from Swiss negotiations in late June 2026, S&P 500 futures dropped 0.6% in a single Sunday session, previewing the kind of sharp repricing that a fresh escalation from the current eleven-day arc could trigger.
Six indicators worth tracking as the conflict evolves
Rather than reacting to individual headlines, tracking these six data points gives you a framework for assessing whether the conflict is deepening into a macroeconomic event or stabilising:
- WTI and Brent crude levels. Currently at $87.48 and $94.14 respectively. Sustained prices above the $90-$100 threshold signal an entrenched war premium and rising inflation risk.
- Inflation expectations in bond markets. Moves in 5-year and 10-year breakeven inflation rates will reveal whether investors are beginning to price an energy-driven inflation resurgence beyond transitory levels.
- VIX trajectory. Currently at 17.36. A sustained move higher signals transition from cautious repositioning to more defensive risk-off behaviour across equities.
- Gold and safe-haven demand. Gold at $4,123.50 alongside persistent Treasury demand indicates geopolitical risk remains a central market driver, not background noise.
- EIA data on Hormuz shipping traffic and Gulf producer output. These physical supply indicators will confirm whether the disruption is worsening or stabilising. The EIA’s $74 non-escalation baseline for Brent in Q3 2026 is the benchmark for measuring the conflict premium.
- Congressional posture on additional war funding. With costs at $37.5 billion and the administration seeking more, fiscal and political dynamics around the conflict’s duration will shape both sentiment and the macro outlook.
The triple-signal threshold: If Brent crosses and holds above $100 while breakeven inflation rates move meaningfully higher and the VIX climbs above 25, those three signals together would constitute the market’s verdict that this conflict has crossed from geopolitical event to macroeconomic shock.
What changes if oil holds here, and what investors should watch for next
The core tension is visible in a single session’s data: the S&P 500 rose 0.89% on the same day Brent climbed to $94.14 and the VIX ticked to 17.36. Markets are resilient today, but that resilience is conditional on the conflict not deepening further.
If oil holds near $90-plus and inflation expectations rise, the sectors facing the sharpest headwinds are the ones most sensitive to the rate path:
- Near-term headwinds: Technology, real estate, and highly leveraged companies face valuation pressure as the Fed’s room to cut narrows
- Near-term beneficiaries: Energy producers and commodity-linked assets gain from elevated prices, though a sudden ceasefire would reverse those gains quickly
War costs at $37.5 billion and active escalation threats make a rapid resolution the lower-probability scenario as of 22 July 2026. The 10-year yield at 4.624% already reflects restricted Fed room, and oil-driven inflation would extend that constraint further.
Today’s market resilience is real but conditional. The specific variables to watch, Brent price, breakeven inflation rates, and VIX trajectory, are the early-warning system for when that condition changes. Track those three, and you will see the shift before it shows up in index prices.
For investors wanting to model the binary outcome structure more precisely, our deep-dive into US-Iran negotiation risk and oil market positioning examines how the negative correlation between US equities and Treasury yields has reached its most extreme level since the late 1990s, with energy equities identified as one of the few partial offsets in a disruption scenario.
This article is for informational purposes only and should not be considered financial advice. Investors should conduct their own research and consult with financial professionals before making investment decisions. Past performance does not guarantee future results. Financial projections are subject to market conditions and various risk factors.