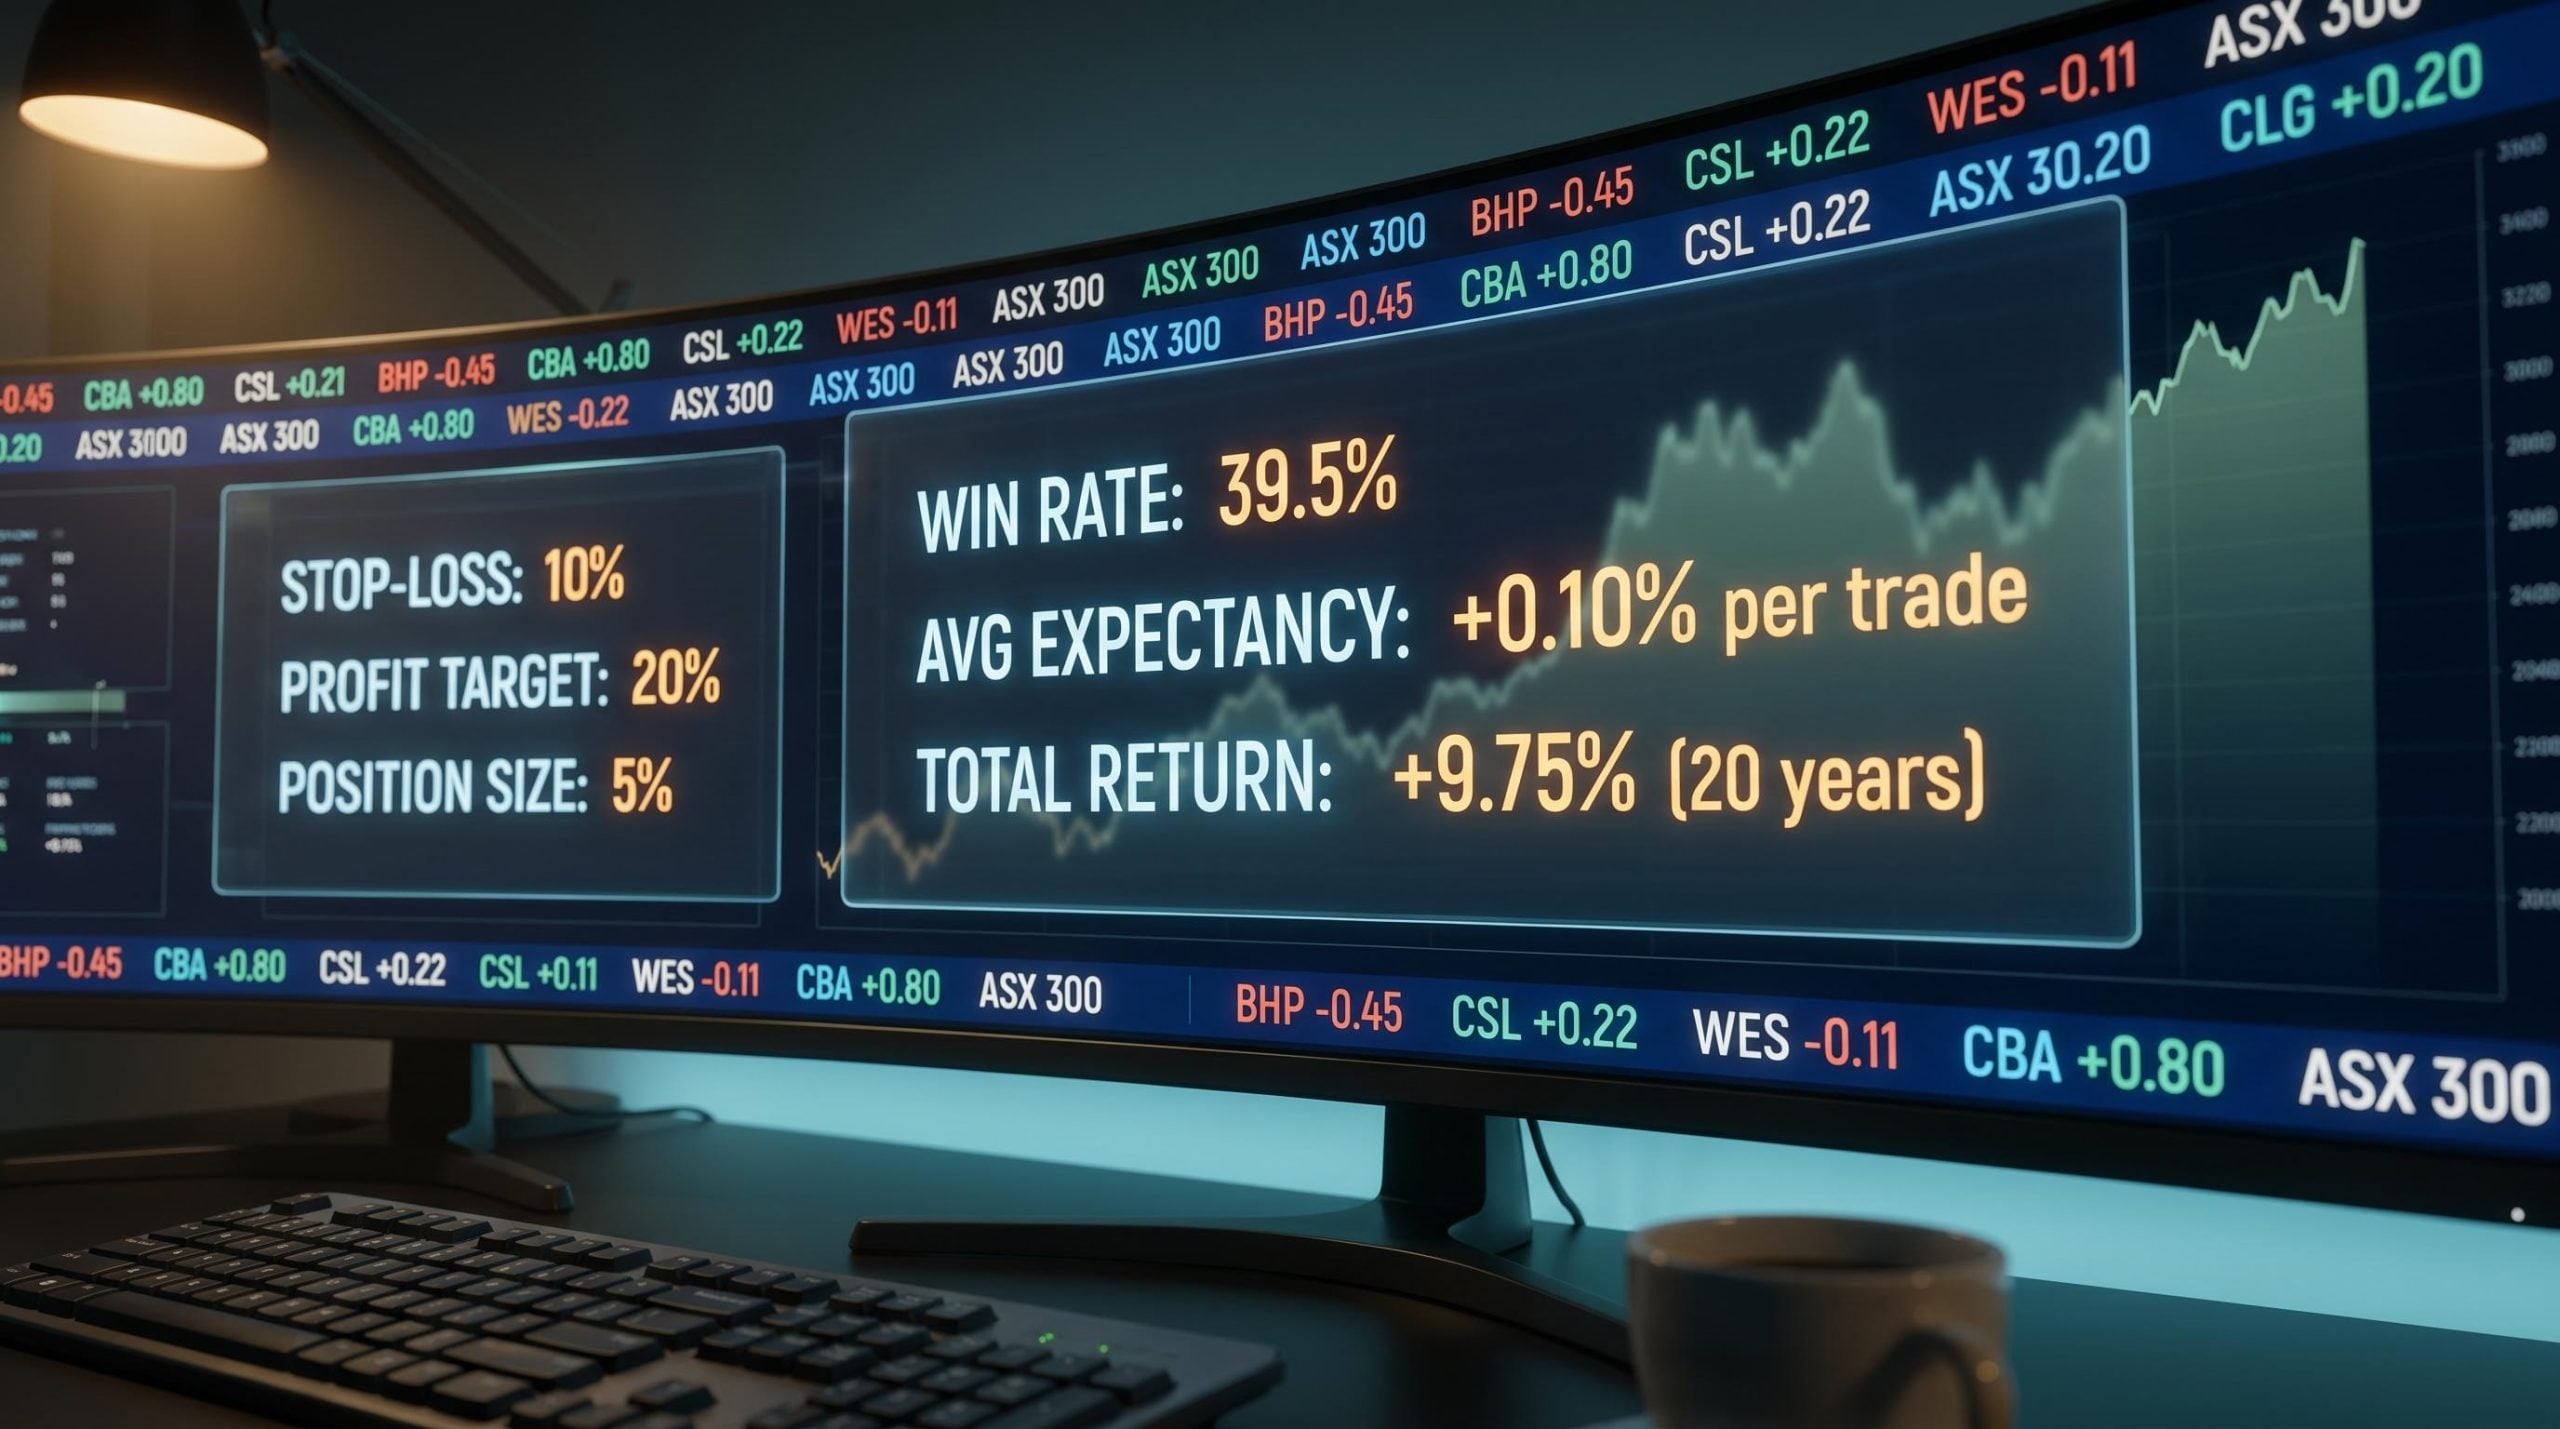
A portfolio that picked stocks by coin flip across the ASX 300 for two decades still made money. No analyst. No research. No edge. Just rules.
The returns came not from any predictive ability, but from three mechanical guardrails applied to every single trade. This is not a thought experiment. It is a structured, survivorship-bias-corrected backtest published by Market Index on 10 July 2026, authored by Carl Capolingua and covering every major market crisis of the past 20 years, from the Global Financial Crisis through to the US tariff disputes.
Here is what the data actually tells you about managing risk in your own portfolio: exactly what those guardrails were, why the mathematics work even with a losing win rate, and what it means for how you structure your positions from here.
What the random-entry ASX backtest actually tested
Carl Capolingua, Lead Writer and Presenter at Market Index, ran 100 separate simulations over a 20-year historical period using Amibroker software and Norgate Data. The universe was the ASX 300, drawn from both historical and current constituents, encompassing every company that existed in the index over the period, whether it survived, collapsed, was taken over, or dropped out of the index altogether.
That survivorship-bias correction is the detail that separates this study from most backtests you will encounter. Unlike the typical “it worked in the past” claim, this dataset included the companies that failed. The results reflect the full, unfiltered reality of what the market served up over two decades.
The defining feature: within each simulation, the stocks selected were chosen at random. The system carried no analytical judgement whatsoever. It made long or short decisions on eligible stocks purely by chance, with no human input at any stage.
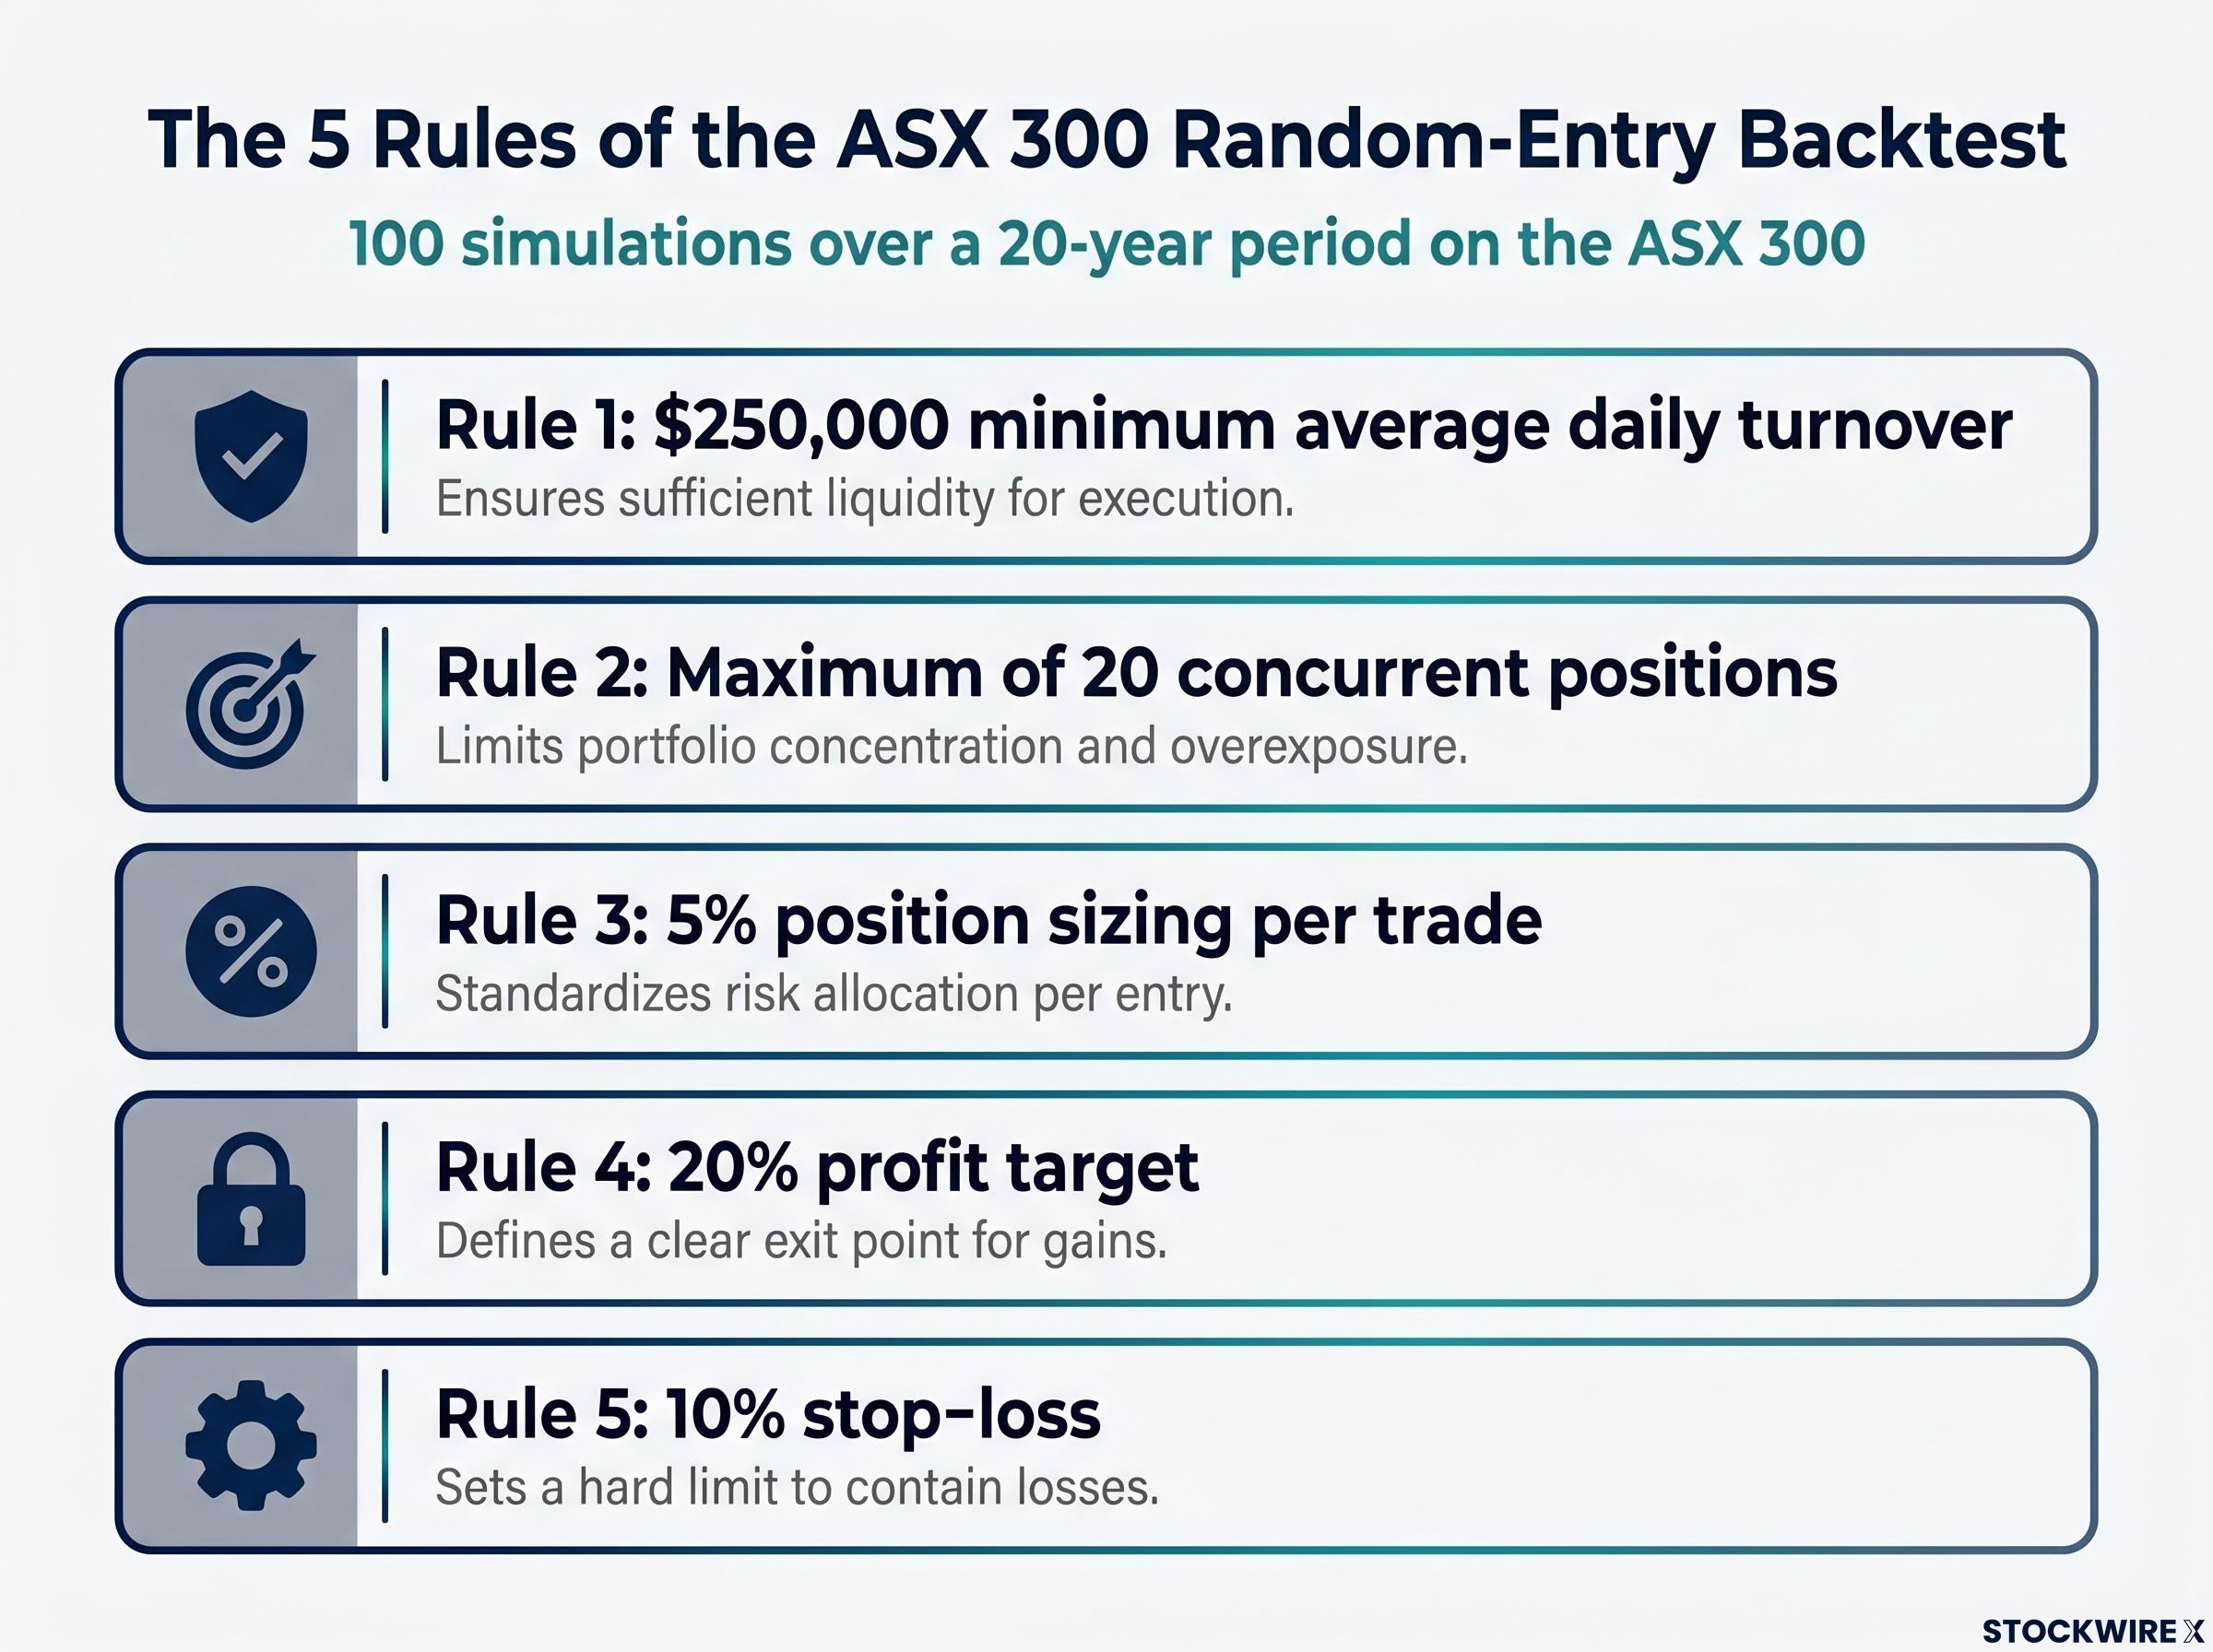
Each simulation followed five fixed rules:
- A $250,000 minimum average daily turnover filter to ensure liquidity
- A maximum of 20 concurrent positions at any time
- 5% position sizing per trade, based on total portfolio equity
- A 20% profit target on every position
- A 10% stop-loss, with no discretionary overrides permitted
No gut feel. No conviction calls. No overrides during volatility. Just the rules, applied identically across all 100 runs.
When big ASX news breaks, our subscribers know first
The numbers: what 20 years of random trading produced
The results were positive, but modest. That combination is precisely what makes them instructive.
| Metric | Result |
|---|---|
| Average total return (20 years) | +9.75% |
| Median total return (20 years) | +6.61% |
| Average CAGR | 0.27% per annum |
| Median CAGR | 0.32% per annum |
| Win rate | 39.5% |
| Average winning trade | +14.13% |
| Average losing trade | -9.08% |
| Average expectancy per trade | +0.10% |
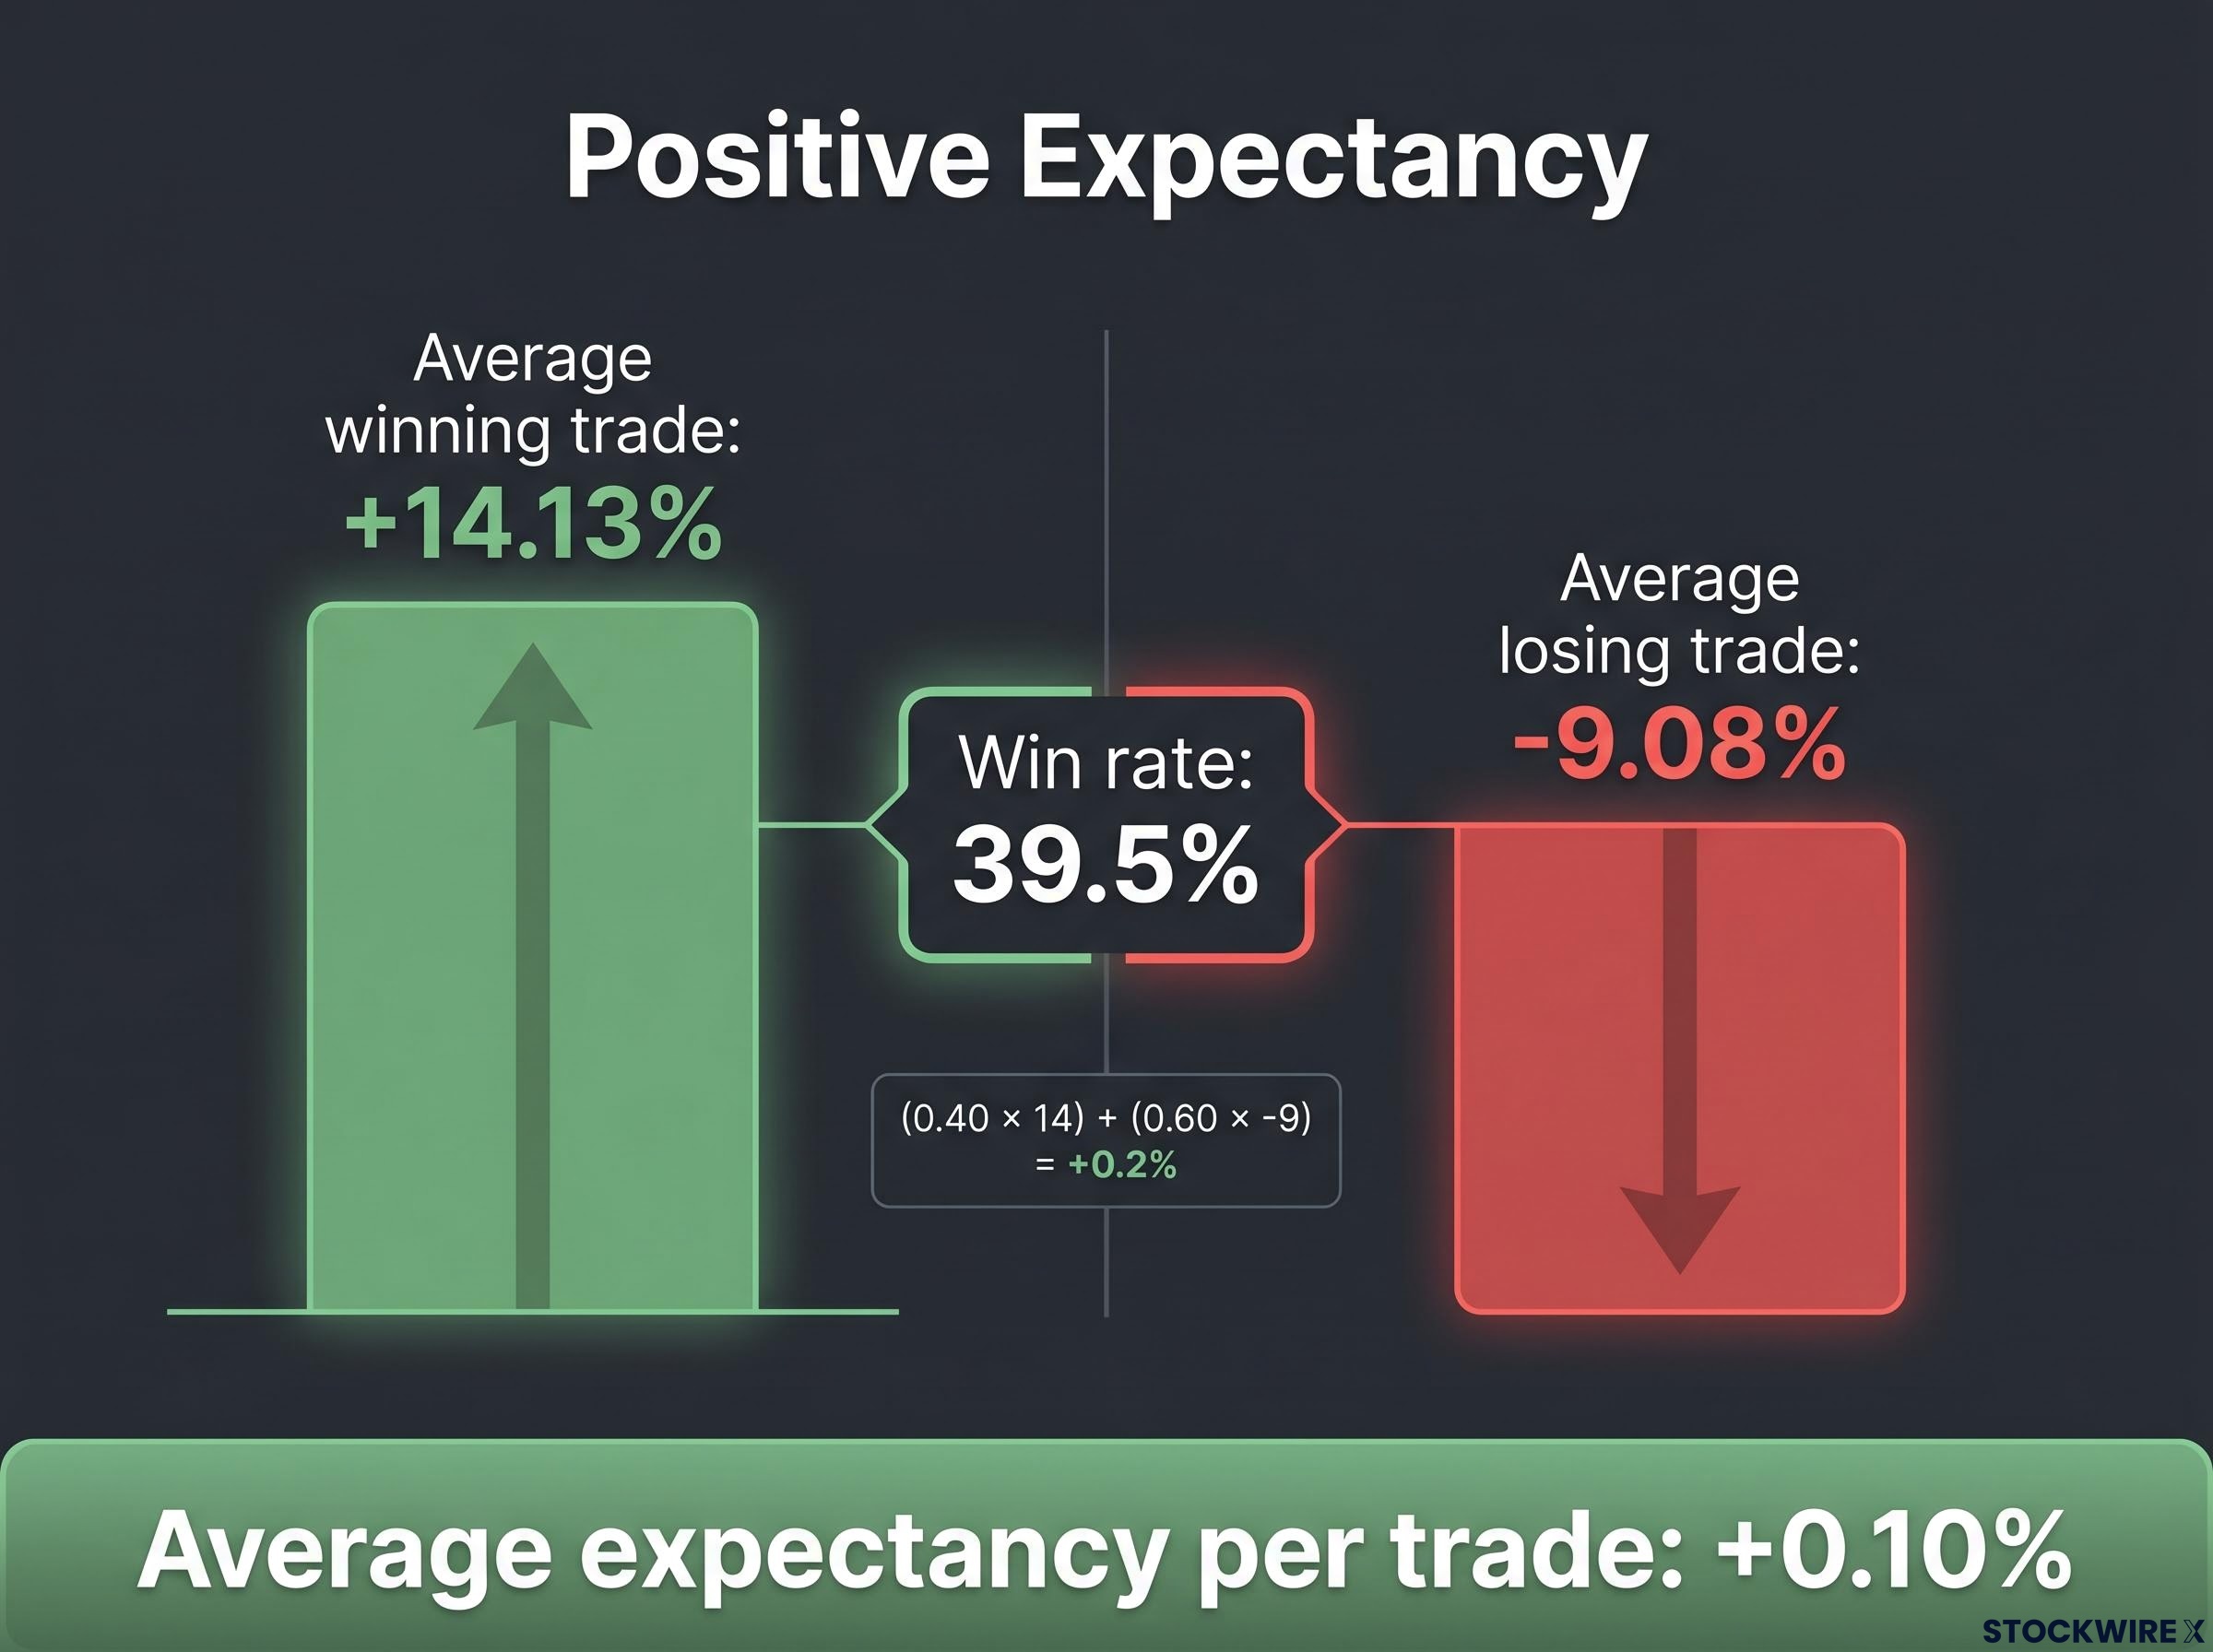
The win rate is the number that stops most readers: 39.5%. The system lost on the majority of its trades. Yet it still generated a positive outcome over 20 years, across multiple crashes, because of a concept called positive expectancy.
Expectancy captures the net result per trade by combining how frequently you win or lose with the magnitude of those wins and losses. Here, gains were roughly double losses at the trade level.
Average expectancy per trade: +0.10%. That number is the entire argument in miniature. It shows that being right less than half the time can still produce a viable system, provided you consistently take smaller losses than your gains.
The mathematics are concrete. If the system wins 40% of the time at +14% and loses 60% of the time at -9%, the weighted average trade is still slightly positive: (0.40 × 14) + (0.60 × -9) = +0.2%. A losing win rate, a winning system.
The three structural rules that prevented collapse
The results were not lucky randomness. They were the predictable output of three interlocking mechanical rules, each of which directly counters a specific way most investors destroy capital.
Asymmetric exits: smaller losses, larger gains
The 10% stop-loss versus 20% profit target bakes in a favourable risk-reward profile at the trade level. The system needs only a moderate proportion of winners to stay above water, because each winner contributes roughly twice what each loser takes away.
This is the structural opposite of what most retail investors do. Research in behavioural finance consistently shows that individual investors cut winners early (to lock in gains) and hold losers too long (hoping for recovery). The backtest’s mechanical exits remove both impulses entirely.
The behavioural finance research underpinning investor psychology under market stress consistently finds that the most destructive decisions occur at market extremes: panic selling converts temporary drawdowns into permanent capital losses, and the investors who hold through volatility capture the recoveries that follow.
Position sizing: no single bet can be fatal
The 5% per-trade cap creates a hard ceiling on the damage any single position can inflict. Even a total wipeout in a single stock, which has occurred in the ASX over the past two decades, cannot cost more than 5% of the portfolio.
Blow-ups in real portfolios most commonly come from concentration, not from being slightly wrong on many small positions. The 5% cap prevents the one error that compounds into catastrophe.
Emotionless, systematic execution
Because entries are random and exits are mechanical, the system avoids the psychological traps that plague human investors: averaging down into losers, refusing to sell a stock that has breached a stop, panicking out of winners during short-term volatility.
Discipline becomes the competitive edge when information advantages are scarce. Most retail investors have no durable informational edge over the market. What they can control is whether they follow their own rules consistently, and the behavioural finance evidence says most do not.
Each of these three rules solves a specific problem that most retail investors create for themselves. Identifying which of the three you violate most often is the single most useful diagnostic this study offers.
Survival is not outperformance, and the distinction matters
A passive ASX 300 index fund over the same 20-year period would almost certainly have outperformed these random-entry systems. A 0.27% annual return is survival, not wealth creation. That distinction is the honest read of the data, and it clarifies exactly what risk management can and cannot do for you.
“If random selection plus good risk management yields small positive returns, then non-random selection plus good risk management should do better, but only if the risk management framework is there.”
The backtest does not make a case for random stock picking. It makes a case that process alone, without any analytical input, is sufficient to prevent collapse. The logical extension is that genuine analytical skill, layered on top of these mechanical protections, should produce meaningfully better outcomes.
Two broader bodies of evidence reinforce this reading:
- SPIVA scorecards consistently show that the majority of active Australian fund managers lag their benchmark indices over 10-15 years, even before fees. Professional stock picking, on average, does not reliably beat buying the index.
- Hendrik Bessembinder’s research, summarised in Morningstar Australia, found that across approximately 30,000 US stocks over a century, the median stock produces a negative lifetime buy-and-hold return. A tiny fraction of outlier companies generated the bulk of total market wealth creation.
SPIVA data on Australian active fund performance shows that 87% of Australian equity general funds underperformed their benchmarks over 15 years, a figure that contextualises the backtest’s survival result: professional stock selection, on average, does not reliably beat the index either, making the risk framework the common denominator between random and skilled approaches.
Bessembinder’s Journal of Financial Economics study found that the best-performing 4% of listed US companies explain the entire net gain for the US stock market since 1926, with the median stock producing a lifetime return below one-month Treasury bills.
The honest read of the Bessembinder data is that identifying the handful of outlier stocks in advance is genuinely difficult. Your default posture as a retail investor should be to protect against the common case, which is losing stocks, rather than to optimise for the rare case of finding a mega-compounder.
Survival, in other words, is the prerequisite for outperformance. It is not a substitute for it.
What this means for how Australian retail investors should structure their portfolios
The backtest’s three structural rules translate directly into changes you can make to your own portfolio process. These are not general principles. They are specific behavioural rules, each anchored in the mechanics that kept a random system alive for two decades.
Australian retail investors frequently concentrate in a small number of high-conviction positions in sectors they know well, typically resources and financials. If you are holding four or five concentrated positions in banks and miners, you are already running a portfolio structure that the backtest’s design would flag as high-risk, regardless of how strong your research is.
- Decide the exit before you enter. Pre-define a stop-loss and, optionally, a profit target before you buy. This forces clarity on “what happens if I’m wrong?” and removes the temptation to rationalise holding a loser.
- Cap position sizes so no single wrong call is fatal. The backtest used a 5% cap. Whatever number you choose, the principle is the same: no individual position should be large enough to cause permanent damage if it goes to zero.
For investors who want to implement a more precise version of the position-sizing principle covered here, our dedicated guide to beta-weighted position sizing walks through the six-step rebalancing workflow that converts dollar allocations into market-risk equivalent exposures, including the volatility-targeting formula used to scale total portfolio risk deliberately.
- Ensure risk-reward is structurally in your favour at entry. If your typical losses are larger than your typical gains, even a high win rate produces poor results. The backtest’s positive expectancy depended on gains roughly doubling losses at the trade level.
- Treat consistent rule-following as your primary competitive edge. Analyses of the S&P 500 show that missing just the best 10-30 days over a long horizon drastically reduces returns. Process, staying invested and following rules through different market regimes, beats prediction.
Risk management is the floor, not the ceiling
Rather than asking “what should I buy?”, the more productive question, and the one most investors never pause to consider, is: “if this goes against me, what is my downside, and how exposed am I?”
That is the backtest’s clearest lesson. A system with zero analytical ability, selecting stocks at random across two decades that included the GFC, the European Debt Crisis, COVID-19, the Russia-Ukraine conflict, and US tariff disputes, still came out ahead. Not because it predicted anything. Because it maintained hard limits on individual losses, kept positions small enough that no single failure could be decisive, and executed its rules mechanically without hesitation or second-guessing.
Risk management is the floor that keeps you in the game long enough to benefit from genuine analytical edges when you do find them. Without it, even the best stock picks are built on exposed foundations.
Systematic contribution strategies, particularly those built around automated scheduling and a written selling policy agreed to during calm conditions, are the structural mechanisms that make process-based investing survivable across the kind of multi-decade span this backtest covered.
The next major market disruption is unknown in its timing and cause, just as the last five were. A risk framework that survives unknowable events is more durable than any forecast-based strategy you could construct today. Predicting the next crisis is beside the point. What matters is whether your portfolio is built to withstand it.
This article is for informational purposes only and should not be considered financial advice. Investors should conduct their own research and consult with financial professionals before making investment decisions. Past performance does not guarantee future results. Financial projections are subject to market conditions and various risk factors.