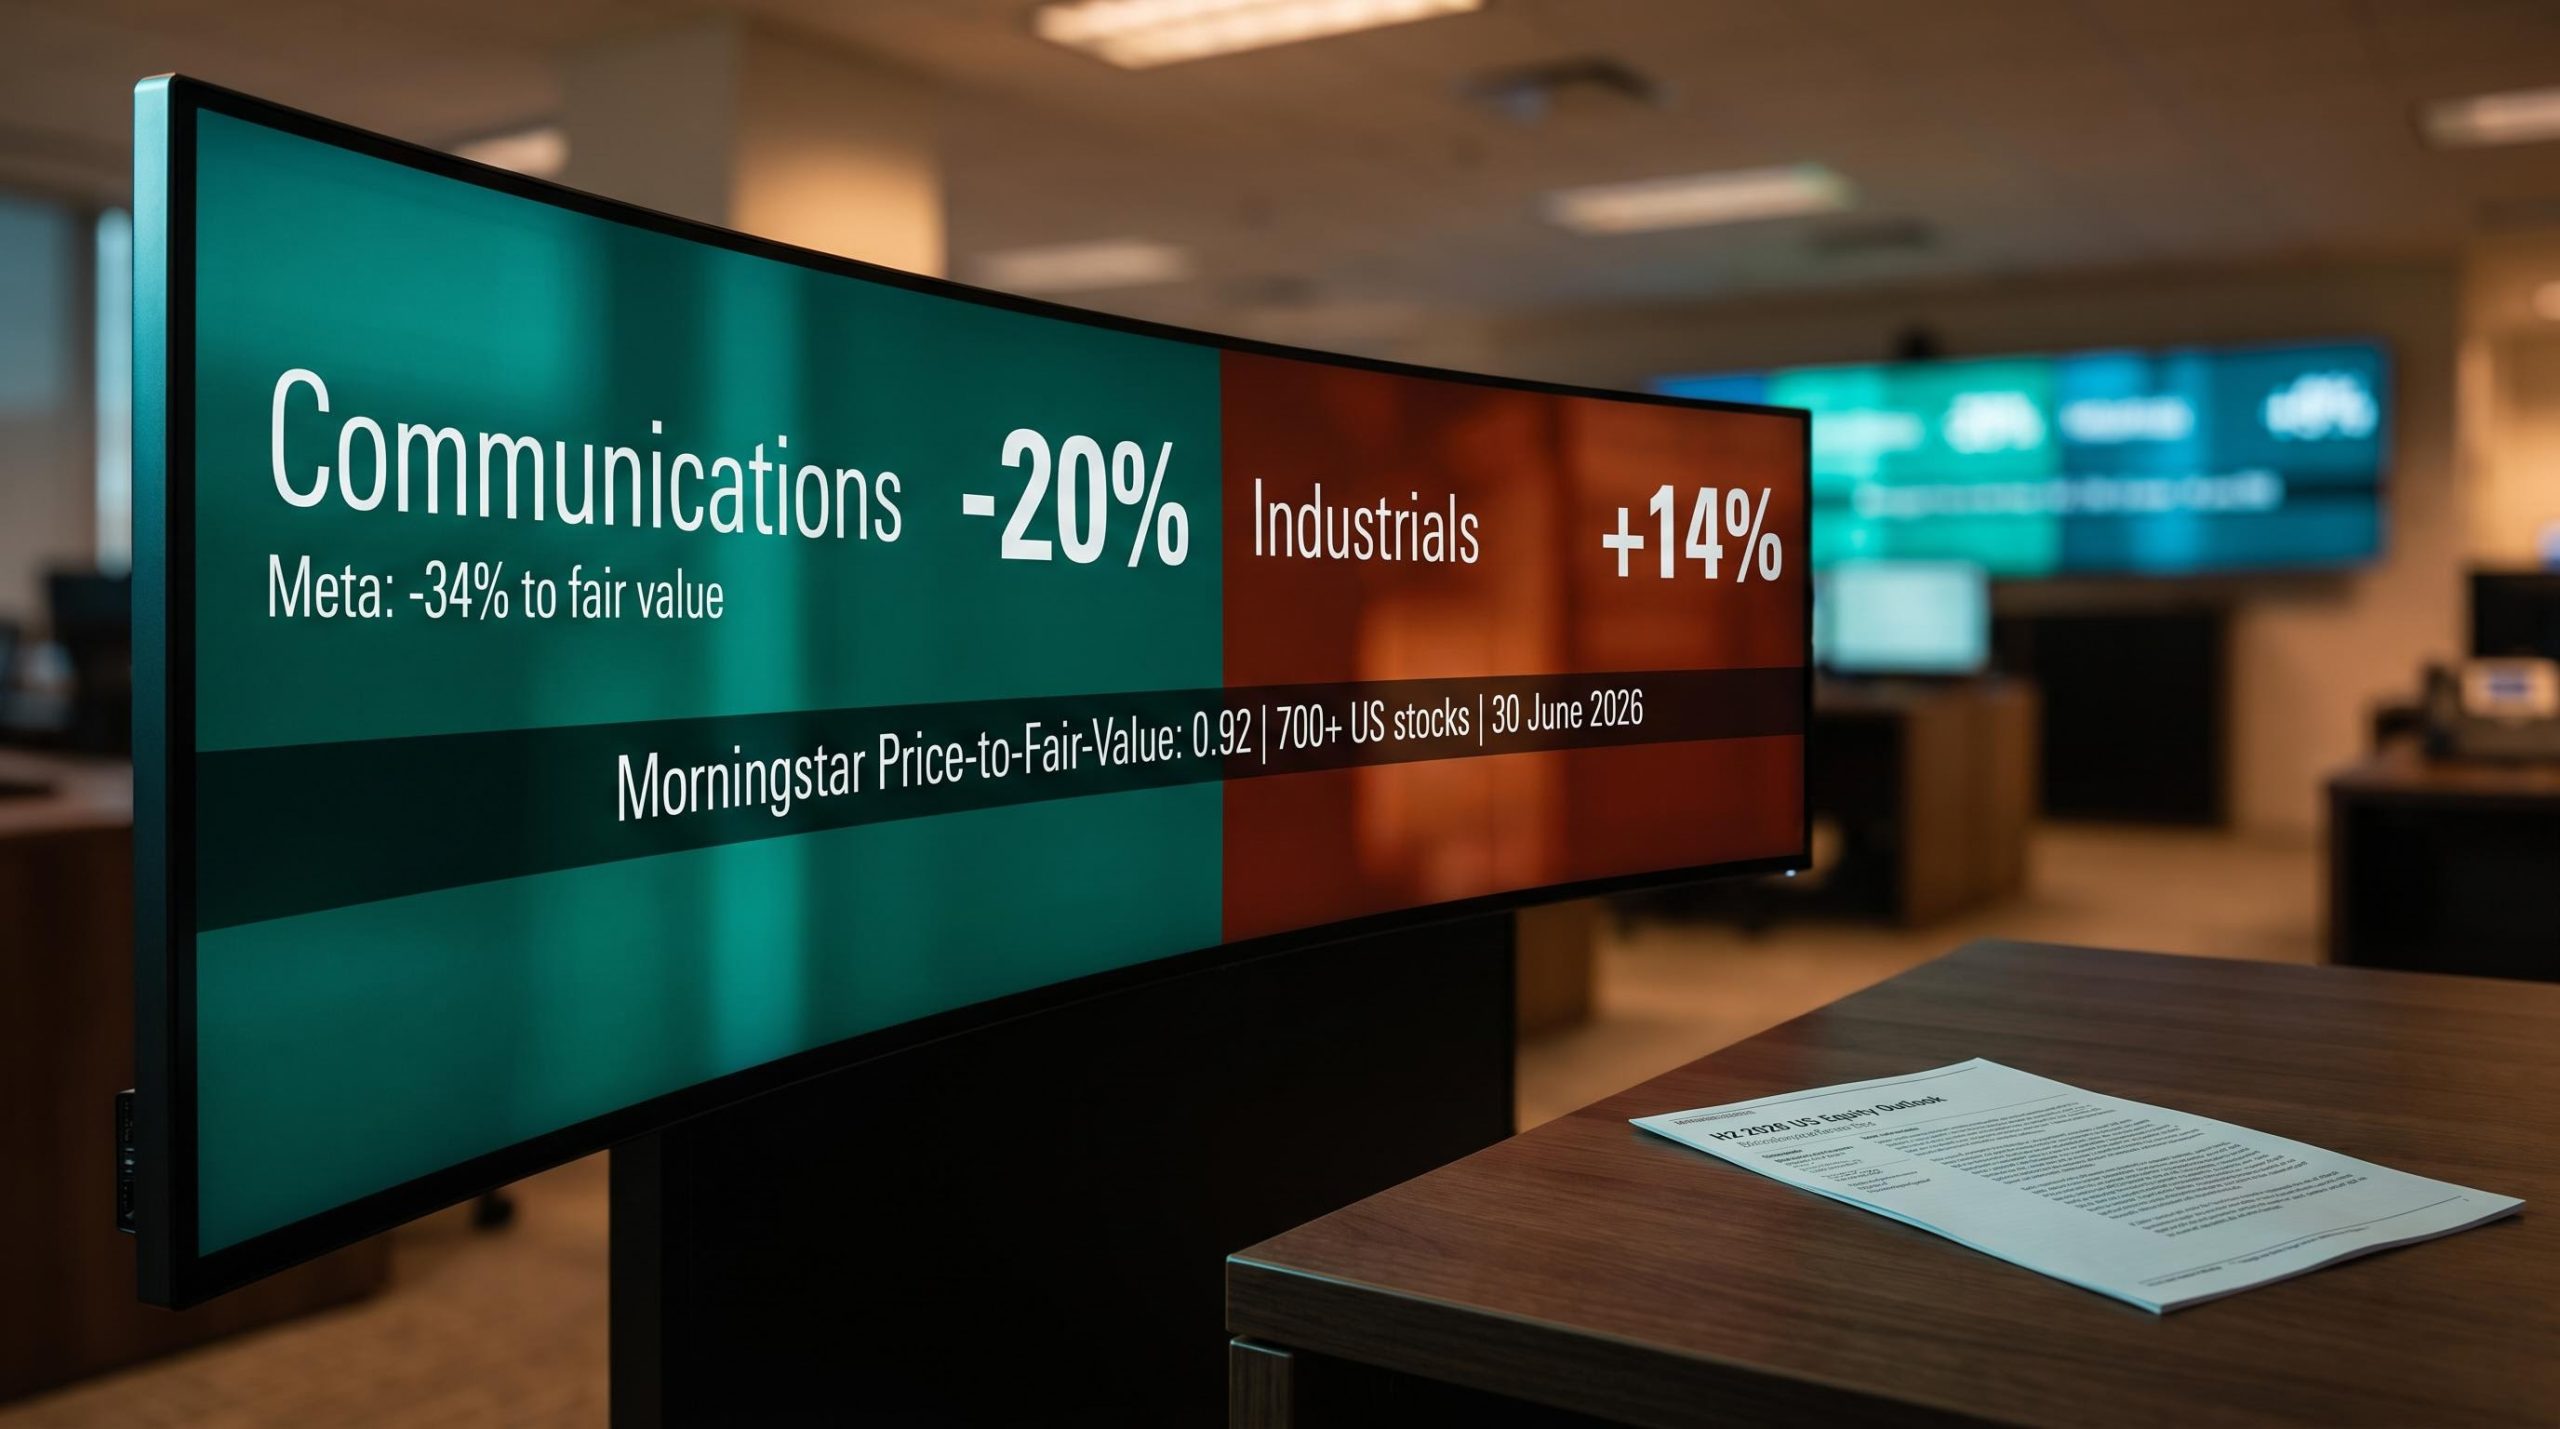
The US equity market is trading at a discount to fair value for the first time in a while, but that headline number obscures a far more important story. Some sectors are 20% cheap while others are 14% expensive, and buying the index today means buying both.
Morningstar’s David Sekera published the firm’s H2 2026 US equity outlook on 10 July 2026, drawing on intrinsic value estimates across more than 700 US-listed stocks. Aggregating those estimates, Morningstar’s price-to-fair-value ratio landed at 0.92 as at 30 June 2026, implying the market sits roughly 8% below what its models consider fair. But the dispersion beneath that number is where the actionable intelligence lives.
Here is the sector-by-sector valuation map, so you can see exactly where Morningstar’s models are flagging opportunity and where the risk of overpaying is highest heading into the second half of 2026.
A market-wide discount that rewards selectivity, not boldness
As at 30 June 2026, Morningstar’s price-to-fair-value ratio across its coverage of more than 700 US-listed stocks stood at 0.92, pointing to a roughly 8% market-wide discount to modelled fair value.
That 8% discount is real. It is slightly larger than the gap that existed when 2026 began, and it emerged from a period in which H1 rotations across style categories and market-cap tiers pulled most sector readings back toward their intrinsic anchors.
The sector valuation divergence visible in Morningstar’s H2 data is not a new phenomenon: as recently as 30 April 2026, the price-to-fair-value ratio sat at 0.95, with technology carrying an 11% discount and consumer defensives sitting at a 19% premium, a spread that H1 rotations have since partially, but not fully, closed.
Morningstar’s position on this is clear: the current discount falls short of the threshold that would justify pushing equity exposure above an investor’s long-term allocation targets. David Sekera, Morningstar’s Chief US Market Strategist, characterises the relationship between valuation and outstanding risks as considerably more evenly matched today than it appeared at any earlier point this year.
The practical read is straightforward. The index is not expensive, but a 8% discount does not hand you a margin of safety large enough to swing hard on equities broadly. The opportunity set is about tilting within equities, rotating toward the cheapest sectors and away from the most stretched, rather than making an aggressive market-wide call.
When big ASX news breaks, our subscribers know first
Why sector-level numbers can mislead you (the distortion problem)
A single large-cap constituent can make an entire sector look cheap or expensive when the underlying picture is far more mixed. This is not a theoretical concern. It is actively distorting three of the most commonly cited sector valuations right now.
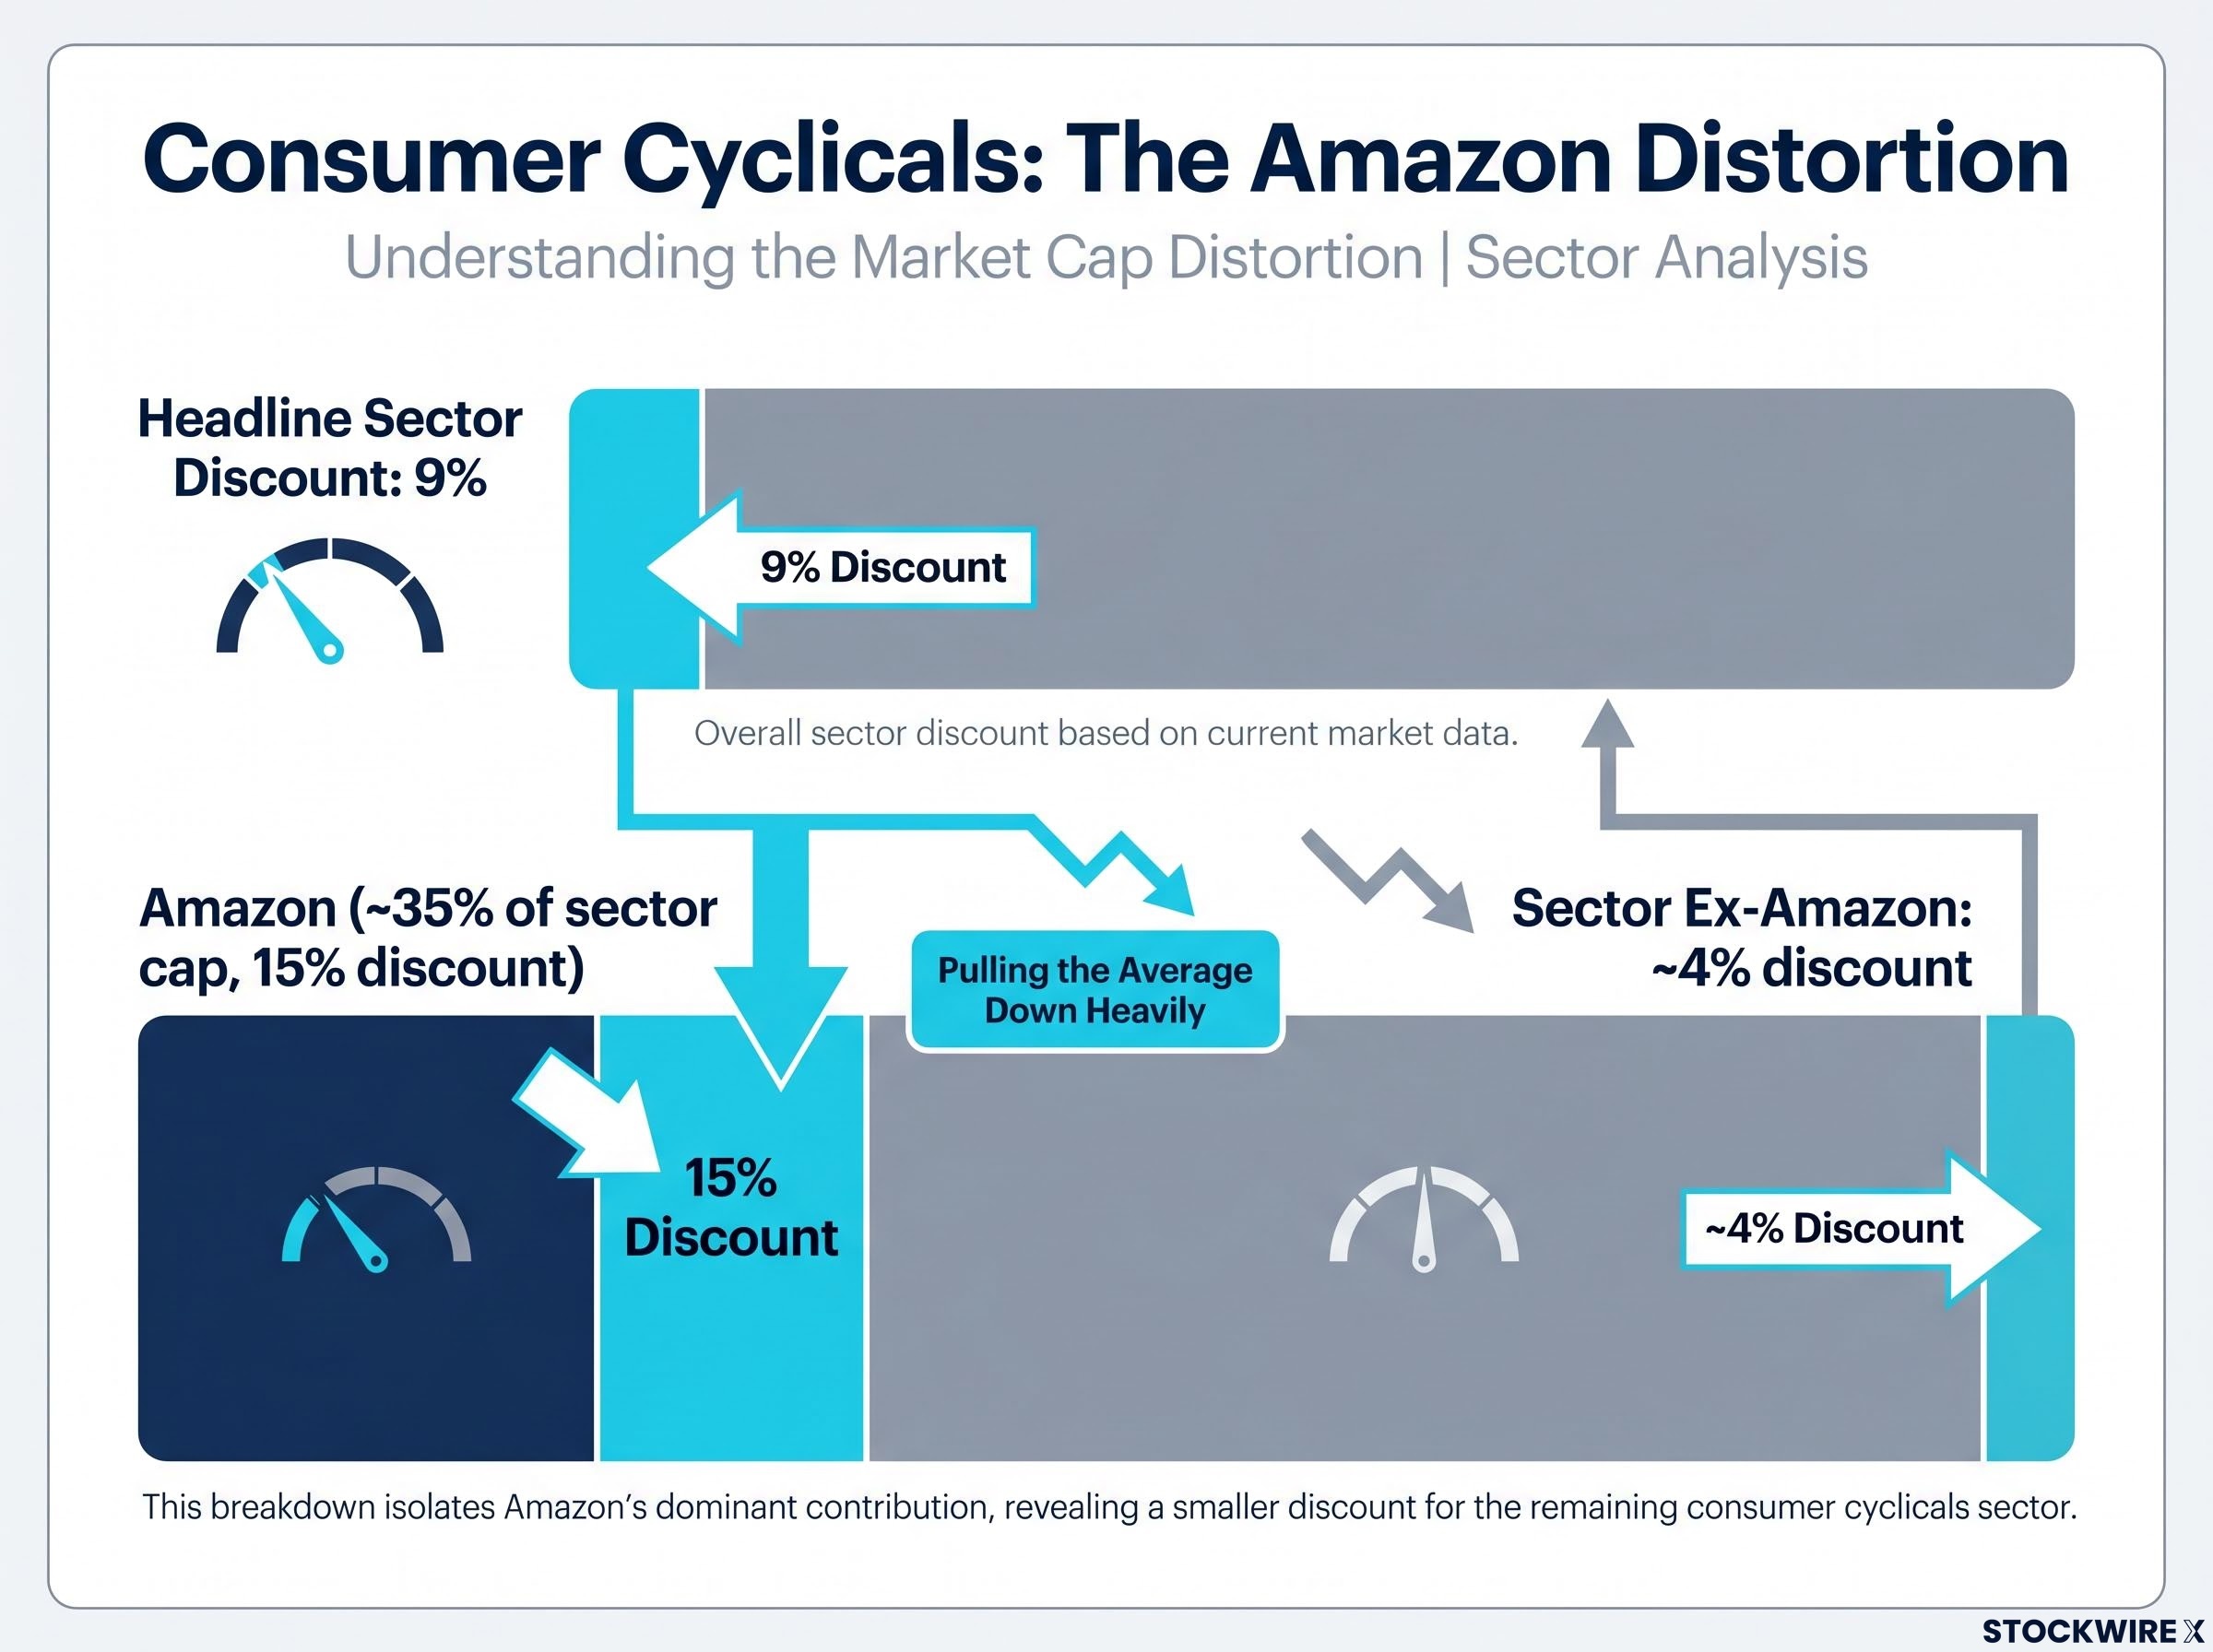
Meta Platforms holds around 19% of the communications sector’s total market capitalisation and is priced at what Morningstar estimates as a 34% discount to its intrinsic value. That one stock pulls the entire sector’s discount reading down dramatically. Amazon represents roughly 35% of consumer cyclicals market capitalisation; remove it from the calculation, and the sector’s headline 9% discount narrows to around 4%. In consumer defensives, the overvaluation is anchored in Walmart (rated 1-star) and Costco (rated 2-star); when those two names are set aside, the rest of the sector sits at roughly a 4% discount.
| Sector | Large Distorting Constituent | Effect on Sector Reading |
|---|---|---|
| Communications | Meta (~19% of sector market cap, 34% discount) | Makes sector appear ~20% cheap; underlying carriers are less discounted |
| Consumer Cyclicals | Amazon (~35% of sector market cap, 15% discount) | Headline 9% discount; ex-Amazon only ~4% |
| Consumer Defensives | Walmart (1-star) and Costco (2-star) | Both overvalued; ex those two, sector is ~4% discounted |
This pattern means you cannot use a sector ETF’s aggregate valuation as a shortcut. You need to know who is doing the pulling before you commit capital to a sector tilt.
The sectors trading at the steepest discounts heading into H2 2026
Within Morningstar’s coverage universe, communications stands as the cheapest sector, carrying a discount of approximately 20% relative to fair value. Meta’s 34% discount is the dominant driver, but the wireless carriers, AT&T, T-Mobile, and Verizon, also contribute. The underlying thesis combines durable tailwinds in AI-driven advertising, social media monetisation, and wireless infrastructure with carrier dividend income.
In terms of overall sector rankings, technology sits in second place for undervaluation, but that aggregate figure conceals a meaningful internal divide that carries more weight than the headline figure.
Software versus commodity AI hardware: why the technology sector label is not enough
Within technology, software commands the most compelling valuations on offer. The AI tailwind translates into durable subscription and platform revenue rather than cyclical hardware pricing power, giving software names a structurally different risk profile.
Commodity AI hardware is a different story entirely:
- Memory semiconductors, networking hardware, connectors, and CPUs have all benefited from acute supply shortages that pushed prices sharply higher and lifted margins to record levels
- Fresh semiconductor manufacturing capacity is forecast to arrive around 2028, at which point hardware earnings growth is expected to face meaningful compression
- Micron, SanDisk, and Seagate each carry Morningstar valuations that place them significantly above fair value despite the sector’s aggregate discount
The clearest way to think about it: overweight high-quality software; be very selective or underweight cyclical AI hardware plays.
Capital rotation out of AI hardware into traditional-economy sectors was already registering in institutional fund flows by mid-June 2026, with energy gaining more than 22% year-to-date and industrials more than 16% against a broad market return of under 1%, patterns that help explain why Morningstar’s hardware names now sit above fair value despite the technology sector’s aggregate discount.
Consumer cyclicals carry a headline 9% discount, but as the distortion section established, strip out Amazon and you are looking at approximately 4%. Following a slide through Q2 2026 from a late-March peak, energy has moved to a 7% discount; Morningstar flags Devon Energy as a name of interest but positions the sector as a return-to-market-weight call rather than a conviction overweight. Wireless tower REITs within real estate offer valuations and dividend yields that Morningstar finds genuinely attractive, making the sector a measured opportunity for income-oriented investors. Among financial services names, Bank of America and LPL Financial stand out as the most clearly discounted, making the sector a stock-picker’s environment rather than a broad-based tilt.
| Sector | Estimated Discount to Fair Value | Primary Driver | Morningstar Stance |
|---|---|---|---|
| Communications | ~20% | Meta (34% discount), wireless carriers | Most undervalued sector; tilt toward |
| Technology (software) | Attractive within sector | Durable subscription and platform revenue | Overweight software; underweight commodity hardware |
| Consumer Cyclicals | ~9% (ex-Amazon ~4%) | Amazon concentration | Name-level conviction required |
| Energy | ~7% | Q2 decline from March peak; Devon Energy | Return to market-weight |
| Real Estate | Slight discount | Wireless tower REITs, defensive tenants | Income-oriented opportunity |
| Financial Services | Modest discount | Bank of America, LPL Financial | Stock-picking terrain |
The clearest sector-level opportunity for a US equity investor right now is in communications, where the discount is largest and the underlying AI advertising and wireless infrastructure thesis is durable rather than cyclical.
Where Morningstar’s models say the market is overpriced right now
Industrials carry the heaviest valuation premium in the market, sitting at roughly 14% above Morningstar’s fair value estimates. The excess is most pronounced among businesses tied to AI data centre construction, including manufacturers of electrical equipment and related infrastructure, as well as transportation companies across trucking and airline segments.
The defence contractor exception: Within the industrials universe, Lockheed Martin and Northrop Grumman trace a distinct path. Both climbed from discounted levels during autumn 2025, reached overvalued territory by March 2026, and have since retreated far enough that Morningstar now assigns both a 4-star rating, indicating that fresh capital again has a quantitative case for entry.
Healthcare made one of the sharper transitions of Q2 2026. The sector gained approximately 9.47% across the quarter, which was enough to push it from a position of undervaluation to a slight premium above Morningstar’s fair value estimate. For investors who held healthcare for its margin of safety, this is a logical point to re-evaluate and possibly trim. For new capital, the entry point is meaningfully less attractive than it was three months ago.
Within consumer defensives, Walmart (1-star) and Costco (2-star) remain the primary source of the sector’s elevated valuation, even after both names declined over the prior quarter. For basic materials and utilities, each sector is still priced above fair value, though the gap has narrowed compared with where it stood three months ago; neither represents a high-priority destination for fresh capital.
| Sector | Valuation Status | Key Names or Drivers |
|---|---|---|
| Industrials | ~14% premium (most overvalued) | AI data centre buildout, electrical equipment, transportation |
| Healthcare | Slight premium (was undervalued entering Q2) | Q2 appreciation of ~9.47% closed the gap |
| Consumer Defensives | Premium concentrated in two names | Walmart (1-star), Costco (2-star) |
| Basic Materials | Above fair value, narrowing | No standout names; wait for normalisation |
| Utilities | Above fair value, narrowing | Not high-priority for fresh capital |
If you are holding a broad industrial ETF or sector fund, the AI data centre buildout premium embedded in that position is not priced in for the long term. Among industrials, the defence contractor names that have corrected back to 4-star territory are one of the few pockets where the valuation maths currently supports putting fresh money to work.
Small caps and the case for a size tilt alongside sector positioning
The same H1 2026 rotations that pushed some large-cap sectors to premiums left small-cap stocks broadly discounted. This is a structurally separate opportunity from the sector-level picture, and it deserves a separate decision.
Morningstar identifies small caps as a complementary layer for investors willing to accept a different risk profile. The key conditions for considering it:
- A time horizon of five-plus years, long enough to absorb the higher volatility small caps carry
- Tolerance for drawdowns that may be steeper and more prolonged than large-cap equivalents
- Use as a complement to large-cap sector tilts, not a replacement for them
- Selective exposure rather than broad small-cap indexing
For a reader with that time horizon and volatility tolerance, the small-cap discount represents a second, size-based opportunity layer that sits alongside sector tilts rather than competing with them. It expands the toolkit beyond the large-cap sector map that most equity investors default to.
Small-cap quality screens matter more than broad index exposure here: the small-cap discount Morningstar identifies is concentrated in higher-quality names, while broad passive small-cap indexes carry a structural tilt toward unprofitable companies that dilutes the valuation premium and adds risk without commensurate return potential.
Translating the sector map into a portfolio positioning framework
The starting point is allocation discipline: keep overall equity exposure close to your long-term targets. An 8% market-wide discount does not provide sufficient cushion to justify pushing equity weightings materially beyond those targets.
Within that allocation, the sector-by-sector data points toward a clear tilt-toward and be-cautious framework.
| Tilt Toward | Be Cautious / Underweight |
|---|---|
| Communications (especially Meta) | Broad industrials (AI buildout and transportation) |
| High-quality software within technology | Commodity AI hardware (Micron, SanDisk, Seagate) |
| Select small caps (long-horizon investors) | Healthcare at current entry point |
| Consumer defensives excluding Walmart and Costco | Walmart and Costco |
| Income-oriented real estate (wireless tower REITs) | Basic materials and utilities (wait for normalisation) |
| Select financials (Bank of America, LPL Financial) | Energy (return to market-weight) |
| Defence contractors (Lockheed Martin, Northrop Grumman) |
This framework is most useful not as a trading list but as a diagnostic. Run your current equity holdings against the tilt-toward and be-cautious columns to identify where your existing positions carry valuation risk you may not have priced in.
“Sector-aggregate valuations are starting points, not conclusions.” Name-level analysis remains the final checkpoint, particularly in consumer cyclicals, consumer defensives, communications, and financials where constituent distortion is most pronounced.
What the sector valuation map tells you that the index number does not
The 8% market-wide discount and the roughly 34-percentage-point spread between the most undervalued sector (communications at 20% discount) and the most overvalued (industrials at 14% premium) tell two very different stories. The index number says equities are modestly cheap. The sector map says the opportunity is highly specific.
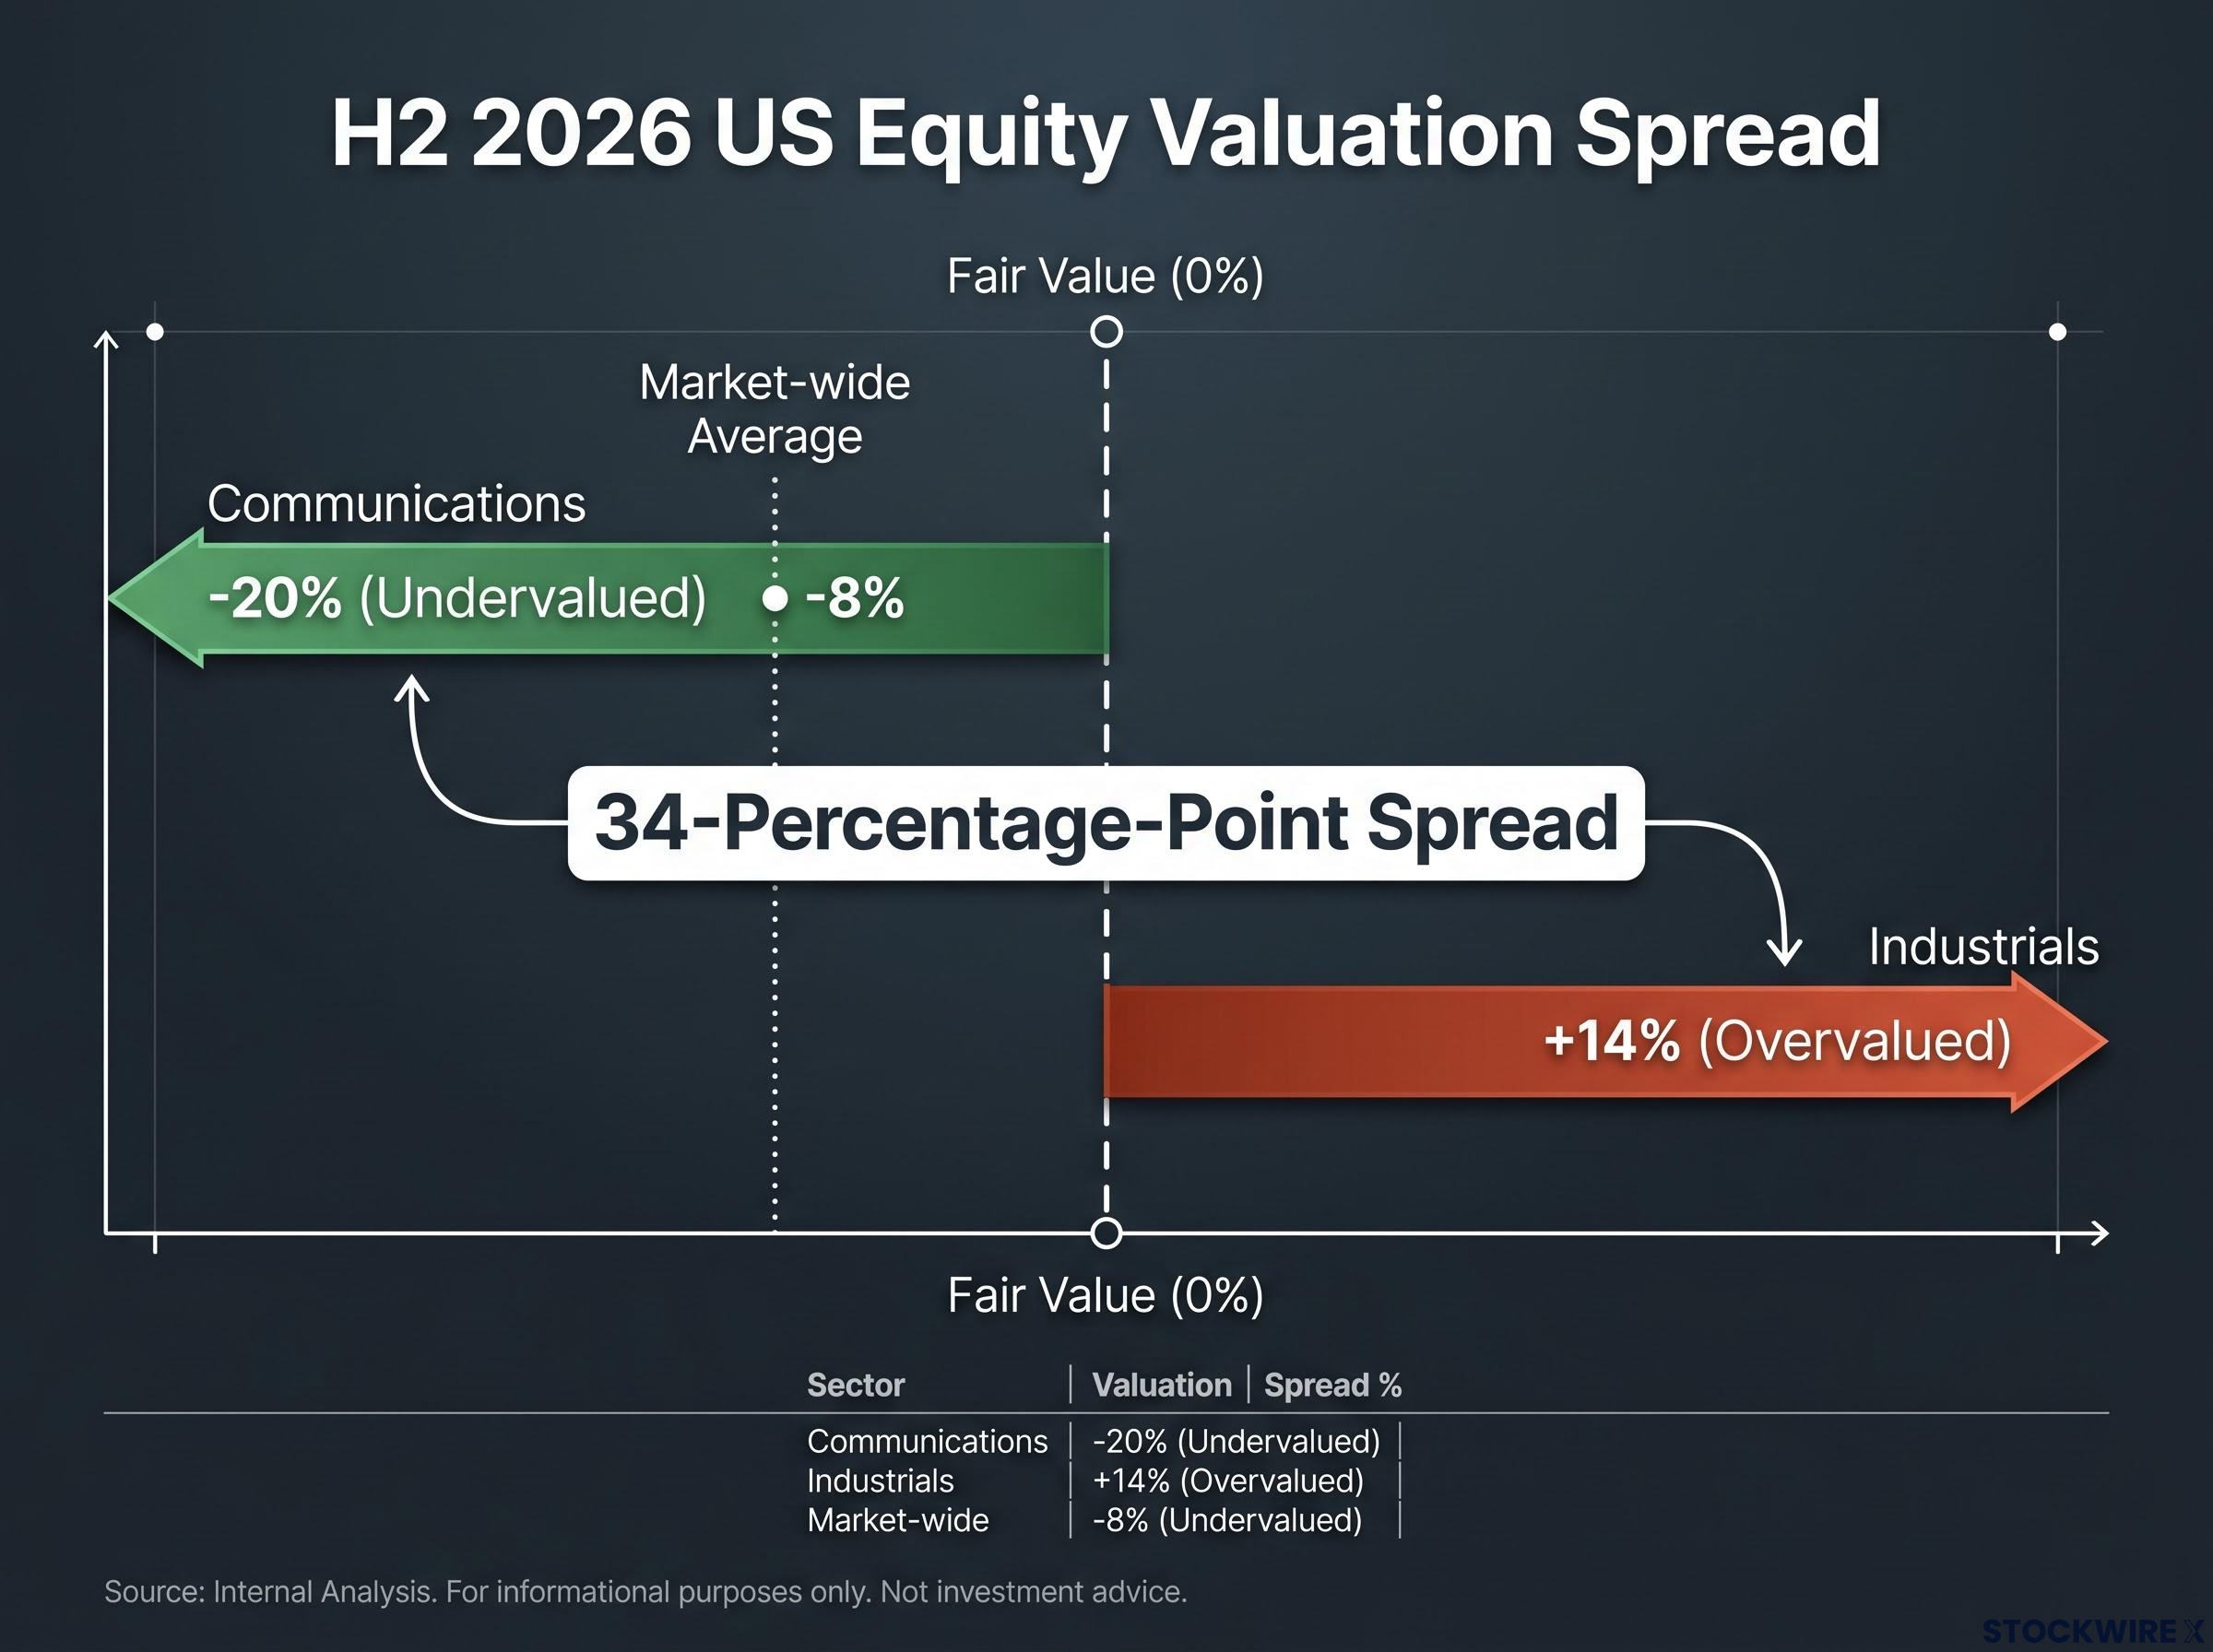
The convergence of sector readings toward fair value that took place through Q2 2026 means the remaining mispricings are more concentrated and more time-sensitive than they were six months ago. H2 2026 is a market environment where stock and sector selection matters more than the macro direction call.
The index number is a blunt instrument. The sector and stock-level map, built from Morningstar’s 30 June 2026 data and published 10 July 2026, is where the actual allocation decision lives. The window of pronounced mispricings is narrowing, not widening. Name-level discipline is what separates a portfolio positioned for this environment from one that simply bought the discount.
International valuation spreads add a further dimension to the US sector picture: MSCI EAFE was trading at roughly a 50-55% forward P/E discount to the S&P 500 IT sector as of Q1-Q2 2026, a multi-decade extreme that suggests the same selectivity logic driving US sector tilts applies with even greater force when the comparison set expands beyond domestic equities.
This article is for informational purposes only and should not be considered financial advice. Investors should conduct their own research and consult with financial professionals before making investment decisions. Past performance does not guarantee future results. Financial projections are subject to market conditions and various risk factors.
—