The single most profitable action most long-term index investors will ever take is doing absolutely nothing. Not once will it feel like the right call.
That tension sits at the centre of every long-term investing strategy. You already understand how index funds work. What defeats you is not a gap in knowledge but the lived experience of watching your account balance drop by $30,000 in a fortnight while a colleague describes a speculative trade that tripled overnight. The pressure to act, to do something, anything, is not a sign of ignorance. It is the normal emotional cost of a strategy that only works if you refuse to respond to it.
After reading this, you will understand not just why inaction works but why it feels impossible precisely when it matters most, and which structural choices make the discomfort survivable across decades rather than unbearable across weeks.
How small daily contributions grow into a 40-year wealth gap
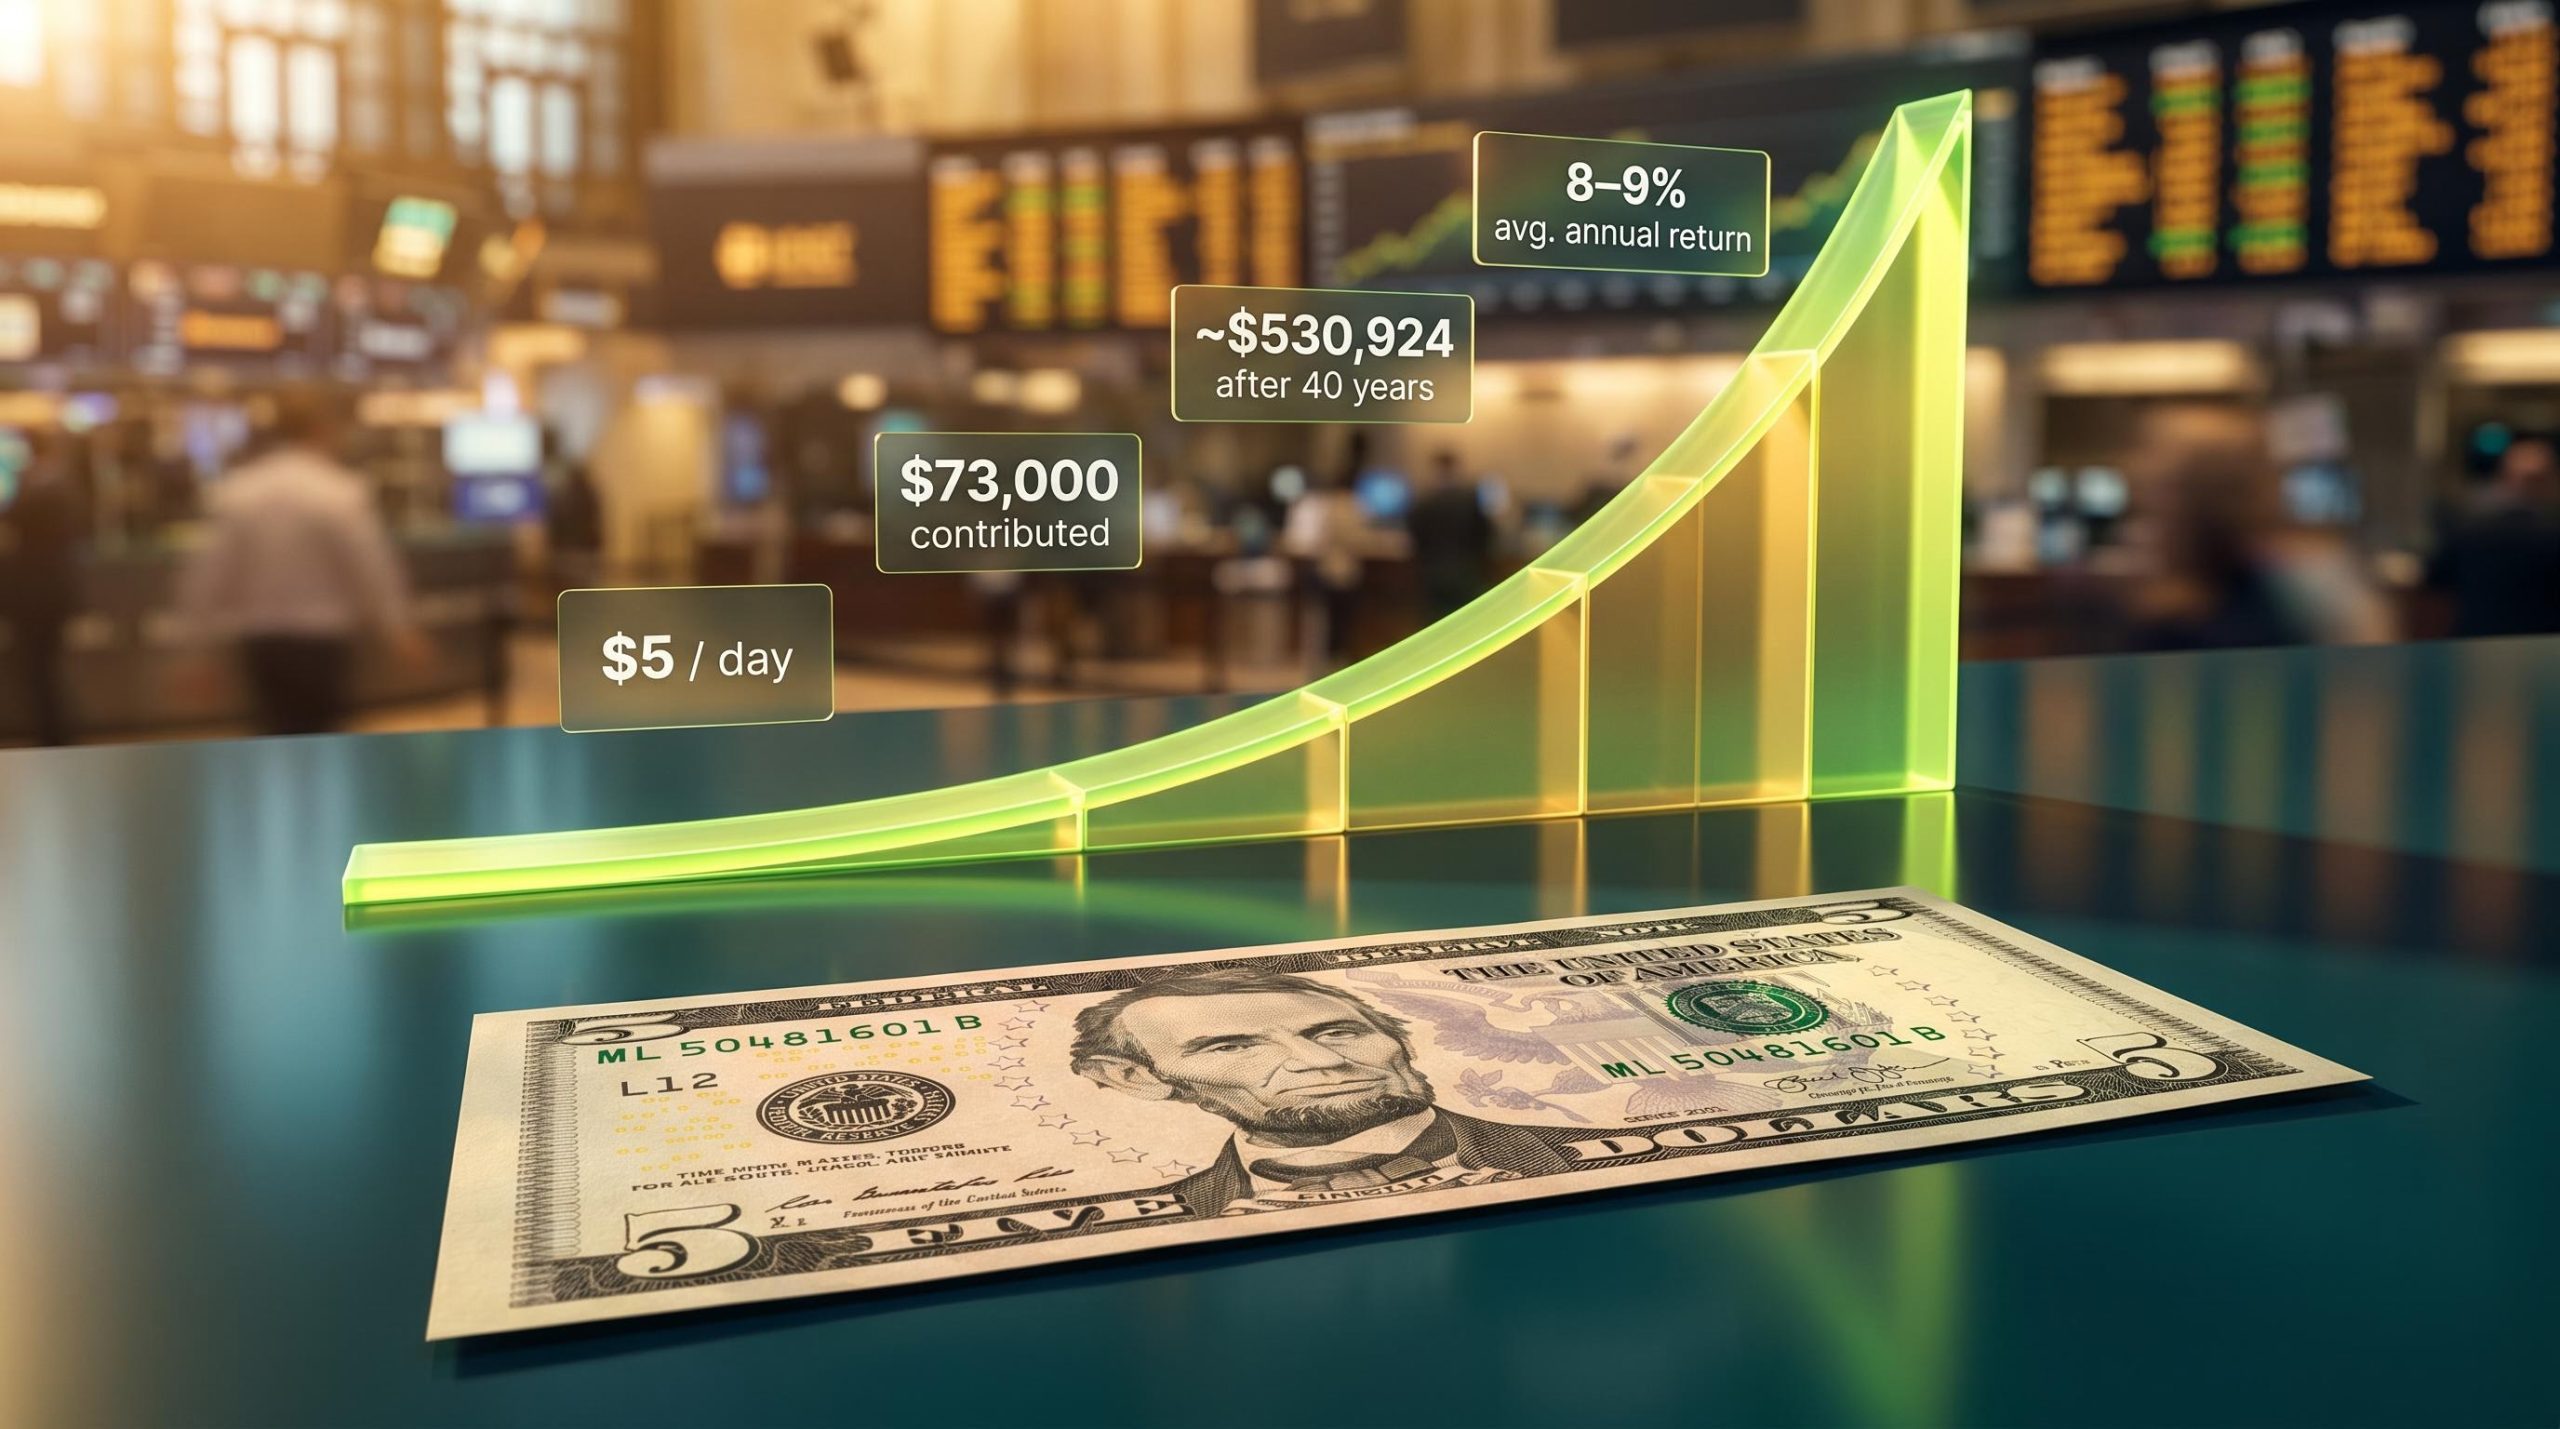
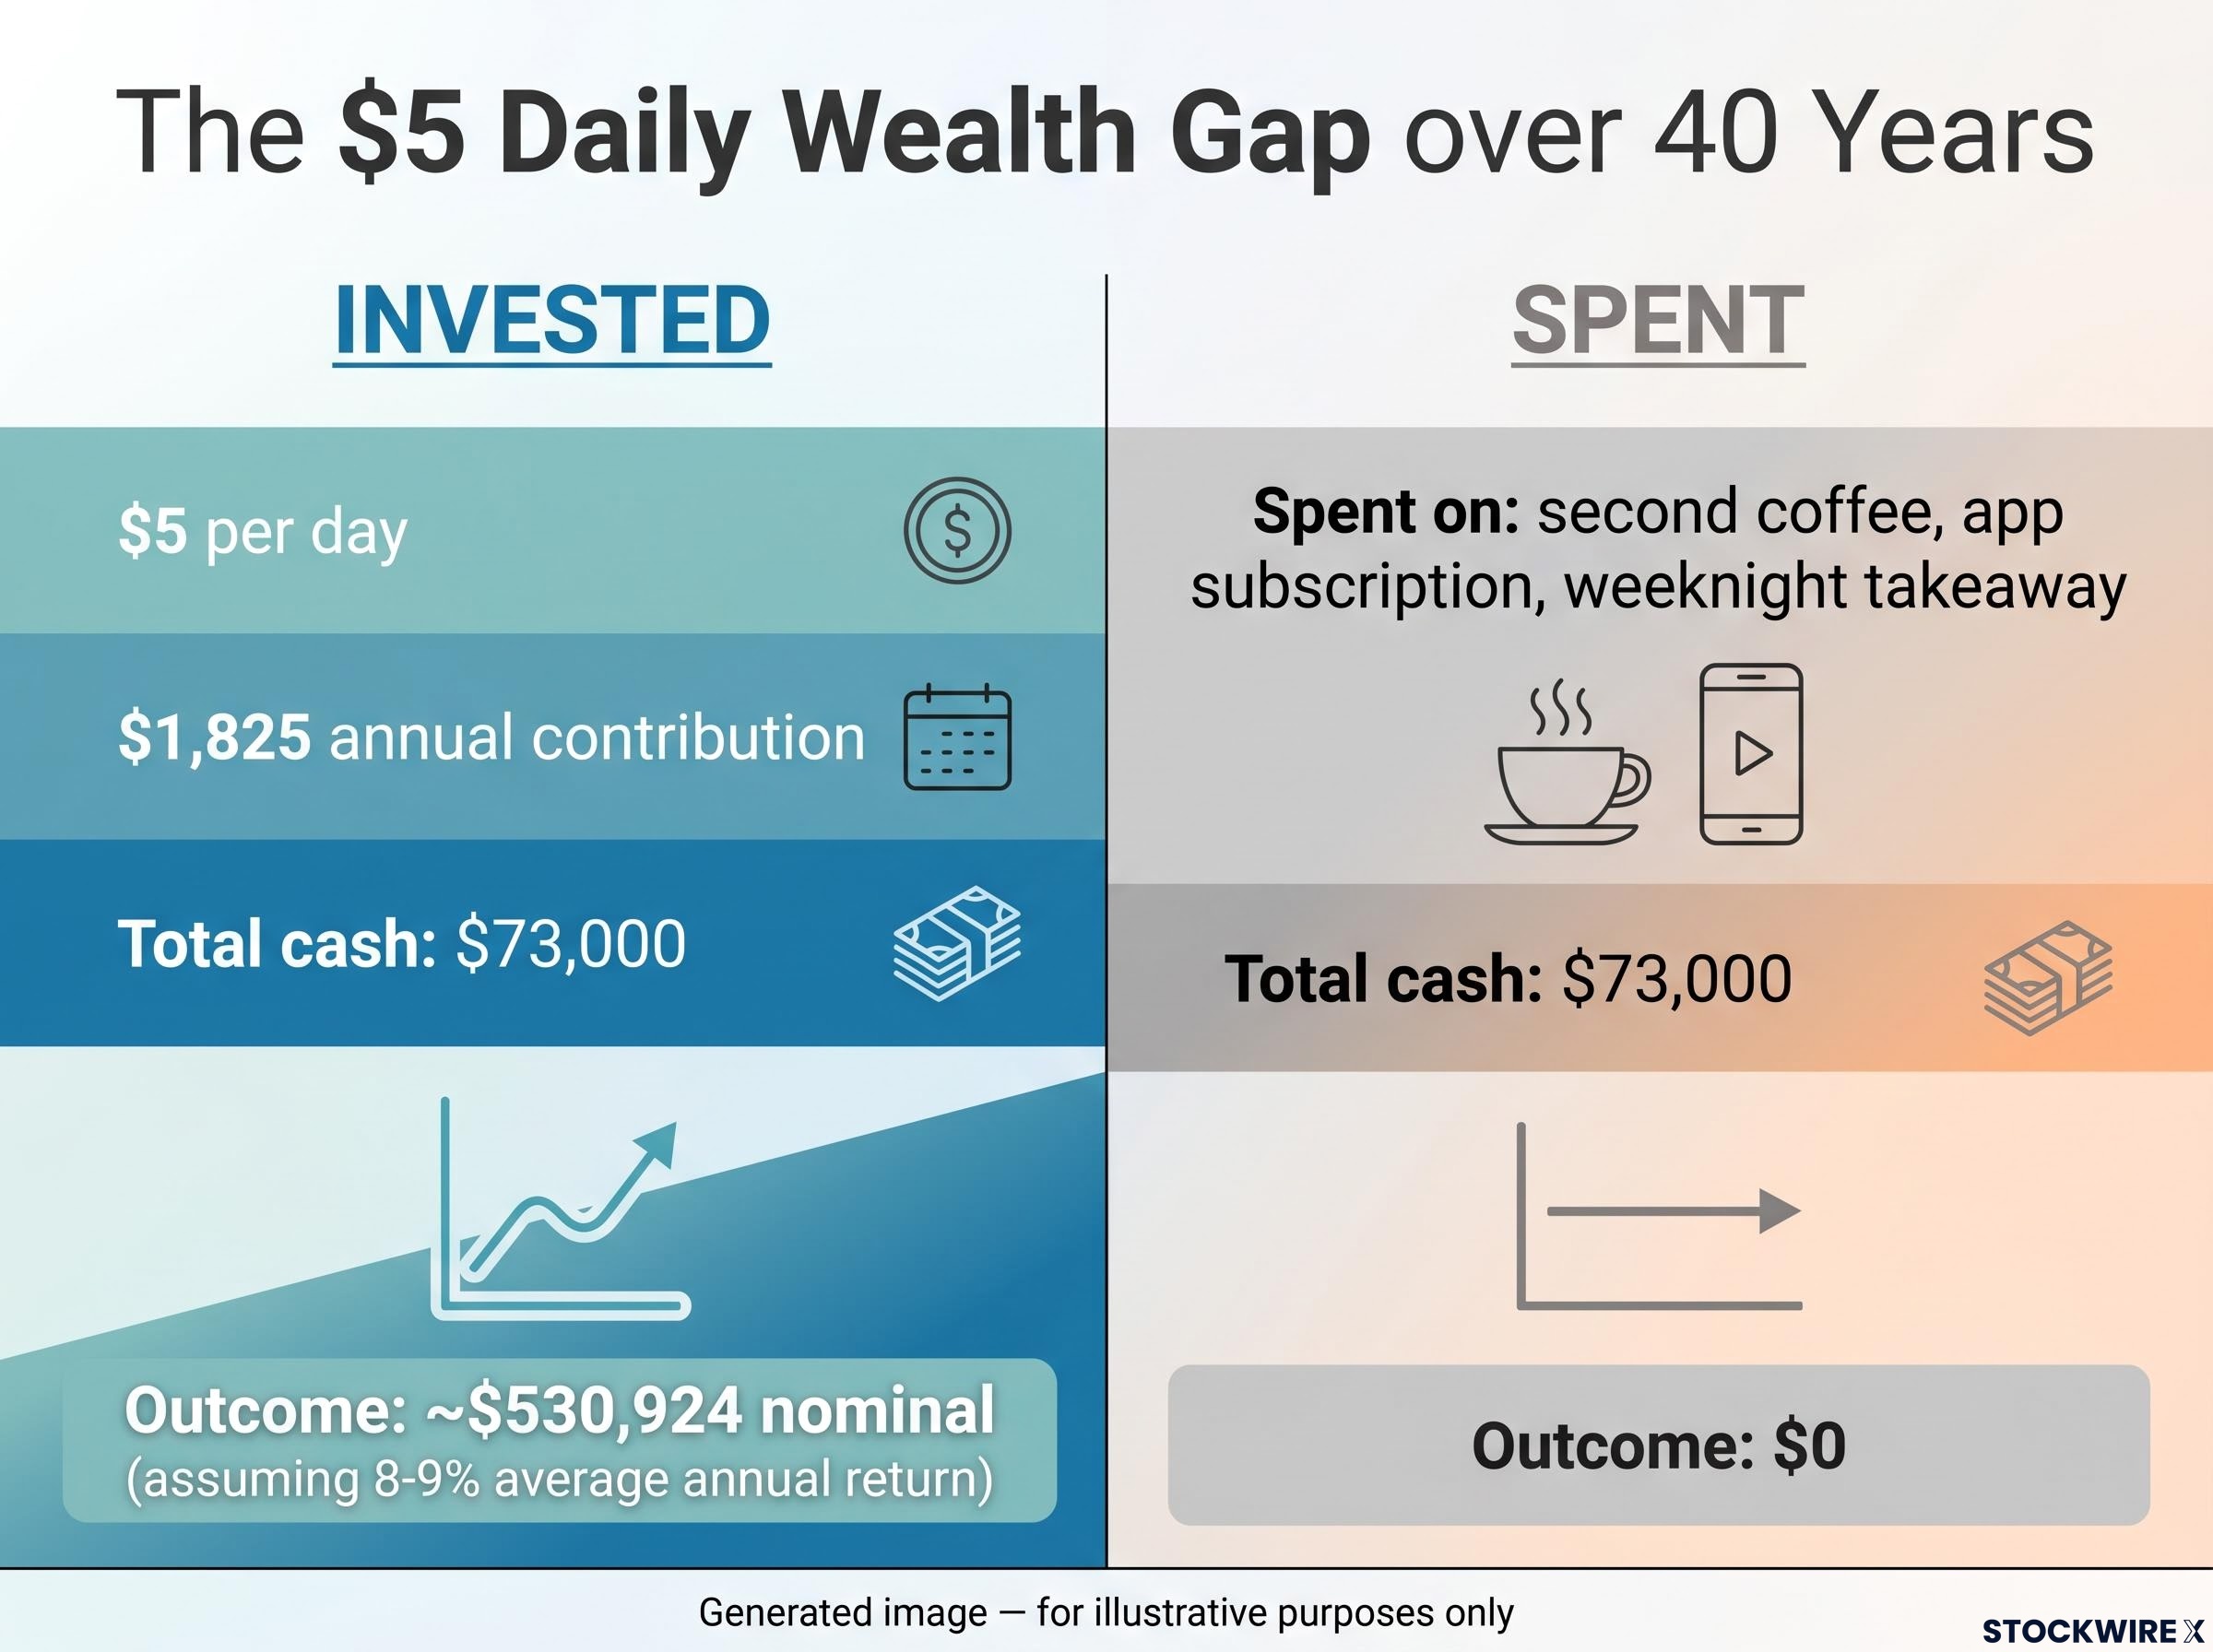
Consider two people. Same employer, same salary, same pension entitlements, same daily routines. The only difference: one redirects $5 per day into a broad equity index fund. The other spends that same $5 on small, forgettable purchases: a second coffee, an app subscription, a weeknight takeaway upgrade.
Over 40 years, both spend exactly the same amount of money on that daily $5: approximately $73,000 in total. Neither makes a sacrifice the other does not.
The investing individual was not unusually frugal. Most spending habits stayed identical. There was no dramatic lifestyle overhaul, no budgeting spreadsheet taped to the fridge. The only variable was the direction of a trivially small daily amount.
| Metric | Investor | Non-investor |
|---|---|---|
| Daily amount | $5 (invested) | $5 (spent) |
| Annual contribution | $1,825 | $0 invested |
| Total cash over 40 years | $73,000 | $73,000 |
| Terminal outcome | ~$530,924 nominal | $0 from that daily amount |
Illustrative compounding outcome: approximately $530,924 nominal from $73,000 contributed, assuming an 8-9% average annual return over 40 years. Real-world results depend on actual market returns and the specific index chosen.
The barrier to that outcome was never financial. Five dollars a day is not a sacrifice that requires willpower. The barrier is entirely psychological: believing, on thousands of unremarkable days, that a decision too small to notice is building something too large to replicate any other way.
The mathematics of compounding growth timelines reveal why the timing of the first contribution matters far more than its size: a five-year delay on identical monthly contributions can cost nearly $20,000 in terminal portfolio value, a gap no subsequent increase in contribution amount can fully close.
When big ASX news breaks, our subscribers know first
Why the market’s seismograph is not a warning sign
Broad U.S. equity indexes have historically delivered approximately 10% nominal average annual returns over long periods. After inflation adjustments, the commonly cited figure drops to roughly 7-8%, depending on the measurement period. Neither figure is guaranteed going forward, but both reflect the general range that has rewarded patient investors across multiple generations.
What those averages conceal is the path. The trajectory of an equity index over time looks like seismograph output, not a straight line. Sharp drops, sudden recoveries, months of sideways drift, then a surge that accounts for most of a year’s return in a handful of trading days. That volatility is not a malfunction. It is the expected texture of an asset class that delivers those long-run returns precisely because it carries short-run discomfort.
For broad, diversified U.S. equity indexes, every major drawdown in modern history has eventually been followed by new highs over multi-decade horizons. That is a historical observation, not a promise about what the future must deliver. Some country-specific markets have experienced extended stagnations without recovering to prior peaks, which is why broad global diversification matters more than faith in a single national index.
When the dollar loss feels larger than the percentage
Here is where the experience of long-term investing becomes genuinely difficult. Loss aversion, the well-documented tendency to feel losses more acutely than equivalent gains, operates in dollar terms, not percentages.
NBER research on loss aversion confirms that investors evaluate outcomes in dollar terms rather than percentages, which means the psychological weight of a drawdown grows proportionally with account size, not with any change in the underlying strategy’s soundness.
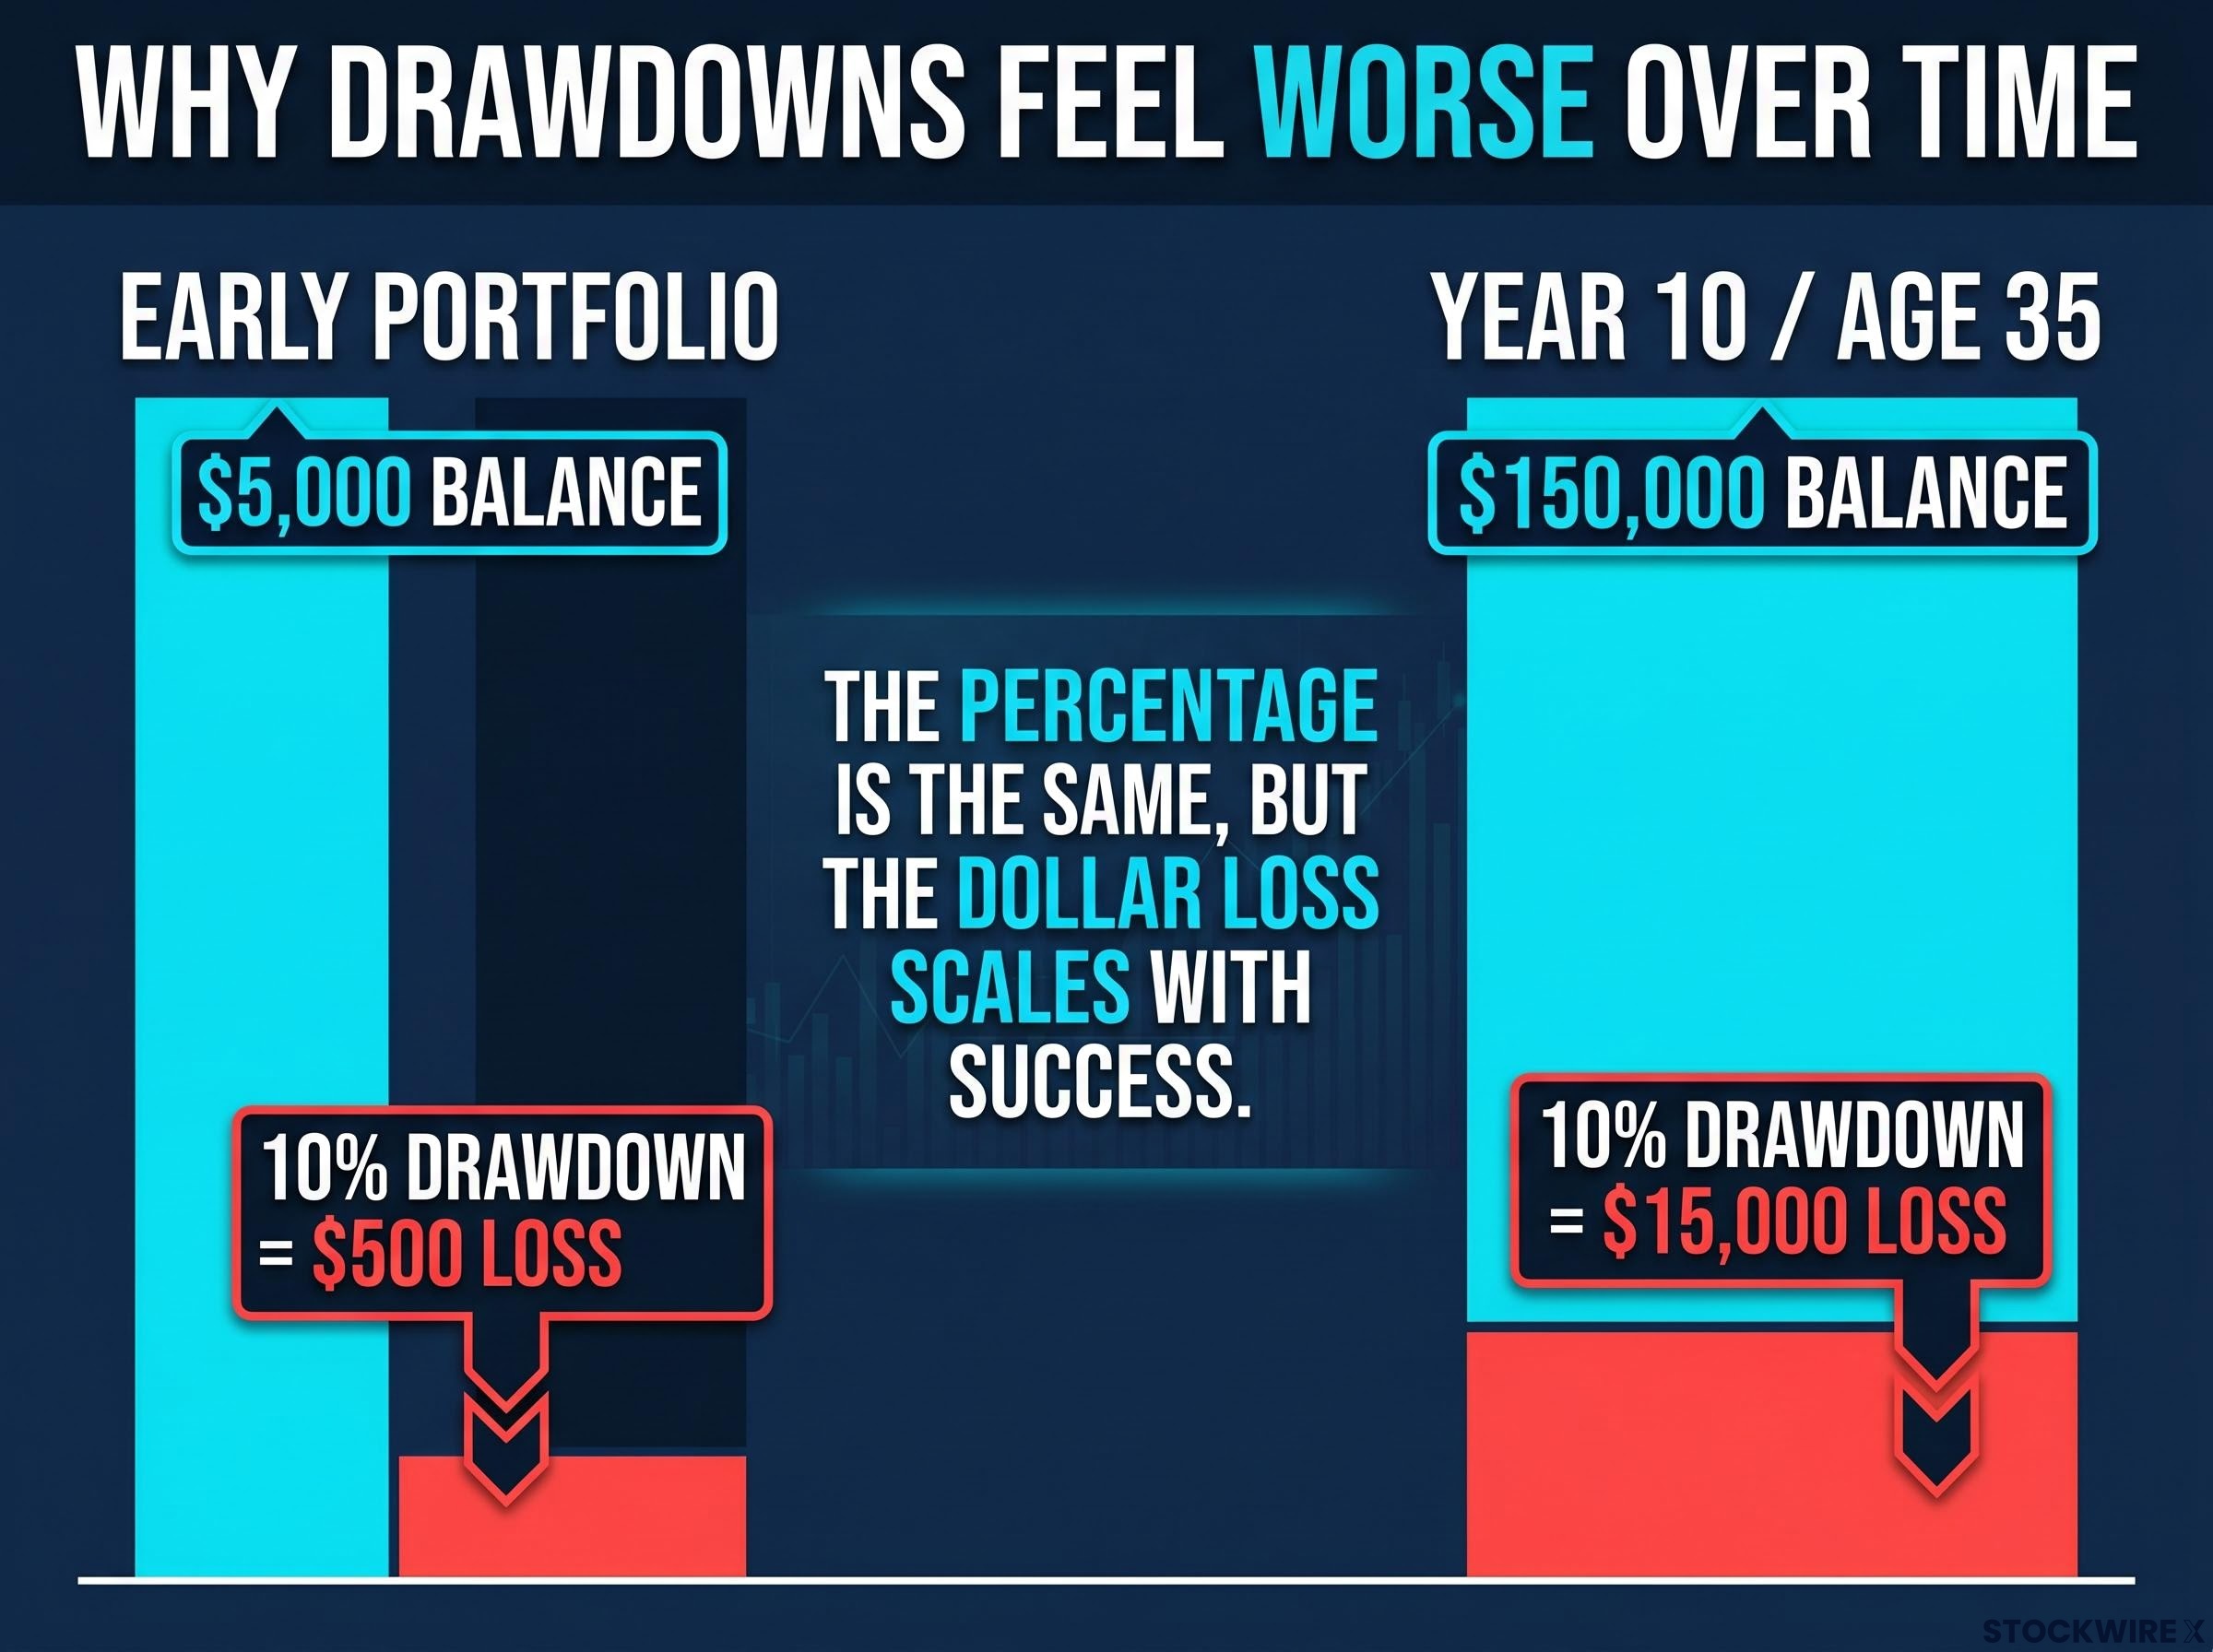
A 10% drawdown on a $5,000 balance is $500. Uncomfortable but manageable. The same 10% drawdown on a $150,000 balance is $15,000. That is a quarter’s worth of take-home pay for many workers, gone on paper in a few weeks. By around year 10 of a long-term investor’s timeline, at roughly age 35, a sharp decline can wipe out more in paper value than the entire quarterly salary deposited into your account during that same period.
The rational prescription, stay the course, feels wildly inadequate when the nominal loss is that large. Understanding in advance that this discomfort is a feature of human cognition, not a flaw in your strategy, reduces its power to provoke the one action that would make the loss permanent: selling.
- What volatility actually is: assets repricing in real time as new information arrives. Normal market function.
- What volatility feels like: a loss of progress, a signal that something is broken, an urgent prompt to do something.
- What the gap between those two means: the emotional experience and the correct interpretation are almost perfectly opposed, which is why behavioral design matters more than market knowledge.
The speculative detour and what it actually costs
At some point in almost every long-term investor’s journey, a speculative asset enters the conversation. Someone in the investor’s social circle had bought in early. The numbers being shared were extraordinary.
A speculative asset of this type might surge by several hundred percent within days, only to shed the vast majority of that gain within a few months of the peak being widely reported. Investments of a few thousand dollars can look like life-changing windfalls, then near-total losses, in a single quarter.
The timing problem embedded in that sequence is the part most people miss. Once a speculative gain becomes widely known, the bulk of the price appreciation has already taken place. The moment at which the gain enters public conversation and the moment at which a newcomer can actually participate are separated by almost the entire move.
- The asset moves sharply. A small number of early holders capture the gain.
- The gains become socially visible. Winners talk. Social media amplifies. The asset enters casual conversation.
- New entrants arrive at or near the peak. The social signal that drew them in is the same signal that marks the exhaustion of the move.
This is not coincidence. It is how lottery-like payoff structures work. Those who profit make noise; those who lose go quiet. At any given moment, the information reaching you is heavily weighted toward current winners while the losses remain largely invisible. The picture you are seeing is not a balanced sample of outcomes. It is, in effect, a self-selecting advertisement.
Research cited by Lyn Alden, drawing on SPIVA-style studies, shows that 92-95% of actively managed funds fail to beat their passive benchmark over 15-year horizons. The speculative retail trade carries even worse odds, because it adds timing risk on top of selection risk and typically involves assets with no earnings, no cash flow, and no structural floor under the price.
Active fund underperformance is not a streak of bad luck but a structural outcome baked into the cost arithmetic: over the one-year period ending December 2025, 79% of active large-cap U.S. equity funds failed to beat the S&P 500, and that proportion rises as the observation window lengthens toward the 15-year horizons where the 92-95% figure is most commonly cited.
Pursuing a speculative gain while also selling index holdings during a market downturn produces a double loss: the capital destroyed in the speculative position, and the recovery gains permanently forfeited by exiting the index at the wrong moment. Each decision carries its own cost, and both are made under the same emotional pressure.
What behavioral architecture actually means in practice
There is a meaningful gap between knowing what to do and being structurally capable of doing it under stress. You already know you should stay invested during a downturn. That knowledge, on its own, is not enough. Behavioral architecture, the deliberate design of a system that remains intact when your emotions are running high, is the actual work of long-term investing, more important than any specific fund selection.
The sell-decision biases that drive this pattern are not evenly distributed across investors: loss aversion, recency bias, the disposition effect, and herd behaviour each concentrate their damage at the moment of exit, which is why about 30.9% of investors who panic-sold during a major downturn never re-entered equities and forfeited subsequent recoveries entirely.
When markets fell sharply, the most effective response for a disciplined investor was essentially passive: stepping away from account screens, letting scheduled contributions carry on buying assets at lower prices, and resisting any urge to identify the exact bottom. The practical result, accumulating units throughout the decline at successively cheaper prices, was not a tactical achievement. It was a side effect of having a standing schedule and the discipline to leave it alone. By the time broader opinion had shifted and the market was widely considered safe again, those automated purchases had already been running throughout the entire downturn.
Four specific behavioral pressures act on you as an index investor, and each one has a mechanism that can be structurally neutralised:
- Visible dollar-denominated volatility. As your account grows, the same percentage decline translates into a larger and larger nominal loss. The pain scales with success.
- Social comparison against a biased sample. You are benchmarking against visible winners, not the true distribution of outcomes. Losers do not post their results.
- Absence of felt momentum. Index investing provides no immediate feedback, no “wins,” no dopamine. Speculative trades do. The asymmetry is real and persistent.
- Plausible exit narratives. Every downturn arrives with persuasive “this time is different” stories that make selling feel rational, not reckless.
The aim is not to become someone immune to fear when markets fall. The aim is to construct a system in which fear cannot find the controls that would allow it to cause lasting damage.
New York Life characterises passive index investing as appropriate for “set it and forget it” investors. Fidelity emphasises that index funds are deliberately low-maintenance, requiring managers only to track the index. The behavioral model those descriptions imply is the one you should replicate in your own system.
Three structural choices that remove the lever
Automation and deliberate friction are not laziness. They are the active structural choices that make a multi-decade strategy survivable.
- Fully automated, scheduled contributions. Set your contributions to transfer on a fixed schedule without any manual step. When markets move up or down, the money moves regardless, because there is no decision point left to exploit.
- A predefined account-checking rule during downturns. Once per quarter maximum. Limiting how often you look means limiting how often you are tempted to respond to what you see.
- A written personal policy statement about selling conditions. Agreed to in advance, not evaluated under pressure. If you define the conditions under which you would sell while calm, you have a reference point when panic suggests otherwise.
What index funds do not protect you from
Index funds reduce several risks that matter. They eliminate the risk of picking individual losers, they structurally undercut manager underperformance, and their low fees mean less of your return is lost to friction.
They do not eliminate systemic market risk. When the broad market falls 30%, your index fund falls approximately 30%. Diversification removes the incremental risk of bad stock picks; it does not remove the market-wide risk that drives the drawdowns discussed earlier.
Pullback readiness is not only a psychological question but a structural one: an investor whose income is tied to a cyclical industry and who holds a heavily equity-weighted portfolio faces compounded vulnerability when conditions deteriorate, which is why capital with a horizon shorter than seven years should never be considered for deployment regardless of how attractive index prices appear.
- Risks index funds reduce: individual stock failure, active manager underperformance, high trading costs and fees
- Risks index funds do not eliminate: systemic market downturns, concentration in top holdings, extended stagnation in country-specific indexes
Concentration risk deserves specific attention. Standard cap-weighted index funds overweight the largest companies by market capitalisation. As Lyn Alden has noted, this can create meaningful concentration even within an index strategy when valuations in those top holdings are extreme. For the “do nothing” approach to apply cleanly, a total-market or all-world fund is generally preferable to a narrow sector or single-country index.
| Risk index funds reduce | Risk index funds do not eliminate |
|---|---|
| Individual stock failure | Broad market downturns |
| Active manager underperformance | Concentration in top holdings (cap-weighted) |
| High trading costs and fees | Extended stagnation in country-specific indexes |
The 92-95% active fund underperformance figure cited by Lyn Alden applies over 15-year horizons. Over shorter periods, the proportion underperforming is somewhat lower. The case for passive indexing is strongest on long time horizons, which is exactly the context here.
Both Fidelity and other major providers explicitly warn that past performance is not a guarantee of future results. Broad U.S. equity indexes have a strong historical track record of recovering from drawdowns, but that track record is simply a summary of what occurred in the past. It carries no binding force over what markets will do next.
This article is for informational purposes only and should not be considered financial advice. Investors should conduct their own research and consult with financial professionals before making investment decisions. Past performance does not guarantee future results. Financial projections are subject to market conditions and various risk factors.
Staying invested is the active choice
The three arguments in this piece interlock. Time makes the compounding return available to almost anyone willing to redirect a trivially small daily amount. Behavioral architecture is the mechanism that protects your access to that return when the emotional cost of staying invested becomes genuinely painful. And the structural choices, automation, friction, a written policy, are what make the behavioral system survivable across the decades it needs to operate.
The gap between the two individuals in the $5-per-day comparison was not produced by intelligence, income, or market knowledge. It was produced by the consistency of a direction sustained across thousands of unremarkable days, none of which felt significant at the time.
Your next market downturn will arrive with compelling narratives about why this time is different. The question is not whether those narratives will be persuasive. They will be. The question is whether your structure makes it possible to do nothing in spite of them.
Wealth compounds not through dramatic intervention but through the quiet, unglamorous habit of remaining invested across the periods when doing so feels most difficult. Lock that habit into your structure once, and you remove the need to summon the willpower to honour it again and again under pressure.